Business Decision Making Report: Full Discount Ltd Supermarket Chain
VerifiedAdded on  2020/10/05
|22
|4007
|135
Report
AI Summary
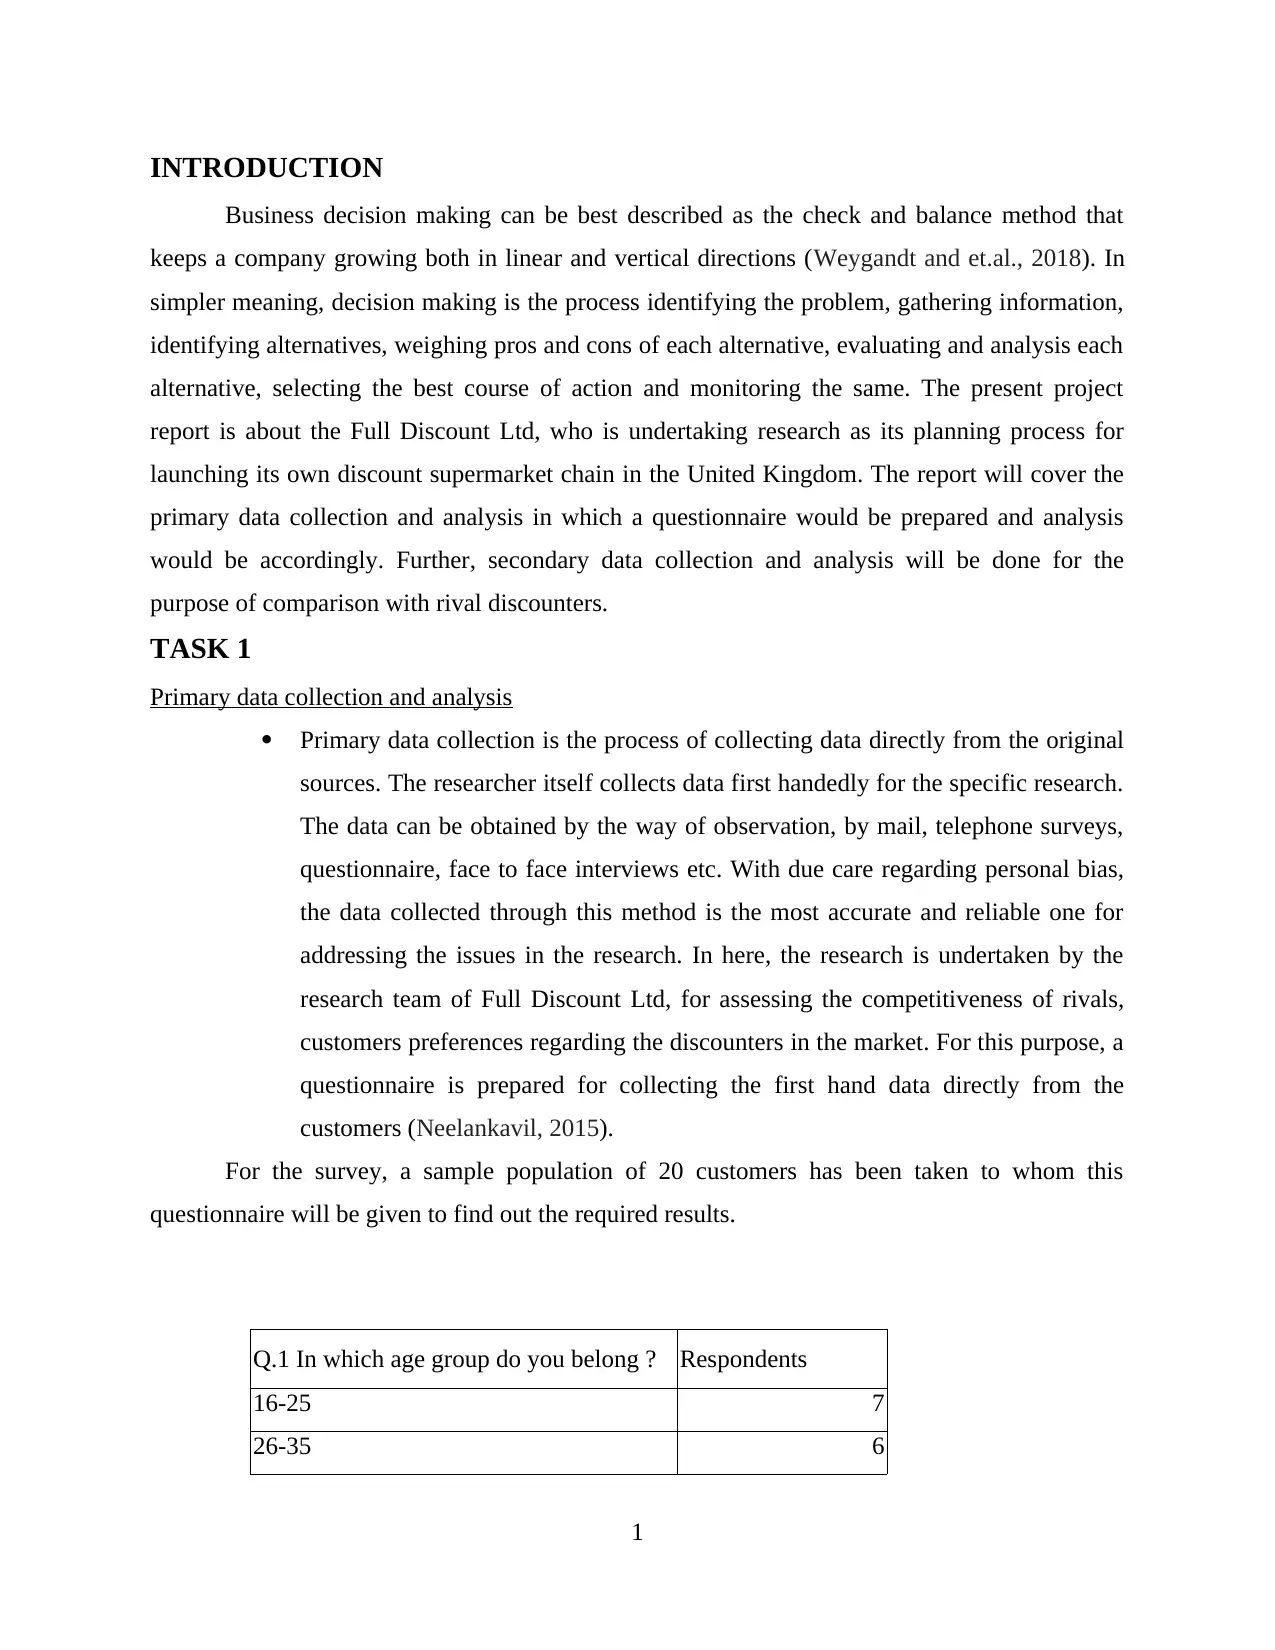
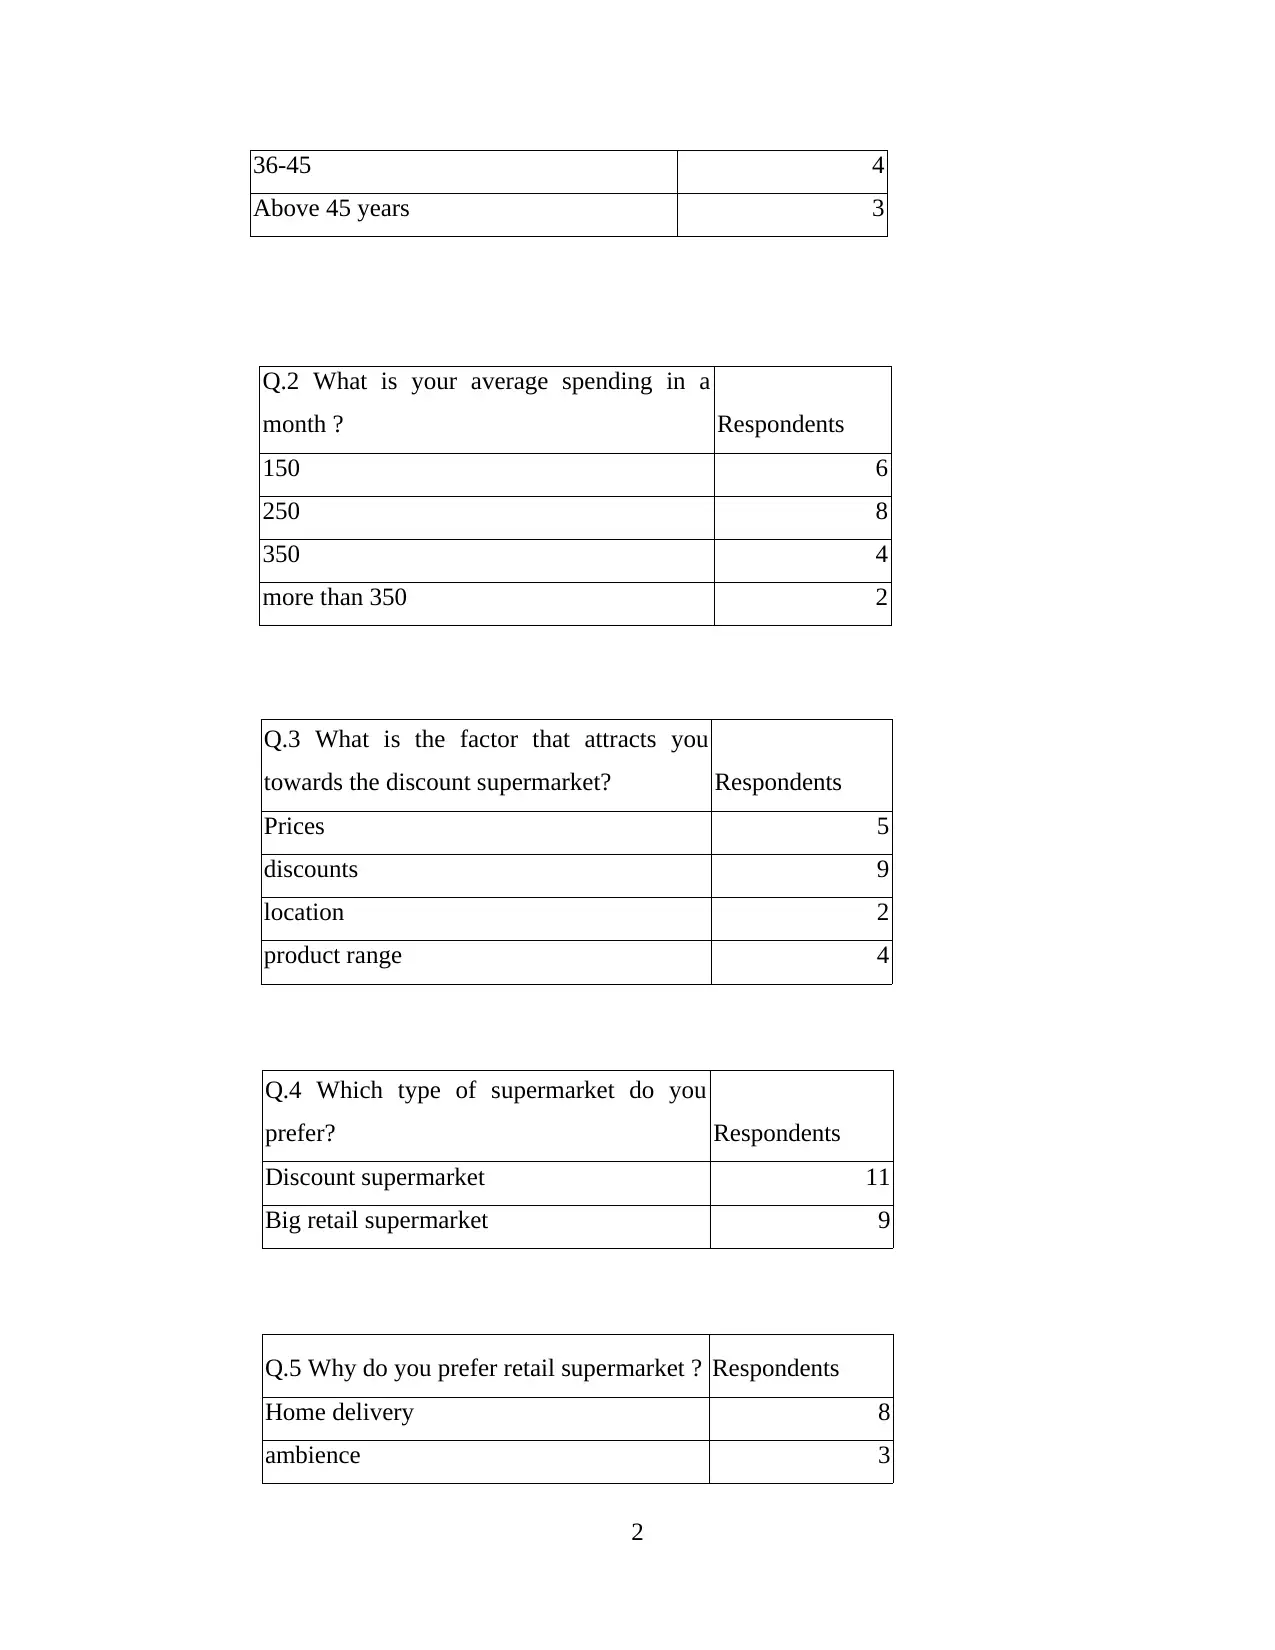
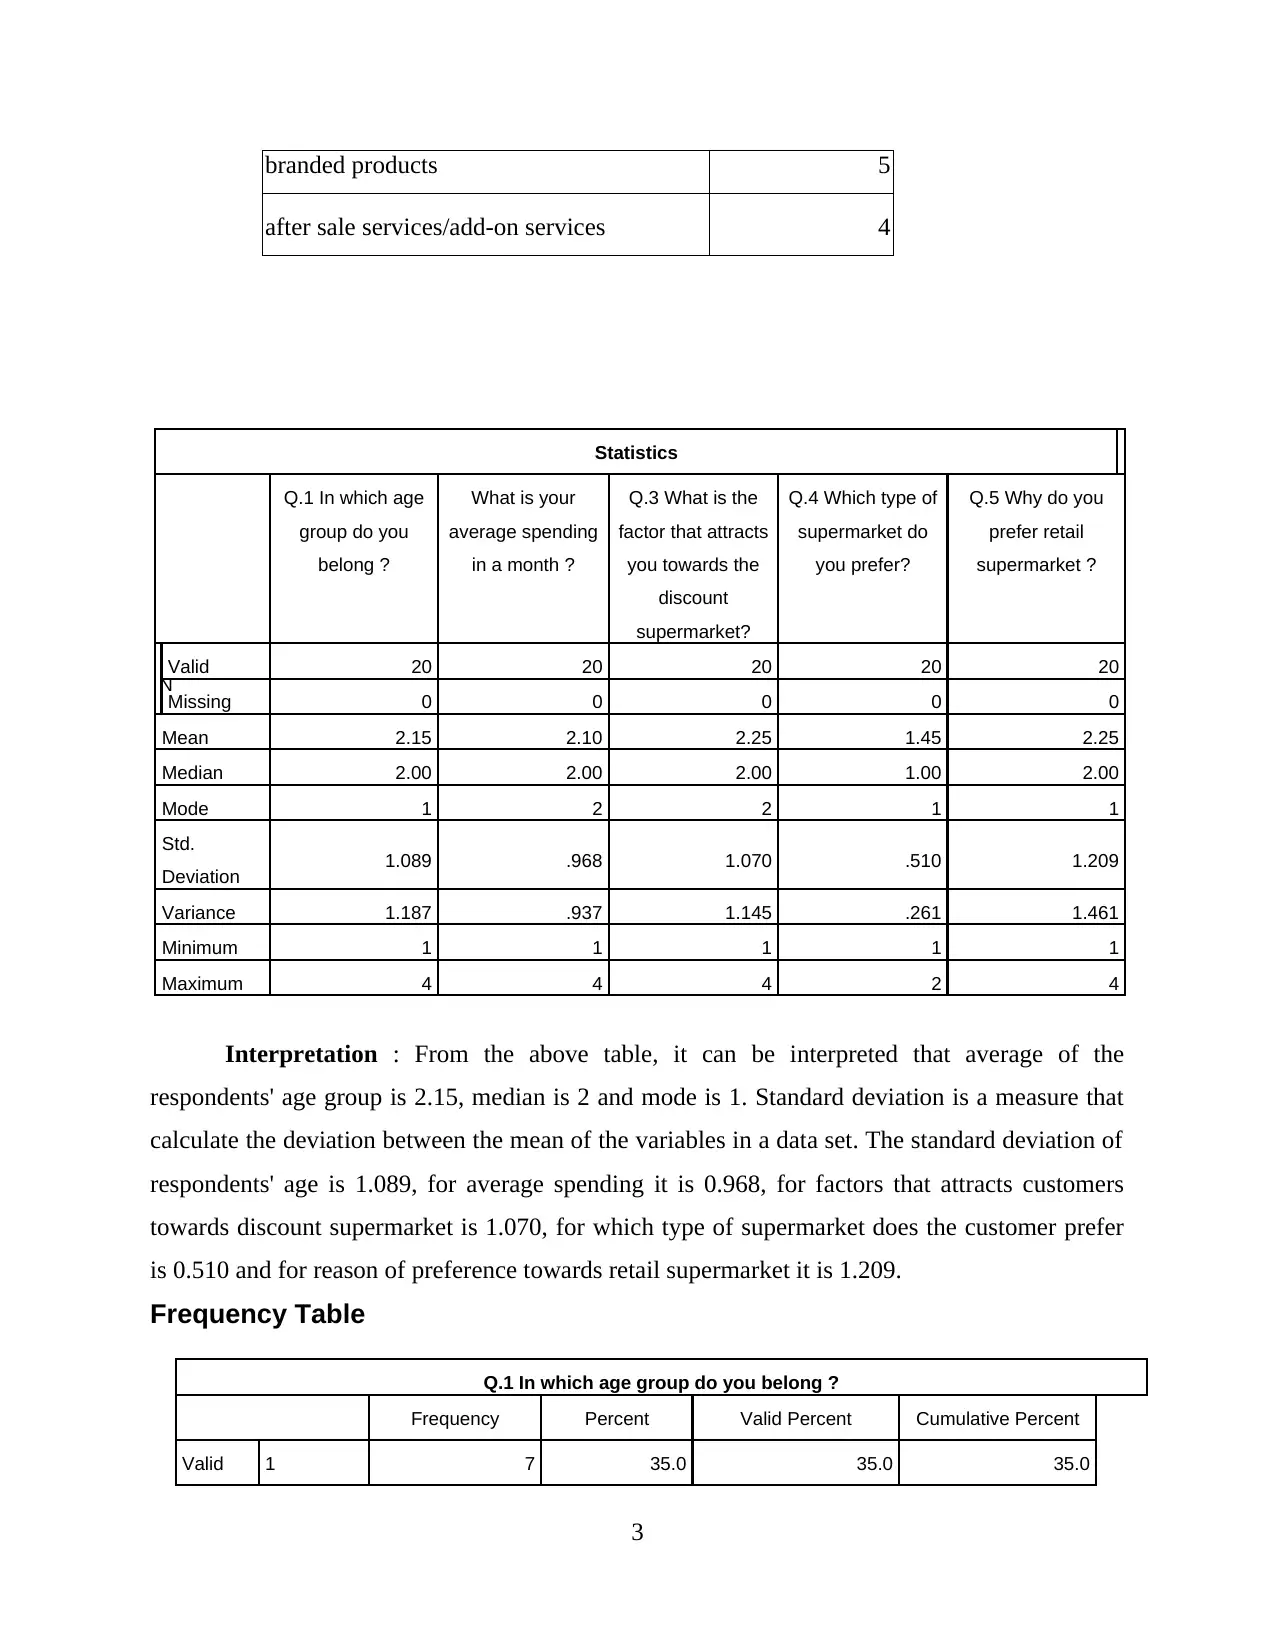
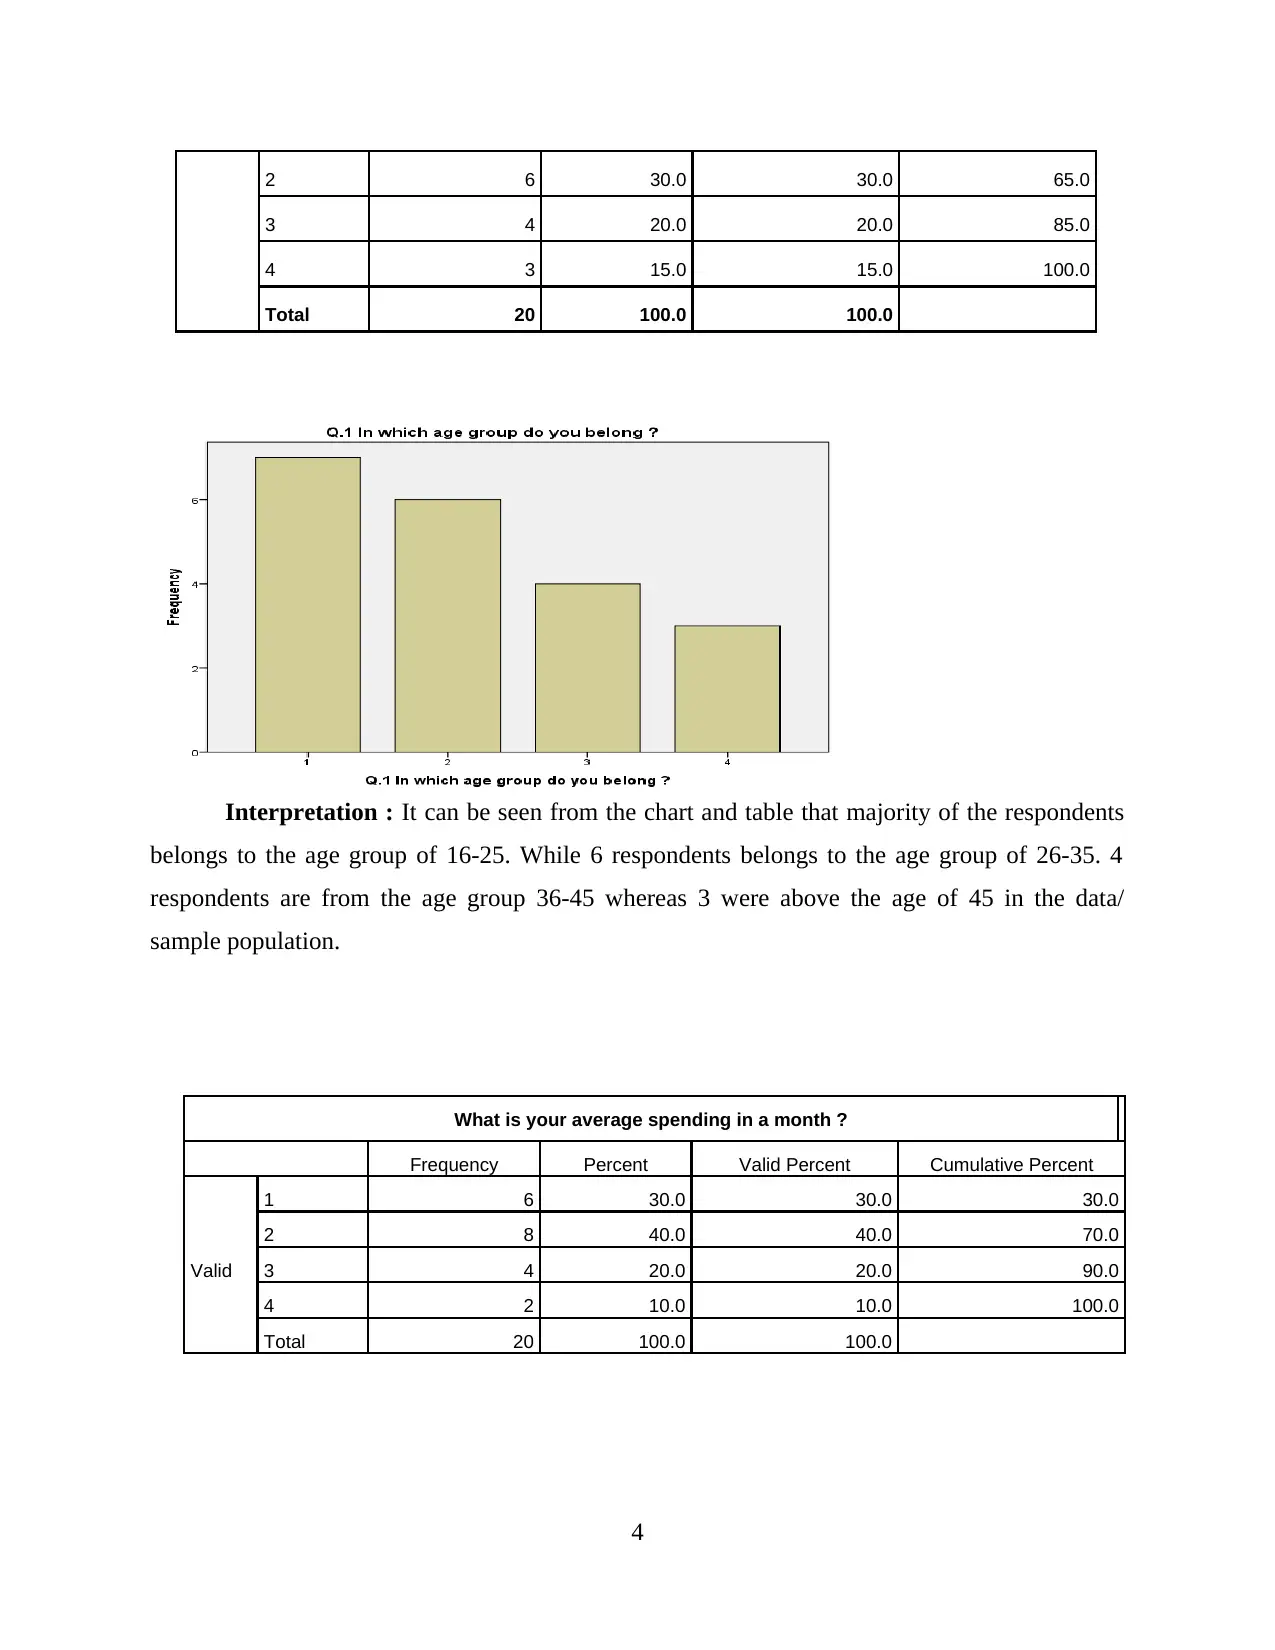
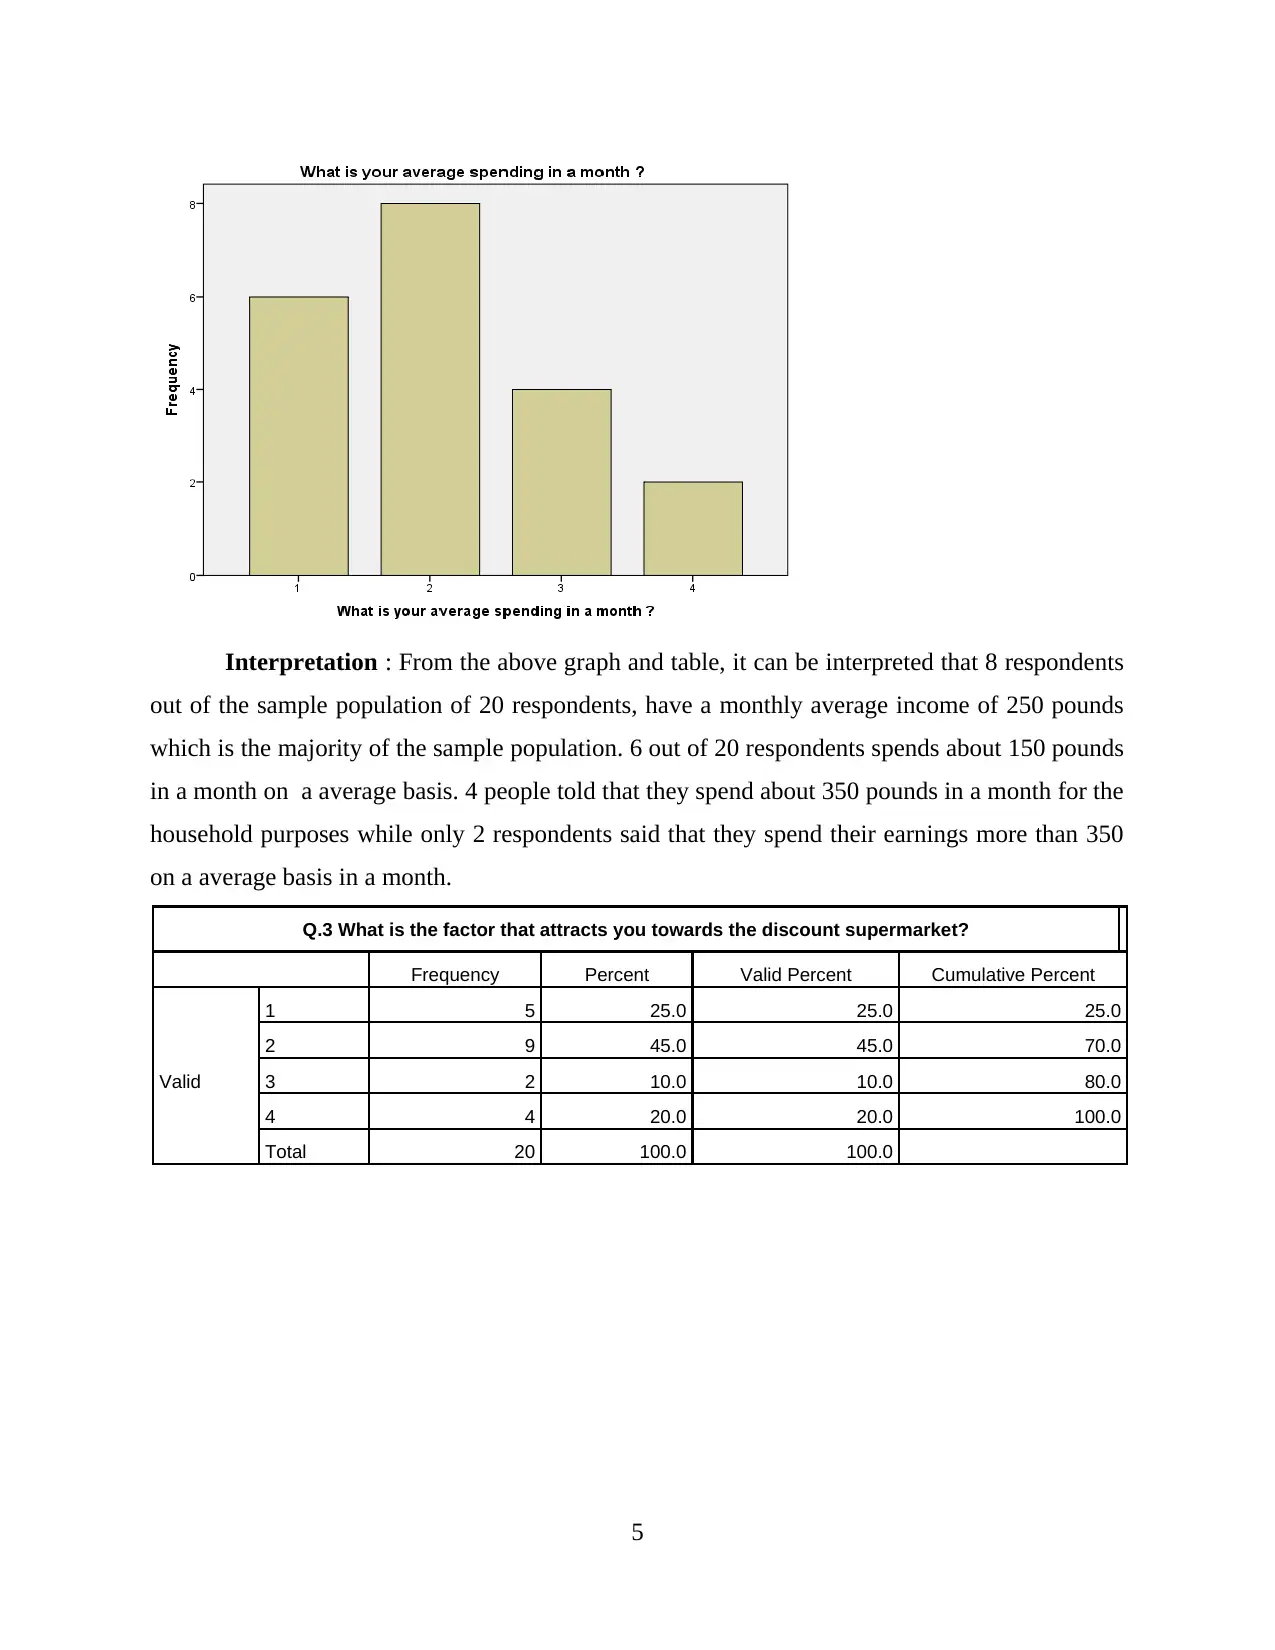
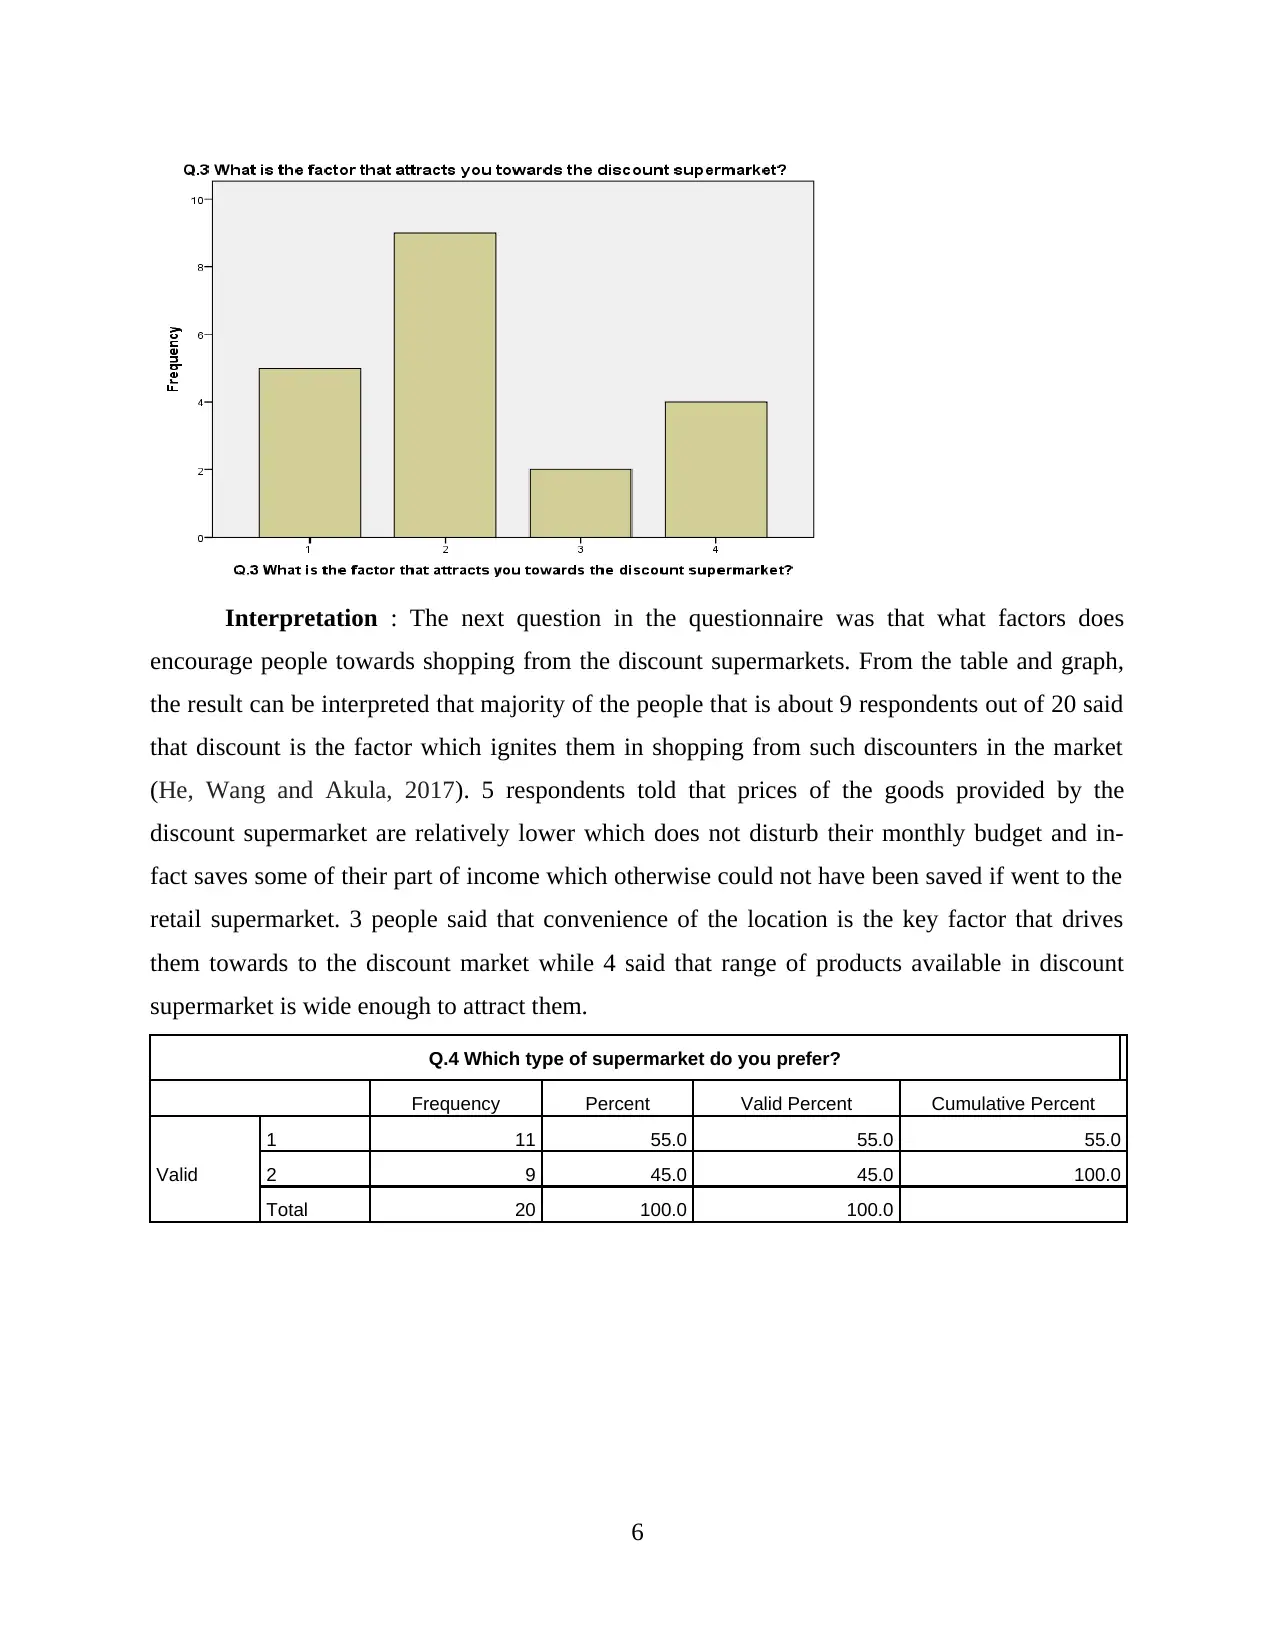
This report analyzes the business decision-making process for Full Discount Ltd, focusing on the feasibility of launching a discount supermarket chain in the UK. The study includes both primary and secondary research methods. Primary research involved a questionnaire administered to a sample of 20 customers to gauge preferences regarding discount supermarkets, spending habits, and factors influencing their choices. The analysis of primary data includes statistical measures like mean, median, standard deviation, and frequency tables, along with graphical representations to illustrate findings. Secondary research involved the analysis of financial data from competitors like B&M, Tesco, and Sainsbury's, specifically examining gross profit, operating profit, and net profit ratios to assess their financial performance. The report provides a comprehensive overview of the market landscape, customer behavior, and the competitive environment to inform Full Discount Ltd's strategic decisions.

BUSINESS DECISION MAKING
Paraphrase This Document
Need a fresh take? Get an instant paraphrase of this document with our AI Paraphraser

EXECUTIVE SUMMARY
Business decision making is considered as one of the most important component of
modern management. Precise decision making is taken as the crucial function of management.
Business decision making term can be understood as the process of selection of the best course
of action from amongst two or more alternatives for arriving at answer to a business problem. In
the project report, a primary and secondary research is conducted by a member of research team
of Full discount Ltd. Primary research is the method where the information is collected first
handedly by the researcher itself while secondary research is one where information for the study
is drawn out from the already established data. In primary research, a questionnaire is prepared
where sample population of 20 is taken. In secondary data analysis, mean, median and standard
deviation is computed along with line and bar charts. The company has undertaken this research
as it planning process for introducing its own discount supermarket chain in UK.

Table of Contents
EXECUTIVE SUMMARY.............................................................................................................2
INTRODUCTION...........................................................................................................................1
TASK 1 ...........................................................................................................................................1
Primary data collection and analysis............................................................................................1
TASK 2 ...........................................................................................................................................8
Secondary data collection and analysis........................................................................................8
RECOMMENDATIONS...............................................................................................................13
CONCLUSION..............................................................................................................................13
REFERENCES..............................................................................................................................15
APPENDICES...............................................................................................................................16
⊘ This is a preview!⊘
Do you want full access?
Subscribe today to unlock all pages.

Trusted by 1+ million students worldwide

INTRODUCTION
Business decision making can be best described as the check and balance method that
keeps a company growing both in linear and vertical directions (Weygandt and et.al., 2018). In
simpler meaning, decision making is the process identifying the problem, gathering information,
identifying alternatives, weighing pros and cons of each alternative, evaluating and analysis each
alternative, selecting the best course of action and monitoring the same. The present project
report is about the Full Discount Ltd, who is undertaking research as its planning process for
launching its own discount supermarket chain in the United Kingdom. The report will cover the
primary data collection and analysis in which a questionnaire would be prepared and analysis
would be accordingly. Further, secondary data collection and analysis will be done for the
purpose of comparison with rival discounters.
TASK 1
Primary data collection and analysis
ï‚· Primary data collection is the process of collecting data directly from the original
sources. The researcher itself collects data first handedly for the specific research.
The data can be obtained by the way of observation, by mail, telephone surveys,
questionnaire, face to face interviews etc. With due care regarding personal bias,
the data collected through this method is the most accurate and reliable one for
addressing the issues in the research. In here, the research is undertaken by the
research team of Full Discount Ltd, for assessing the competitiveness of rivals,
customers preferences regarding the discounters in the market. For this purpose, a
questionnaire is prepared for collecting the first hand data directly from the
customers (Neelankavil, 2015).
For the survey, a sample population of 20 customers has been taken to whom this
questionnaire will be given to find out the required results.
Q.1 In which age group do you belong ? Respondents
16-25 7
26-35 6
1
Paraphrase This Document
Need a fresh take? Get an instant paraphrase of this document with our AI Paraphraser

36-45 4
Above 45 years 3
Q.2 What is your average spending in a
month ? Respondents
150 6
250 8
350 4
more than 350 2
Q.3 What is the factor that attracts you
towards the discount supermarket? Respondents
Prices 5
discounts 9
location 2
product range 4
Q.4 Which type of supermarket do you
prefer? Respondents
Discount supermarket 11
Big retail supermarket 9
Q.5 Why do you prefer retail supermarket ? Respondents
Home delivery 8
ambience 3
2

branded products 5
after sale services/add-on services 4
Statistics
Q.1 In which age
group do you
belong ?
What is your
average spending
in a month ?
Q.3 What is the
factor that attracts
you towards the
discount
supermarket?
Q.4 Which type of
supermarket do
you prefer?
Q.5 Why do you
prefer retail
supermarket ?
N
Valid 20 20 20 20 20
Missing 0 0 0 0 0
Mean 2.15 2.10 2.25 1.45 2.25
Median 2.00 2.00 2.00 1.00 2.00
Mode 1 2 2 1 1
Std.
Deviation 1.089 .968 1.070 .510 1.209
Variance 1.187 .937 1.145 .261 1.461
Minimum 1 1 1 1 1
Maximum 4 4 4 2 4
Interpretation : From the above table, it can be interpreted that average of the
respondents' age group is 2.15, median is 2 and mode is 1. Standard deviation is a measure that
calculate the deviation between the mean of the variables in a data set. The standard deviation of
respondents' age is 1.089, for average spending it is 0.968, for factors that attracts customers
towards discount supermarket is 1.070, for which type of supermarket does the customer prefer
is 0.510 and for reason of preference towards retail supermarket it is 1.209.
Frequency Table
Q.1 In which age group do you belong ?
Frequency Percent Valid Percent Cumulative Percent
Valid 1 7 35.0 35.0 35.0
3
⊘ This is a preview!⊘
Do you want full access?
Subscribe today to unlock all pages.

Trusted by 1+ million students worldwide

2 6 30.0 30.0 65.0
3 4 20.0 20.0 85.0
4 3 15.0 15.0 100.0
Total 20 100.0 100.0
Interpretation : It can be seen from the chart and table that majority of the respondents
belongs to the age group of 16-25. While 6 respondents belongs to the age group of 26-35. 4
respondents are from the age group 36-45 whereas 3 were above the age of 45 in the data/
sample population.
What is your average spending in a month ?
Frequency Percent Valid Percent Cumulative Percent
Valid
1 6 30.0 30.0 30.0
2 8 40.0 40.0 70.0
3 4 20.0 20.0 90.0
4 2 10.0 10.0 100.0
Total 20 100.0 100.0
4
Paraphrase This Document
Need a fresh take? Get an instant paraphrase of this document with our AI Paraphraser

Interpretation : From the above graph and table, it can be interpreted that 8 respondents
out of the sample population of 20 respondents, have a monthly average income of 250 pounds
which is the majority of the sample population. 6 out of 20 respondents spends about 150 pounds
in a month on a average basis. 4 people told that they spend about 350 pounds in a month for the
household purposes while only 2 respondents said that they spend their earnings more than 350
on a average basis in a month.
Q.3 What is the factor that attracts you towards the discount supermarket?
Frequency Percent Valid Percent Cumulative Percent
Valid
1 5 25.0 25.0 25.0
2 9 45.0 45.0 70.0
3 2 10.0 10.0 80.0
4 4 20.0 20.0 100.0
Total 20 100.0 100.0
5

Interpretation : The next question in the questionnaire was that what factors does
encourage people towards shopping from the discount supermarkets. From the table and graph,
the result can be interpreted that majority of the people that is about 9 respondents out of 20 said
that discount is the factor which ignites them in shopping from such discounters in the market
(He, Wang and Akula, 2017). 5 respondents told that prices of the goods provided by the
discount supermarket are relatively lower which does not disturb their monthly budget and in-
fact saves some of their part of income which otherwise could not have been saved if went to the
retail supermarket. 3 people said that convenience of the location is the key factor that drives
them towards to the discount market while 4 said that range of products available in discount
supermarket is wide enough to attract them.
Q.4 Which type of supermarket do you prefer?
Frequency Percent Valid Percent Cumulative Percent
Valid
1 11 55.0 55.0 55.0
2 9 45.0 45.0 100.0
Total 20 100.0 100.0
6
⊘ This is a preview!⊘
Do you want full access?
Subscribe today to unlock all pages.

Trusted by 1+ million students worldwide

Interpretation : When the people were asked about which supermarket they prefer, most
of the respondents around 11 out of 20 said that they prefer discount supermarket over retail
supermarket such as B&M and Home Bargains while 9 respondents said that they like to shop
their households, grocery and other products from the retail supermarkets like Asda, Tesco etc.,
only.
Q.5 Why do you prefer retail supermarket ?
Frequency Percent Valid Percent Cumulative Percent
Valid
1 8 40.0 40.0 40.0
2 3 15.0 15.0 55.0
3 5 25.0 25.0 80.0
4 4 20.0 20.0 100.0
Total 20 100.0 100.0
7
Paraphrase This Document
Need a fresh take? Get an instant paraphrase of this document with our AI Paraphraser

Interpretation : From the above graph, it can be interpreted that home delivery is the
biggest reason why people opt for the retail supermarket. 8 people said that retailers provides the
facility of home delivery to them which saves their time. 5 respondents said that they prefer
branded clothes over the regular clothes, which is the reason why they go to such retail
supermarkets. 4 people said that add on facilities are attracts them towards the retailers and
enhances their experience that helps them in achieving the utility of the money they are spending
in the retail supermarkets. 3 people out of 20 said that they enjoy the ambience of the retail
supermarkets.
TASK 2
Secondary data collection and analysis
Secondary data is such data which already exists. This means that it is such data has been
published already on the internet, journals, newspaper, articles etc. Secondary data is collected
by a person for a purpose other the researcher's current issue and that data has already gone
through the process of statistical analysis. This is the reason why it is called as second hand data
(Secondary Data Collection Methods, 2019).
The internal methods from where the secondary data can be taken are financial
statements, customer's details, MIS, company information, feedbacks from customers, suppliers,
etc. External sources could be census of government, business magazines, journals, internet,
libraries etc. The secondary data could be both quantitative and qualitative. Qualitative data
could be attained by the way of newspapers, interviews , transcripts etc., while quantitative data
can be attained through survey, financial statements and statistics which are published.
8

Profitability analysis of B & M, Tesco and Sainsbury
Gross profit ratio:
B&M
2015 2016 2017 2018
Gross profit/sales Gross profit 570 703 844 1029
sales 1647 2035 2431 3030
GP ratio 34.61% 34.55% 34.72% 33.96%
Interpretation : From the above table, it can be said that gross profit of B&M has
remained constant over the last four years. It was stable at the rate of 34.61% for the year
2015,2016, 2017. However, it slightly reduced to 33.96% with a variance of 0.22%. Gross profit
ratio shows firm's income before any operating expenses in response to the revenue generated for
the year.
Operating profit ratio :
Operating
profit/sales 2015 2016 2017 2018
Operating profit 157 181 205 240
sales 1647 2035 2431 3030
Operating profit
margin 9.53% 8.89% 8.43% 7.92%
Interpretation : Operating profit is the income left after deducting all the operating
expenses. The company had the operating profit of 9.53% in 2015 which is continuously
decreasing in the next following years. This means that operating expenses of the company are
increasing more than increase in the gross revenues.
Net profit ratio :
2015 2016 2017 2018
net income/sales net profit 39 125 143 186
9
⊘ This is a preview!⊘
Do you want full access?
Subscribe today to unlock all pages.

Trusted by 1+ million students worldwide
1 out of 22
Related Documents

Your All-in-One AI-Powered Toolkit for Academic Success.
 +13062052269
info@desklib.com
Available 24*7 on WhatsApp / Email
Unlock your academic potential
Copyright © 2020–2025 A2Z Services. All Rights Reserved. Developed and managed by ZUCOL.