Comprehensive Solutions: Functions, Modeling, and Asymptotes
VerifiedAdded on 2023/06/12
|7
|1135
|59
Homework Assignment
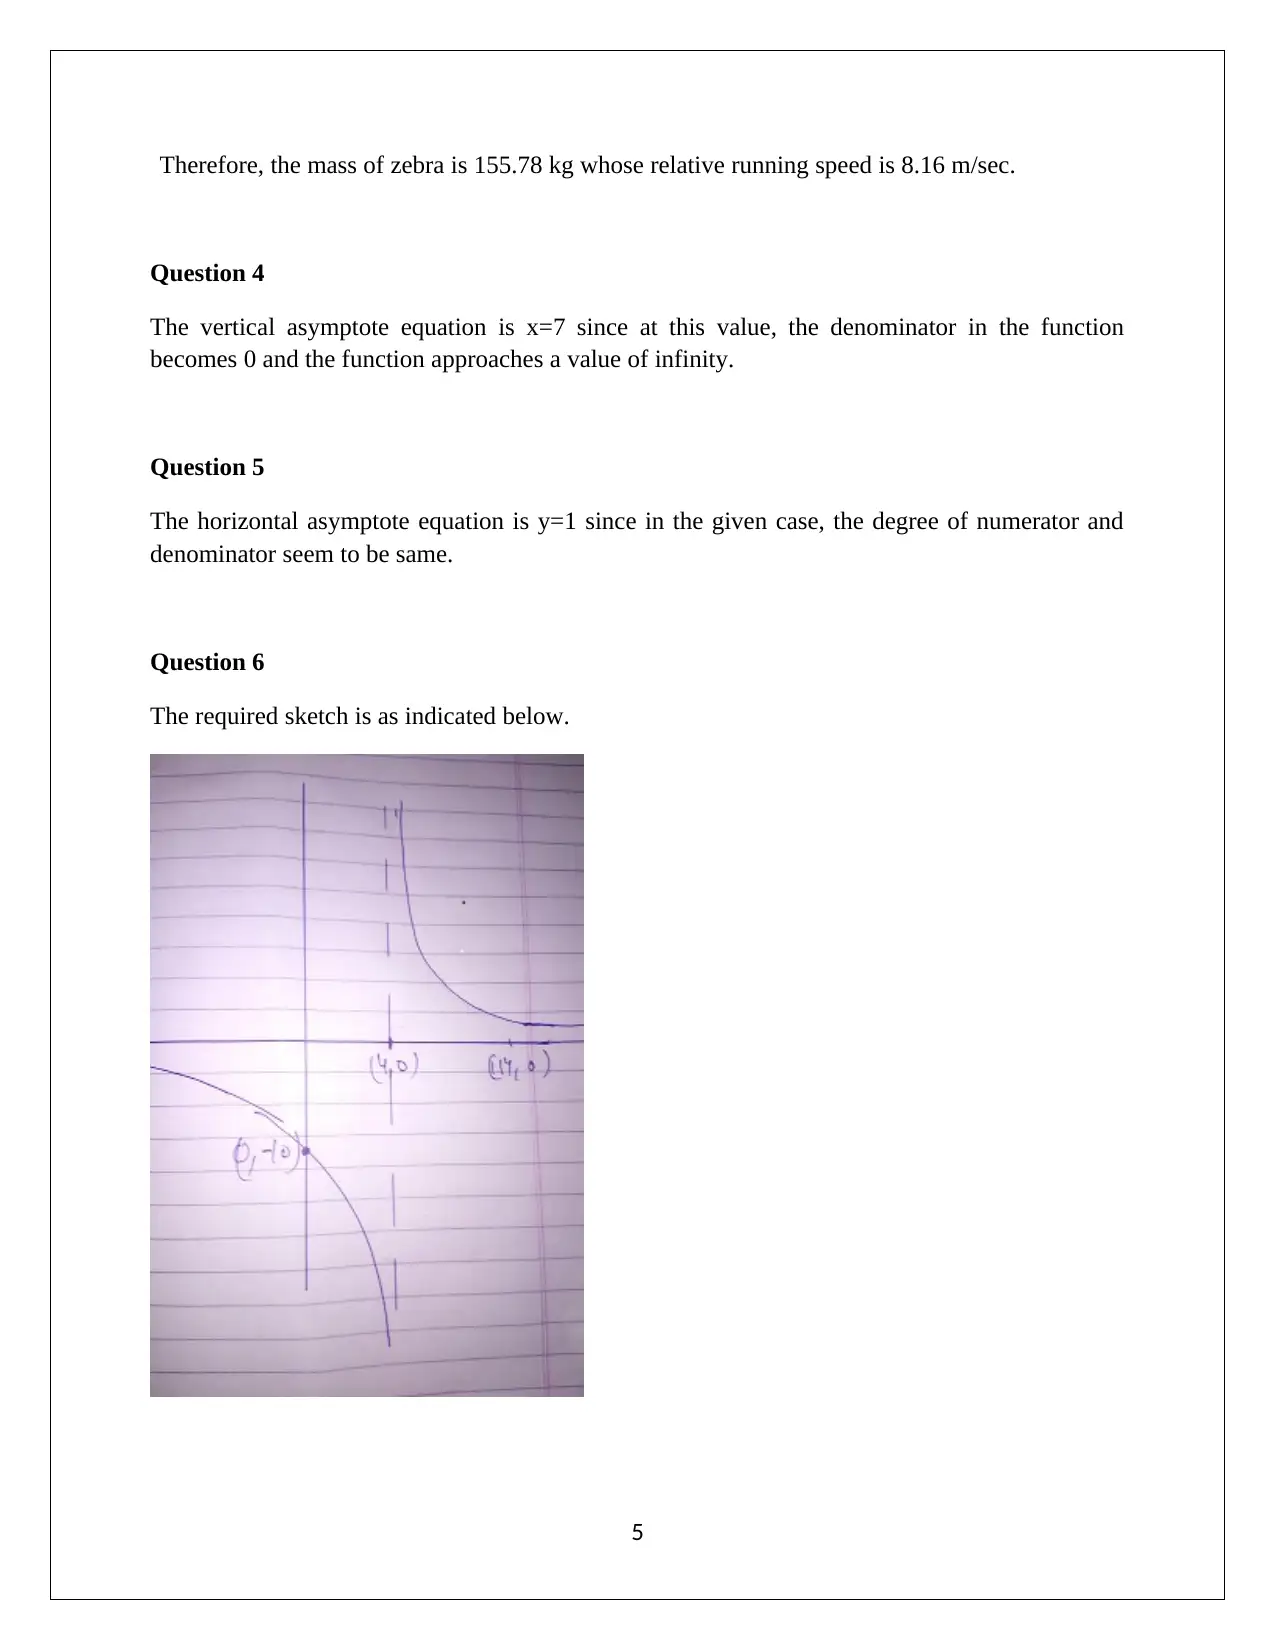
AI Summary
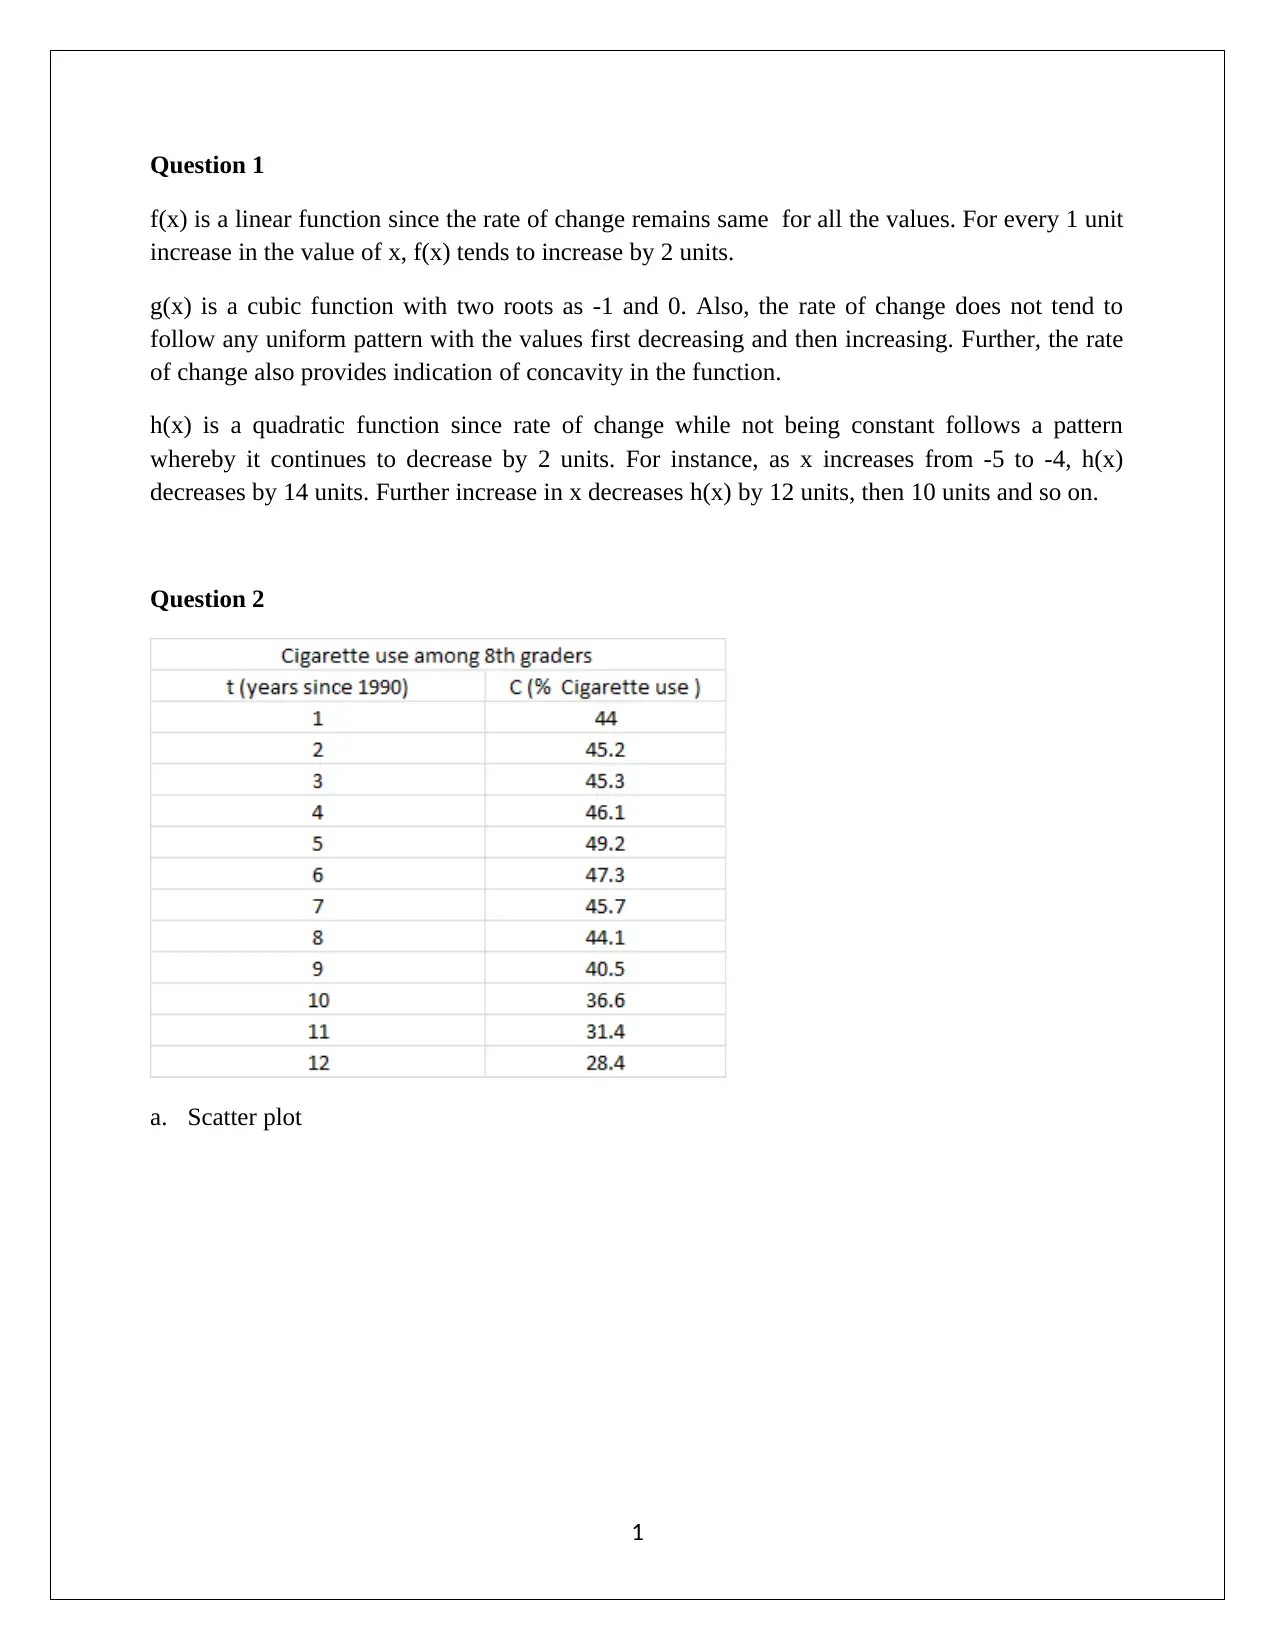
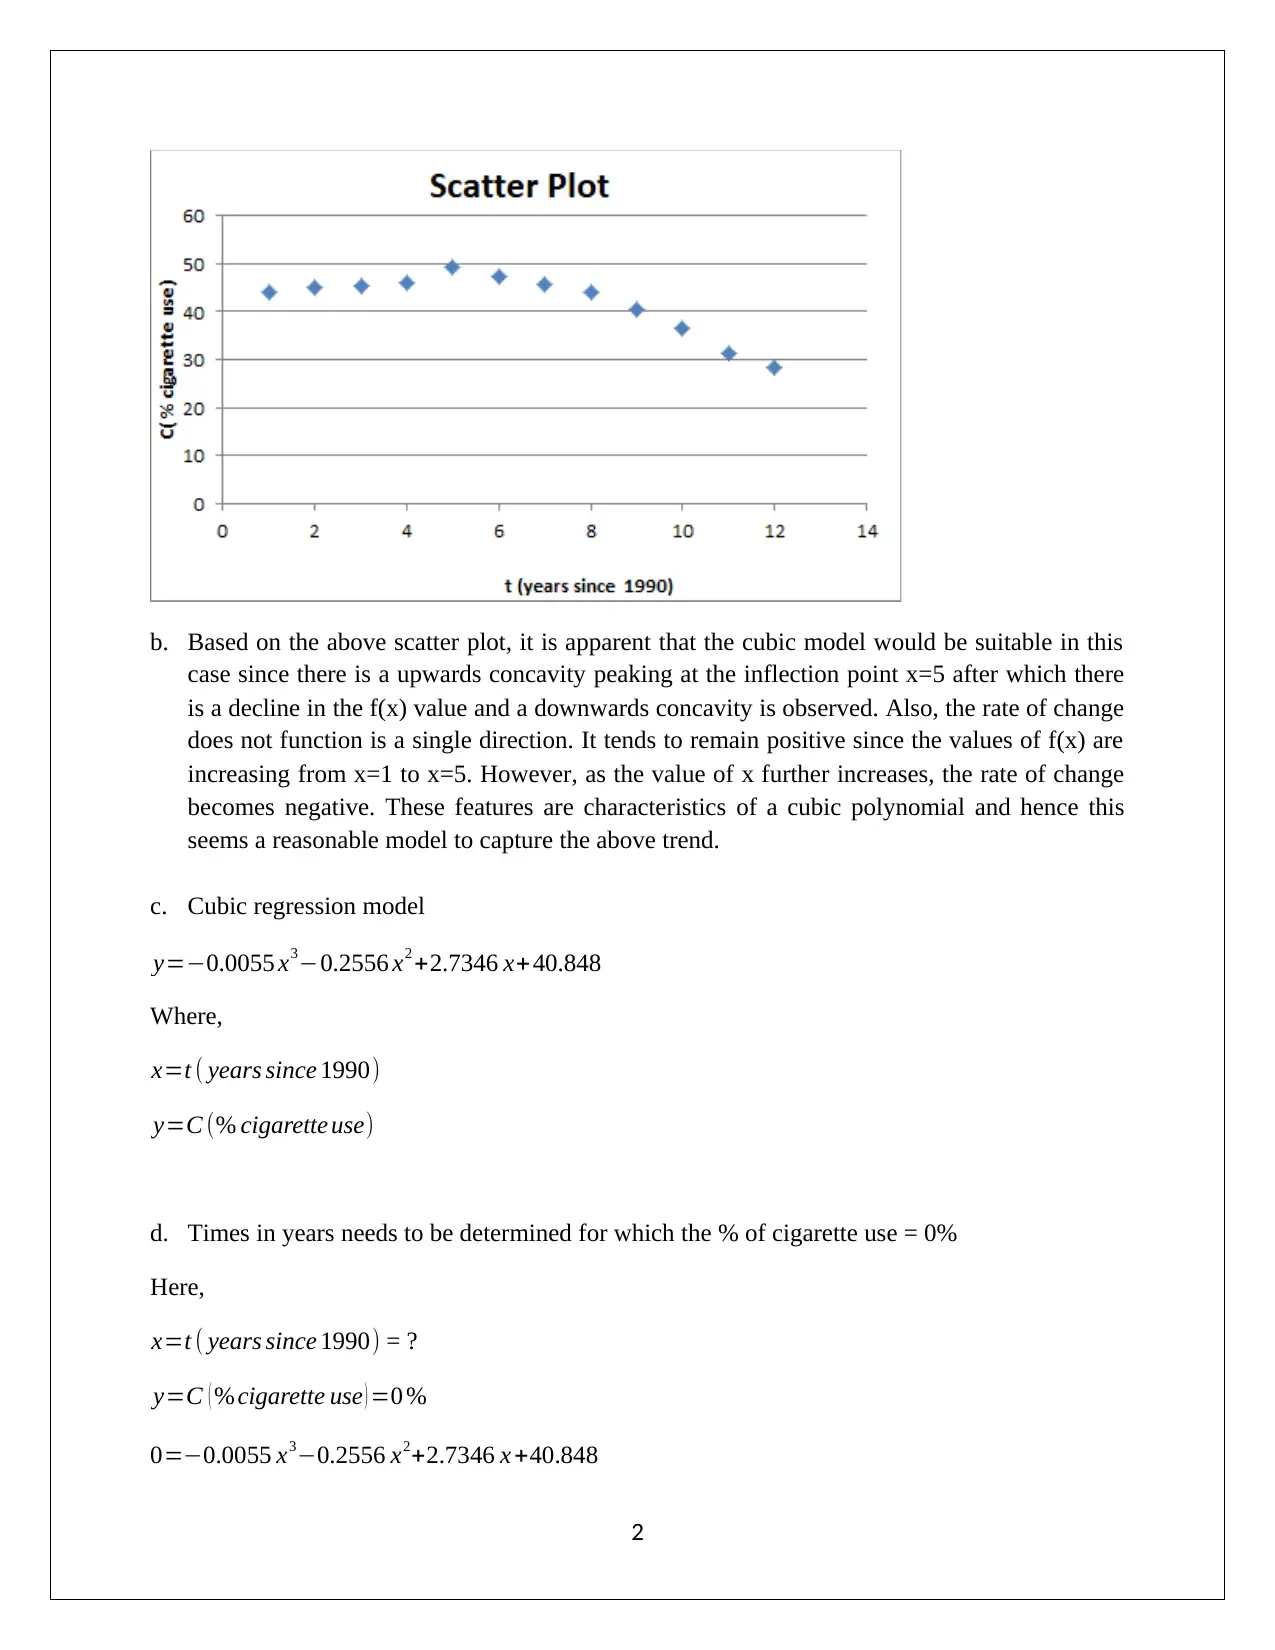
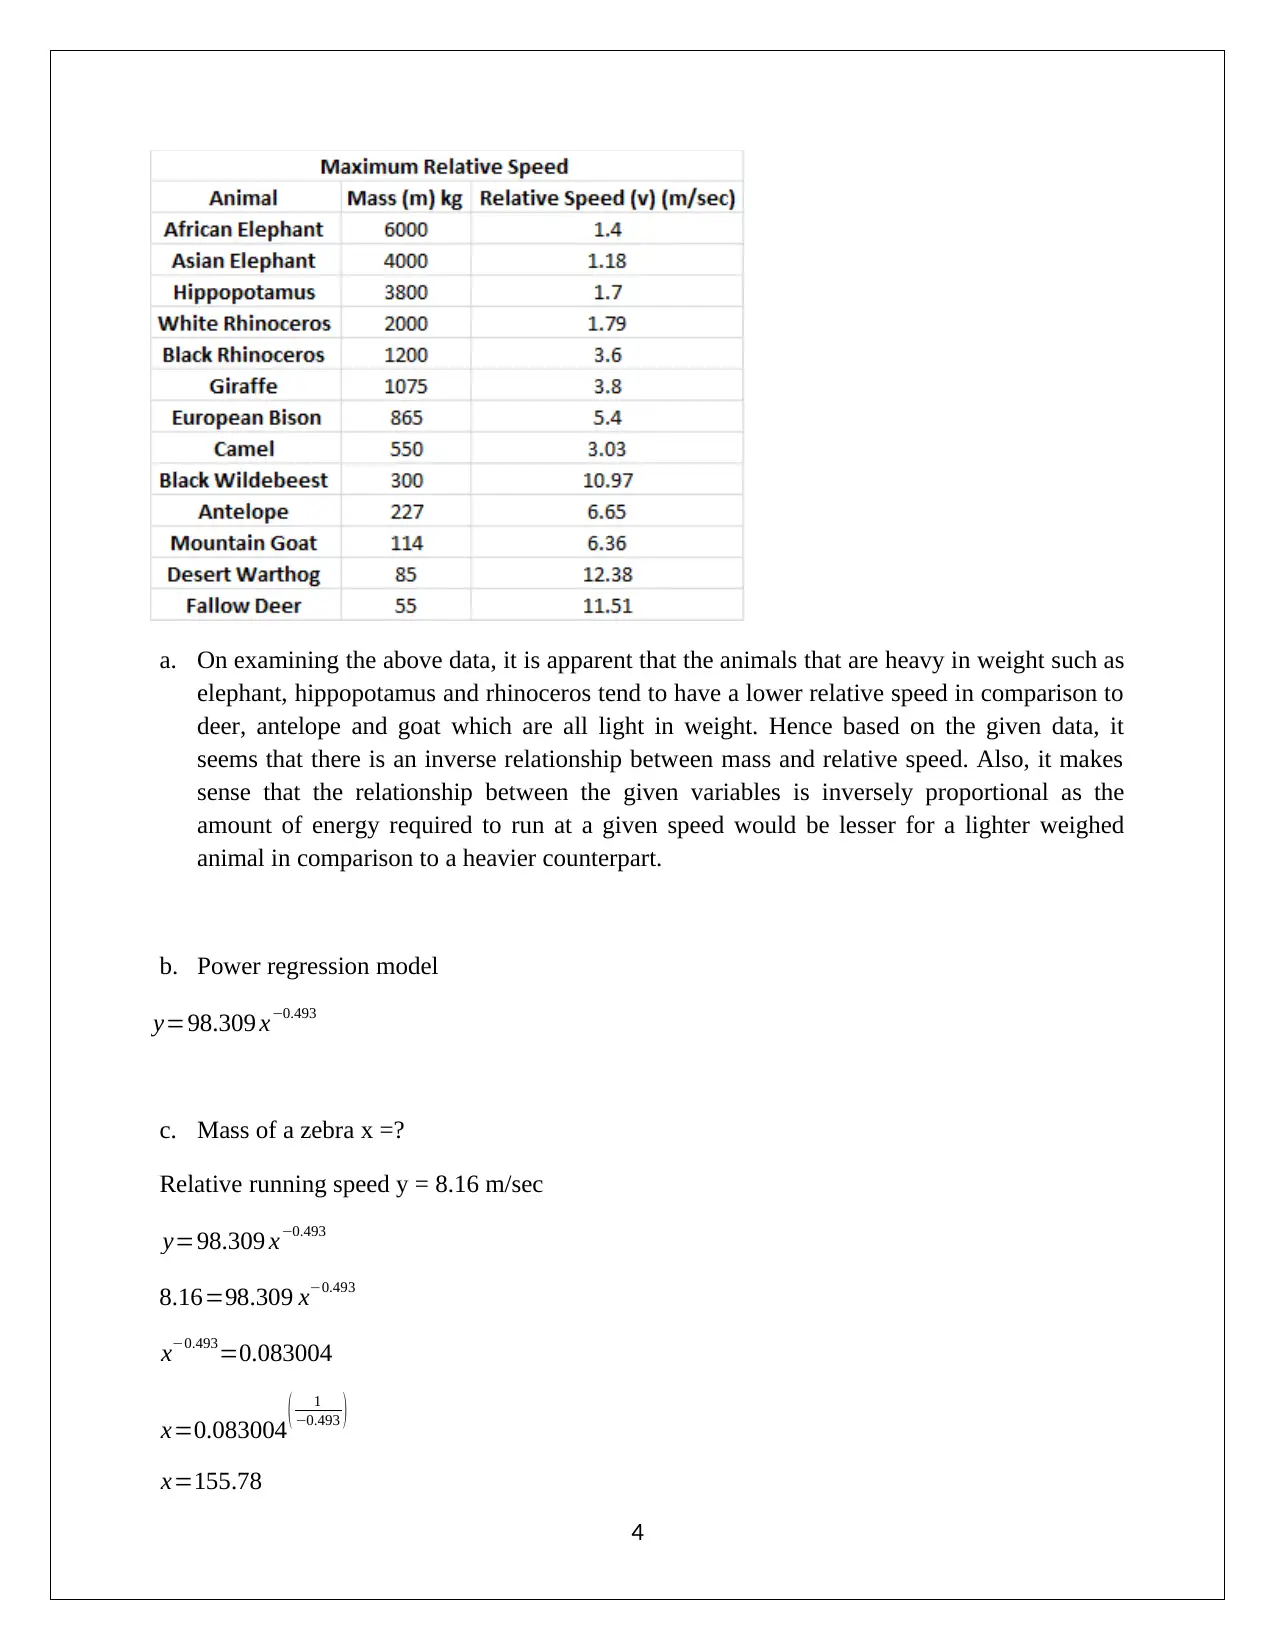
This assignment solution covers various aspects of mathematical functions and modeling, including the identification of linear, cubic, and quadratic functions based on their rates of change. It includes the application of cubic regression models to analyze trends, such as cigarette use, and determines extreme values. The solution also explores power regression models to understand the relationship between animal mass and relative speed, along with calculations for specific scenarios like zebra mass. Furthermore, it addresses the concepts of vertical and horizontal asymptotes and provides a detailed analysis of drug concentration in the bloodstream, including maximum concentration, time to reach maximum concentration, and asymptote equations. Desklib offers a wide array of solved assignments and past papers for students seeking academic assistance.
1 out of 7
Related Documents


Your All-in-One AI-Powered Toolkit for Academic Success.
+13062052269
info@desklib.com
Available 24*7 on WhatsApp / Email
![[object Object]](/_next/static/media/star-bottom.7253800d.svg)
Copyright © 2020–2026 A2Z Services. All Rights Reserved. Developed and managed by ZUCOL.