In-depth Financial Report: Fundamental Analysis of Carsales.com
VerifiedAdded on 2023/06/05
|21
|3974
|114
Report
AI Summary
This report presents a fundamental analysis of Carsales.com Limited, focusing on its financial health and stability over the past two years. It uses ratio analysis, share price movement evaluation, and share valuation techniques to assess the company's performance. The analysis reveals that Carsales.com is financially stable, characterized by high profitability and liquidity ratios, as well as relatively low solvency ratios. The company demonstrates efficiency in managing its resources to generate revenue. The report concludes that Carsales.com Limited is fundamentally sound and presents a potentially favorable investment opportunity. Desklib offers a wide range of solved assignments and study resources for students.
Fundamental Analysis of Carsales.com Limited 1
FUNDAMENTAL ANALYSIS OF CARSALES.COM LIMITED
Author
Course
Professor
State
Date
FUNDAMENTAL ANALYSIS OF CARSALES.COM LIMITED
Author
Course
Professor
State
Date
Paraphrase This Document
Need a fresh take? Get an instant paraphrase of this document with our AI Paraphraser
Fundamental Analysis of Carsales.com Limited 2
Executive Summary
The paper presented fundamental analysis of Carsales.com Limited over the past two years.
This was done through ratio analysis, evaluation of share price movement as well as share
valuation. It was found out that Carsales.com was financially stable and healthy. This was
due to its high profitability ratios, relatively high liquidity ratios as well as relatively low
solvency ratios. In addition, the company was found to be efficient enough in managing most
of its resources to generate revenue. On overall, it was found out that Carsales.com Limited
was fundamentally stable and healthy.
.
Fundamental Analysis of Carsales.com Limited 3
Table of Content
s
Executive Summary...................................................................................................................2
Introduction................................................................................................................................4
Description of Carsales.com Limited.........................................................................................4
Evaluation of Carsales.Com Limited Performance Ratios........................................................5
Liquidity Ratios......................................................................................................................5
Current ratio........................................................................................................................5
Quick Ratio.........................................................................................................................6
Long-Term or Solvency Ratios..............................................................................................7
Debt/asset ratio...................................................................................................................7
Debt/equity..........................................................................................................................8
Interest Coverage................................................................................................................9
Efficiency Ratios..................................................................................................................10
Asset turnover...................................................................................................................10
Receivable turnover..........................................................................................................11
Inventory turnover............................................................................................................12
Profitability Ratios................................................................................................................13
Net margin........................................................................................................................13
ROE..................................................................................................................................14
ROA..................................................................................................................................15
Market value ratios...............................................................................................................16
EPS....................................................................................................................................16
Comparison of Carsales.com Limited and All Ordinary Index share price movements.........17
Share Valuation........................................................................................................................18
Conclusion................................................................................................................................19
Recommendation......................................................................................................................19
Reference Lists.........................................................................................................................21
⊘ This is a preview!⊘
Do you want full access?
Subscribe today to unlock all pages.
Trusted by 1+ million students worldwide
Fundamental Analysis of Carsales.com Limited 4
Introduction
Financial analysis comprises of a review of an organization’s financial figures and reports to
reach into a comprehensive decision regarding the financial stands and stability of the
organization. This means that financial analysis is a crucial aspect when evaluating an
organization financial standing. The report would present background of Carsales.com
followed by ratio analysis of the company. It then presents a graphical comparison of
Carsales.com and All Ordinary Index. Finally, the paper presents computation of the intrinsic
value of Carsales.com to determine whether its stock are over or undervalued. It concludes
with recommendations on whether the company is a better investment opportunity for
potential investors.
Description of Carsales.com Limited
Carsales.com is usually the online marine, motorcycle and automotive classified business. In
other words, it is an online marine, motorcycle and automotive classified business operating
in Australia. It is a company operating in the information technology industry listed in ASX
index (Intelligent Investor 2018). Its carsales network is the online destination for selling and
buying trucks, caravans, cars, machinery equipment and motorcycles. The company main
segments comprises of Data and Research Services, Online Advertising Services Finance and
International Related Services (Reuters.com 2018). Its Online Advertising Services division
comprises online advertising offerings like display and classified advertising services
(Bloomberg.com 2018). These allow customers and dealers to advertise non-automotive and
automotive services and goods for sale across its network. It Data and Research division
offers a wide range of products including analysis, reporting and research, software,
photography services, website development as well as hosting, as well as valuation services.
International division comprises of its operations in foreign nations (Reuters.com 2018). On
the other hand, Finance and Related Services division comprises of operations of the
Paraphrase This Document
Need a fresh take? Get an instant paraphrase of this document with our AI Paraphraser
Fundamental Analysis of Carsales.com Limited 5
company’s subsidiary, that is, Stratton Finance Ltd that offers vehicle procurement, vehicle
finance arrangements as well as other related services.
Evaluation of Carsales.Com Limited Performance Ratios
Ratios are usually good parameters which organizations’ management require evaluating
along with the potential and existing investors who could understand financial health of the
firm overall and situations under different levels. According to Ježovita (2015) ratio analysis
is crucial in tracking and showcasing the financial patterns and trend of a particular firm.
Basically, ratios are useful in measuring or examining present financial performance of an
organization compared to previous year. They could also be used in identifying some of the
issues that required being fixed. It could even direct the attention of the analyst to the
probable issues which could be evaded (Faruk & Habib 2010). Financial ratios analysis
would assists Carsales.com shareholders better understand overall health of the firm and its
situation in numerous financial performance levels. Ratios are also useful in determining the
firm’s financial standing and stability. Five main categories of financial ratios exists these
include the short-term leverage, profitability, long-term leverage or the solvency ratio, market
value as well as efficiency ratios.
Liquidity Ratios
These forms of the ratios assist an organization in focusing on its capacity in settling its short-
term financial obligations. They mostly focus on current assets and liabilities of an
organization as showcased on the company balance sheet (Faruk & Habib 2010). In other
words, the ratios measures capacity of an organization in converting its assets into liquid cash
or in obtaining cash in order to meet most of its short-term commitments. The most common
liquidity ratios include the current and quick ratios which are applicable in this case.
Current ratio
Fundamental Analysis of Carsales.com Limited 6
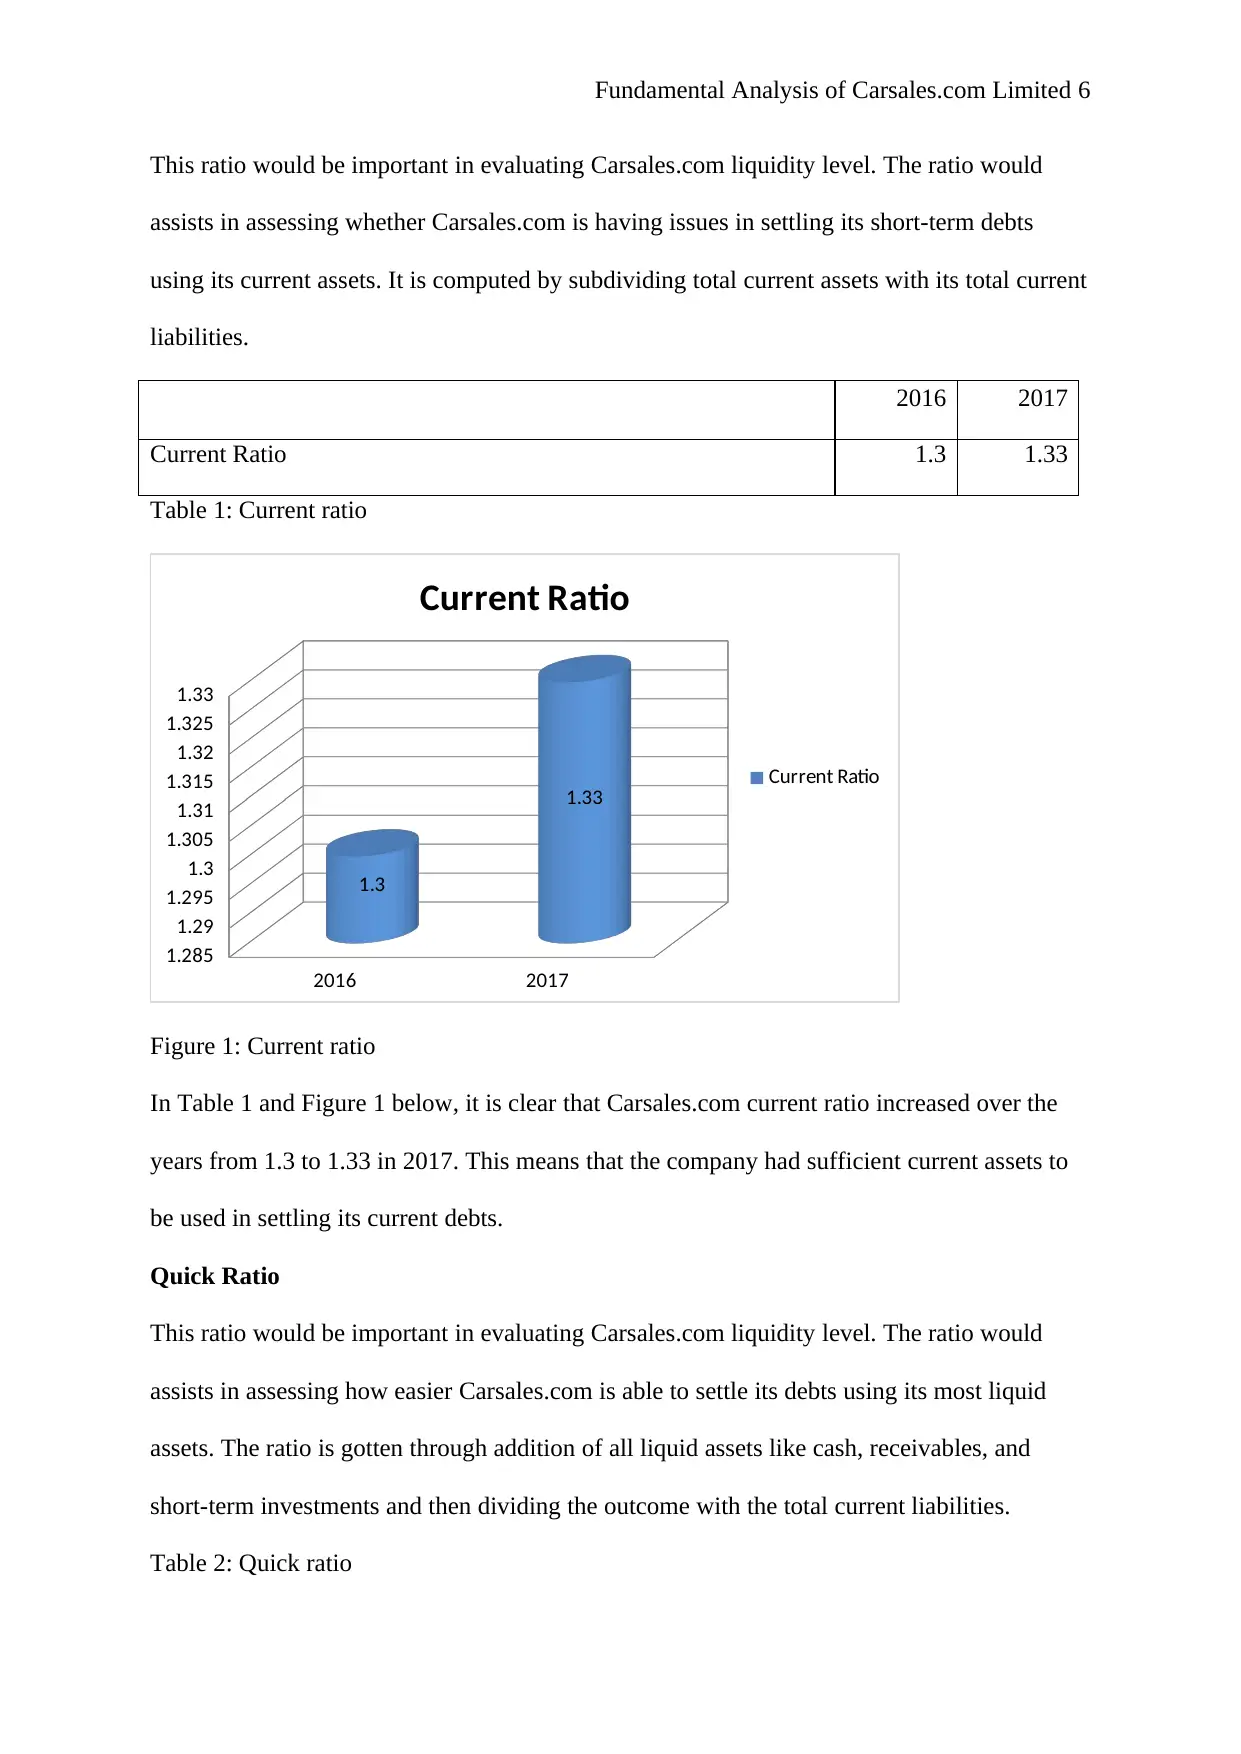
This ratio would be important in evaluating Carsales.com liquidity level. The ratio would
assists in assessing whether Carsales.com is having issues in settling its short-term debts
using its current assets. It is computed by subdividing total current assets with its total current
liabilities.
2016 2017
Current Ratio 1.3 1.33
Table 1: Current ratio
2016 2017
1.285
1.29
1.295
1.3
1.305
1.31
1.315
1.32
1.325
1.33
1.3
1.33
Current Ratio
Current Ratio
Figure 1: Current ratio
In Table 1 and Figure 1 below, it is clear that Carsales.com current ratio increased over the
years from 1.3 to 1.33 in 2017. This means that the company had sufficient current assets to
be used in settling its current debts.
Quick Ratio
This ratio would be important in evaluating Carsales.com liquidity level. The ratio would
assists in assessing how easier Carsales.com is able to settle its debts using its most liquid
assets. The ratio is gotten through addition of all liquid assets like cash, receivables, and
short-term investments and then dividing the outcome with the total current liabilities.
Table 2: Quick ratio
This ratio would be important in evaluating Carsales.com liquidity level. The ratio would
assists in assessing whether Carsales.com is having issues in settling its short-term debts
using its current assets. It is computed by subdividing total current assets with its total current
liabilities.
2016 2017
Current Ratio 1.3 1.33
Table 1: Current ratio
2016 2017
1.285
1.29
1.295
1.3
1.305
1.31
1.315
1.32
1.325
1.33
1.3
1.33
Current Ratio
Current Ratio
Figure 1: Current ratio
In Table 1 and Figure 1 below, it is clear that Carsales.com current ratio increased over the
years from 1.3 to 1.33 in 2017. This means that the company had sufficient current assets to
be used in settling its current debts.
Quick Ratio
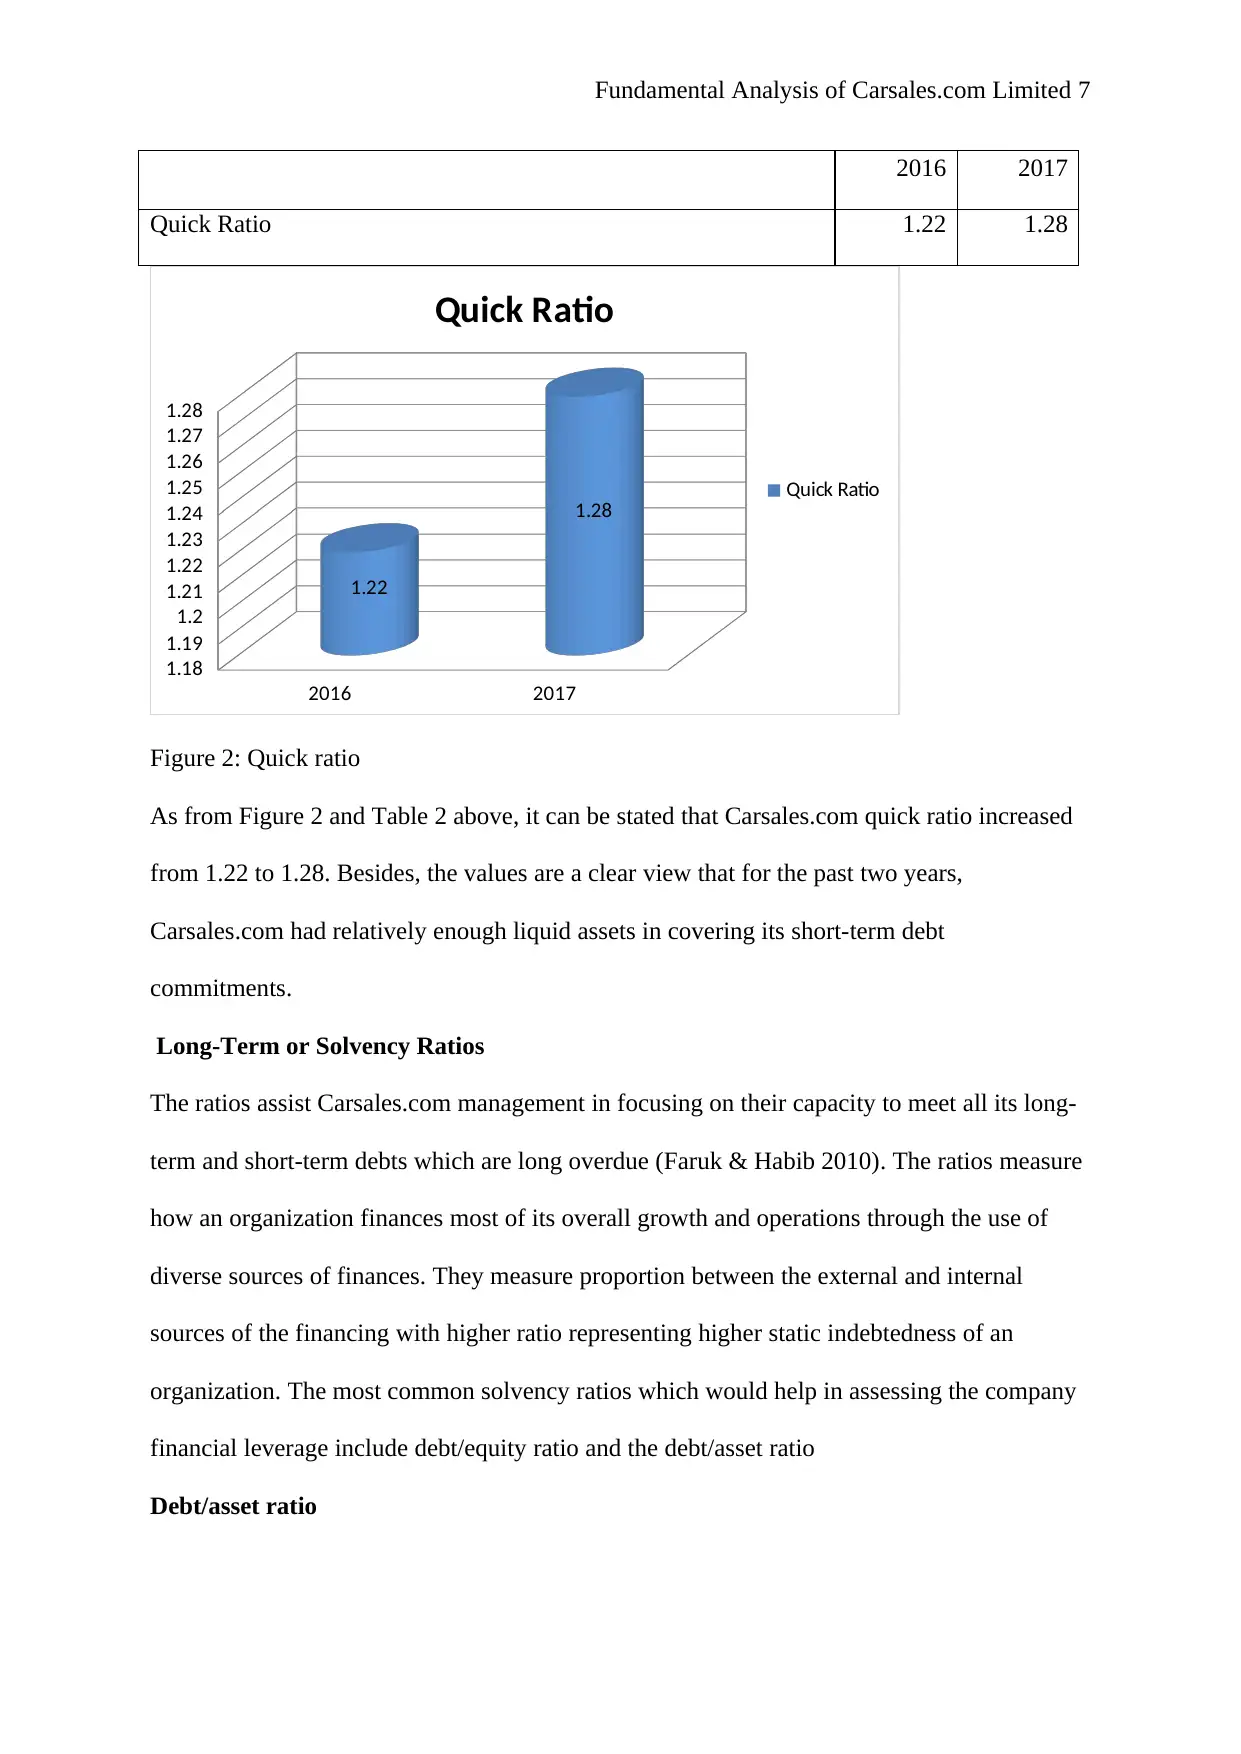
This ratio would be important in evaluating Carsales.com liquidity level. The ratio would
assists in assessing how easier Carsales.com is able to settle its debts using its most liquid
assets. The ratio is gotten through addition of all liquid assets like cash, receivables, and
short-term investments and then dividing the outcome with the total current liabilities.
Table 2: Quick ratio
⊘ This is a preview!⊘
Do you want full access?
Subscribe today to unlock all pages.
Trusted by 1+ million students worldwide
Fundamental Analysis of Carsales.com Limited 7
2016 2017
Quick Ratio 1.22 1.28
2016 2017
1.18
1.19
1.2
1.21
1.22
1.23
1.24
1.25
1.26
1.27
1.28
1.22
1.28
Quick Ratio
Quick Ratio
Figure 2: Quick ratio
As from Figure 2 and Table 2 above, it can be stated that Carsales.com quick ratio increased
from 1.22 to 1.28. Besides, the values are a clear view that for the past two years,
Carsales.com had relatively enough liquid assets in covering its short-term debt
commitments.
Long-Term or Solvency Ratios
The ratios assist Carsales.com management in focusing on their capacity to meet all its long-
term and short-term debts which are long overdue (Faruk & Habib 2010). The ratios measure
how an organization finances most of its overall growth and operations through the use of
diverse sources of finances. They measure proportion between the external and internal
sources of the financing with higher ratio representing higher static indebtedness of an
organization. The most common solvency ratios which would help in assessing the company
financial leverage include debt/equity ratio and the debt/asset ratio
Debt/asset ratio
2016 2017
Quick Ratio 1.22 1.28
2016 2017
1.18
1.19
1.2
1.21
1.22
1.23
1.24
1.25
1.26
1.27
1.28
1.22
1.28
Quick Ratio
Quick Ratio
Figure 2: Quick ratio
As from Figure 2 and Table 2 above, it can be stated that Carsales.com quick ratio increased
from 1.22 to 1.28. Besides, the values are a clear view that for the past two years,
Carsales.com had relatively enough liquid assets in covering its short-term debt
commitments.
Long-Term or Solvency Ratios
The ratios assist Carsales.com management in focusing on their capacity to meet all its long-
term and short-term debts which are long overdue (Faruk & Habib 2010). The ratios measure
how an organization finances most of its overall growth and operations through the use of
diverse sources of finances. They measure proportion between the external and internal
sources of the financing with higher ratio representing higher static indebtedness of an
organization. The most common solvency ratios which would help in assessing the company
financial leverage include debt/equity ratio and the debt/asset ratio
Debt/asset ratio
Paraphrase This Document
Need a fresh take? Get an instant paraphrase of this document with our AI Paraphraser
Fundamental Analysis of Carsales.com Limited 8
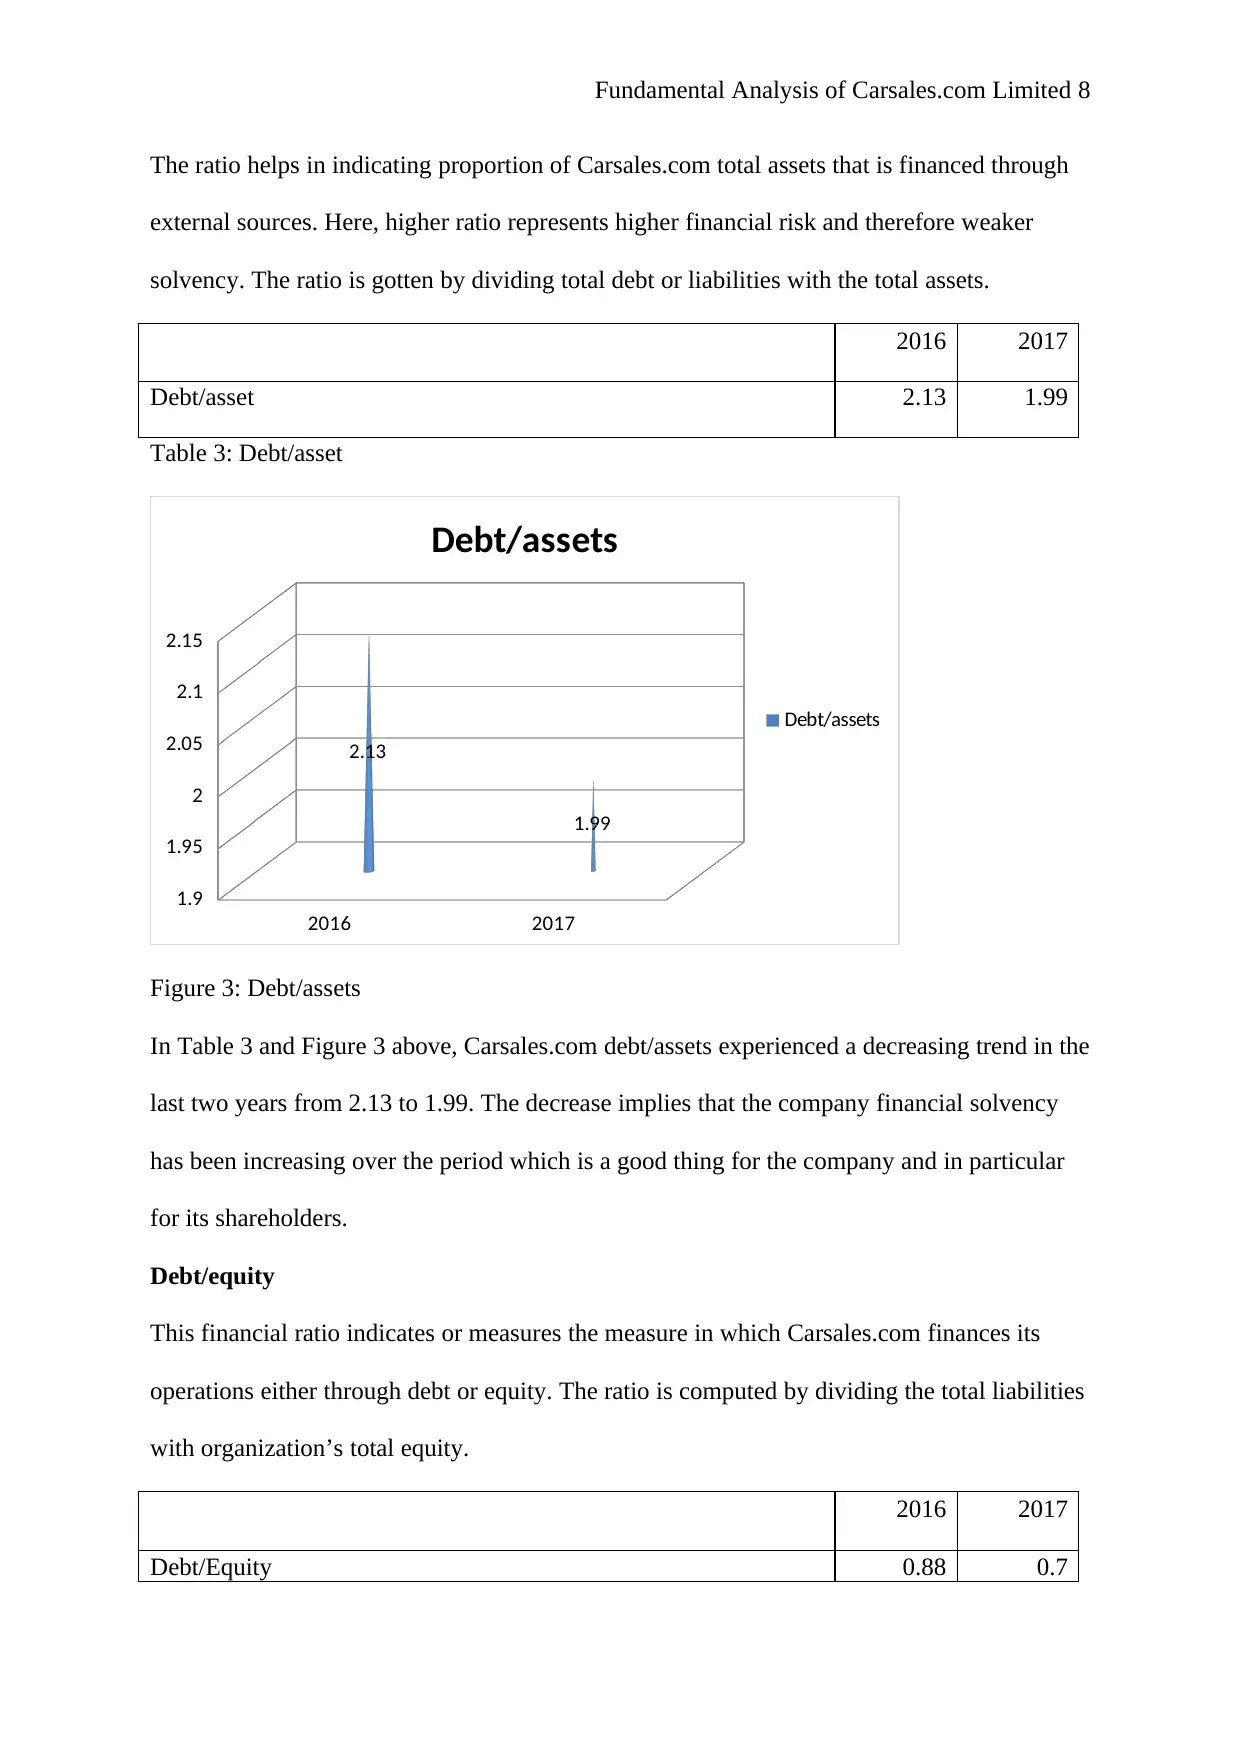
The ratio helps in indicating proportion of Carsales.com total assets that is financed through
external sources. Here, higher ratio represents higher financial risk and therefore weaker
solvency. The ratio is gotten by dividing total debt or liabilities with the total assets.
2016 2017
Debt/asset 2.13 1.99
Table 3: Debt/asset
2016 2017
1.9
1.95
2
2.05
2.1
2.15
2.13
1.99
Debt/assets
Debt/assets
Figure 3: Debt/assets
In Table 3 and Figure 3 above, Carsales.com debt/assets experienced a decreasing trend in the
last two years from 2.13 to 1.99. The decrease implies that the company financial solvency
has been increasing over the period which is a good thing for the company and in particular
for its shareholders.
Debt/equity
This financial ratio indicates or measures the measure in which Carsales.com finances its
operations either through debt or equity. The ratio is computed by dividing the total liabilities
with organization’s total equity.
2016 2017
Debt/Equity 0.88 0.7
Fundamental Analysis of Carsales.com Limited 9
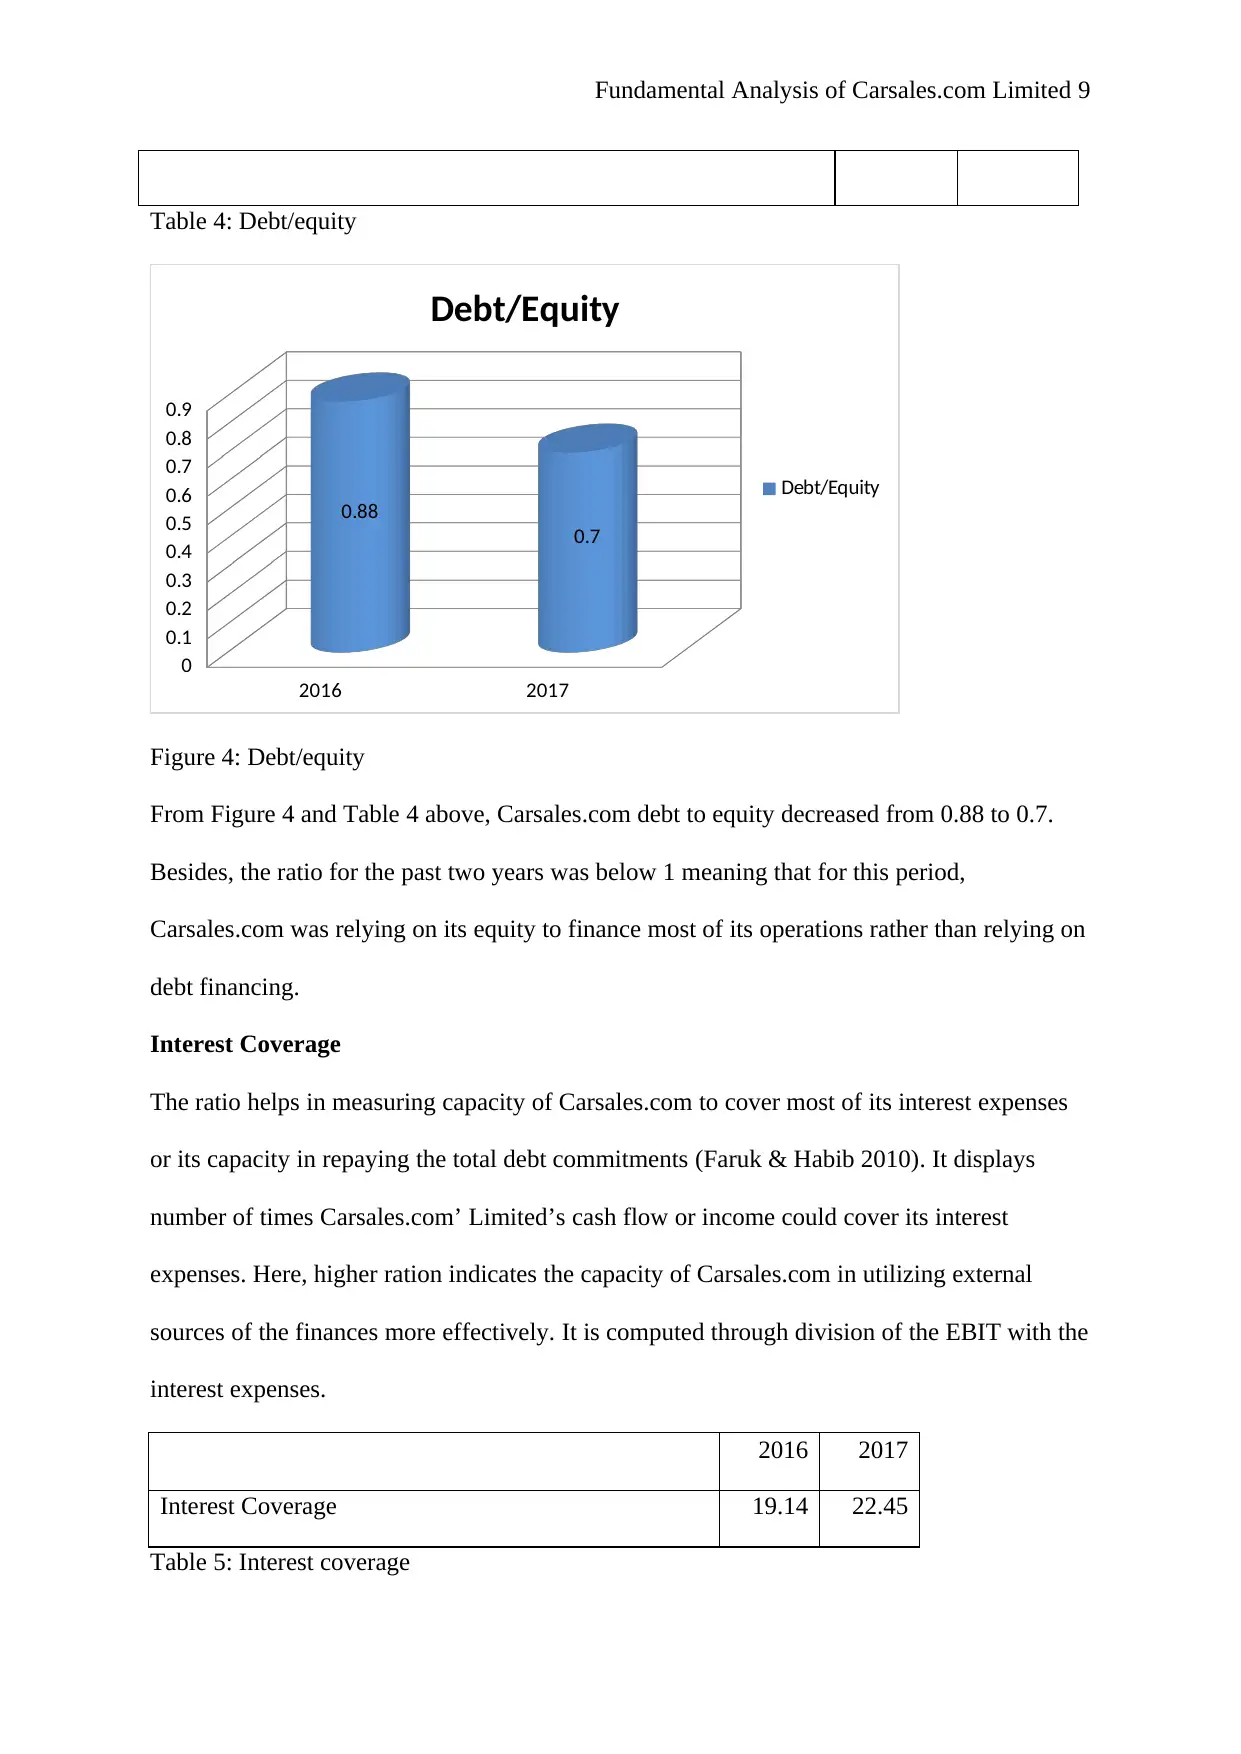
Table 4: Debt/equity
2016 2017
0
0.1
0.2
0.3
0.4
0.5
0.6
0.7
0.8
0.9
0.88
0.7
Debt/Equity
Debt/Equity
Figure 4: Debt/equity
From Figure 4 and Table 4 above, Carsales.com debt to equity decreased from 0.88 to 0.7.
Besides, the ratio for the past two years was below 1 meaning that for this period,
Carsales.com was relying on its equity to finance most of its operations rather than relying on
debt financing.
Interest Coverage
The ratio helps in measuring capacity of Carsales.com to cover most of its interest expenses
or its capacity in repaying the total debt commitments (Faruk & Habib 2010). It displays
number of times Carsales.com’ Limited’s cash flow or income could cover its interest
expenses. Here, higher ration indicates the capacity of Carsales.com in utilizing external
sources of the finances more effectively. It is computed through division of the EBIT with the
interest expenses.
2016 2017
Interest Coverage 19.14 22.45
Table 5: Interest coverage
⊘ This is a preview!⊘
Do you want full access?
Subscribe today to unlock all pages.
Trusted by 1+ million students worldwide
Fundamental Analysis of Carsales.com Limited 10
2016 2017
17
18
19
20
21
22
23
19.14
22.45
Interest Coverage
Interest Coverage
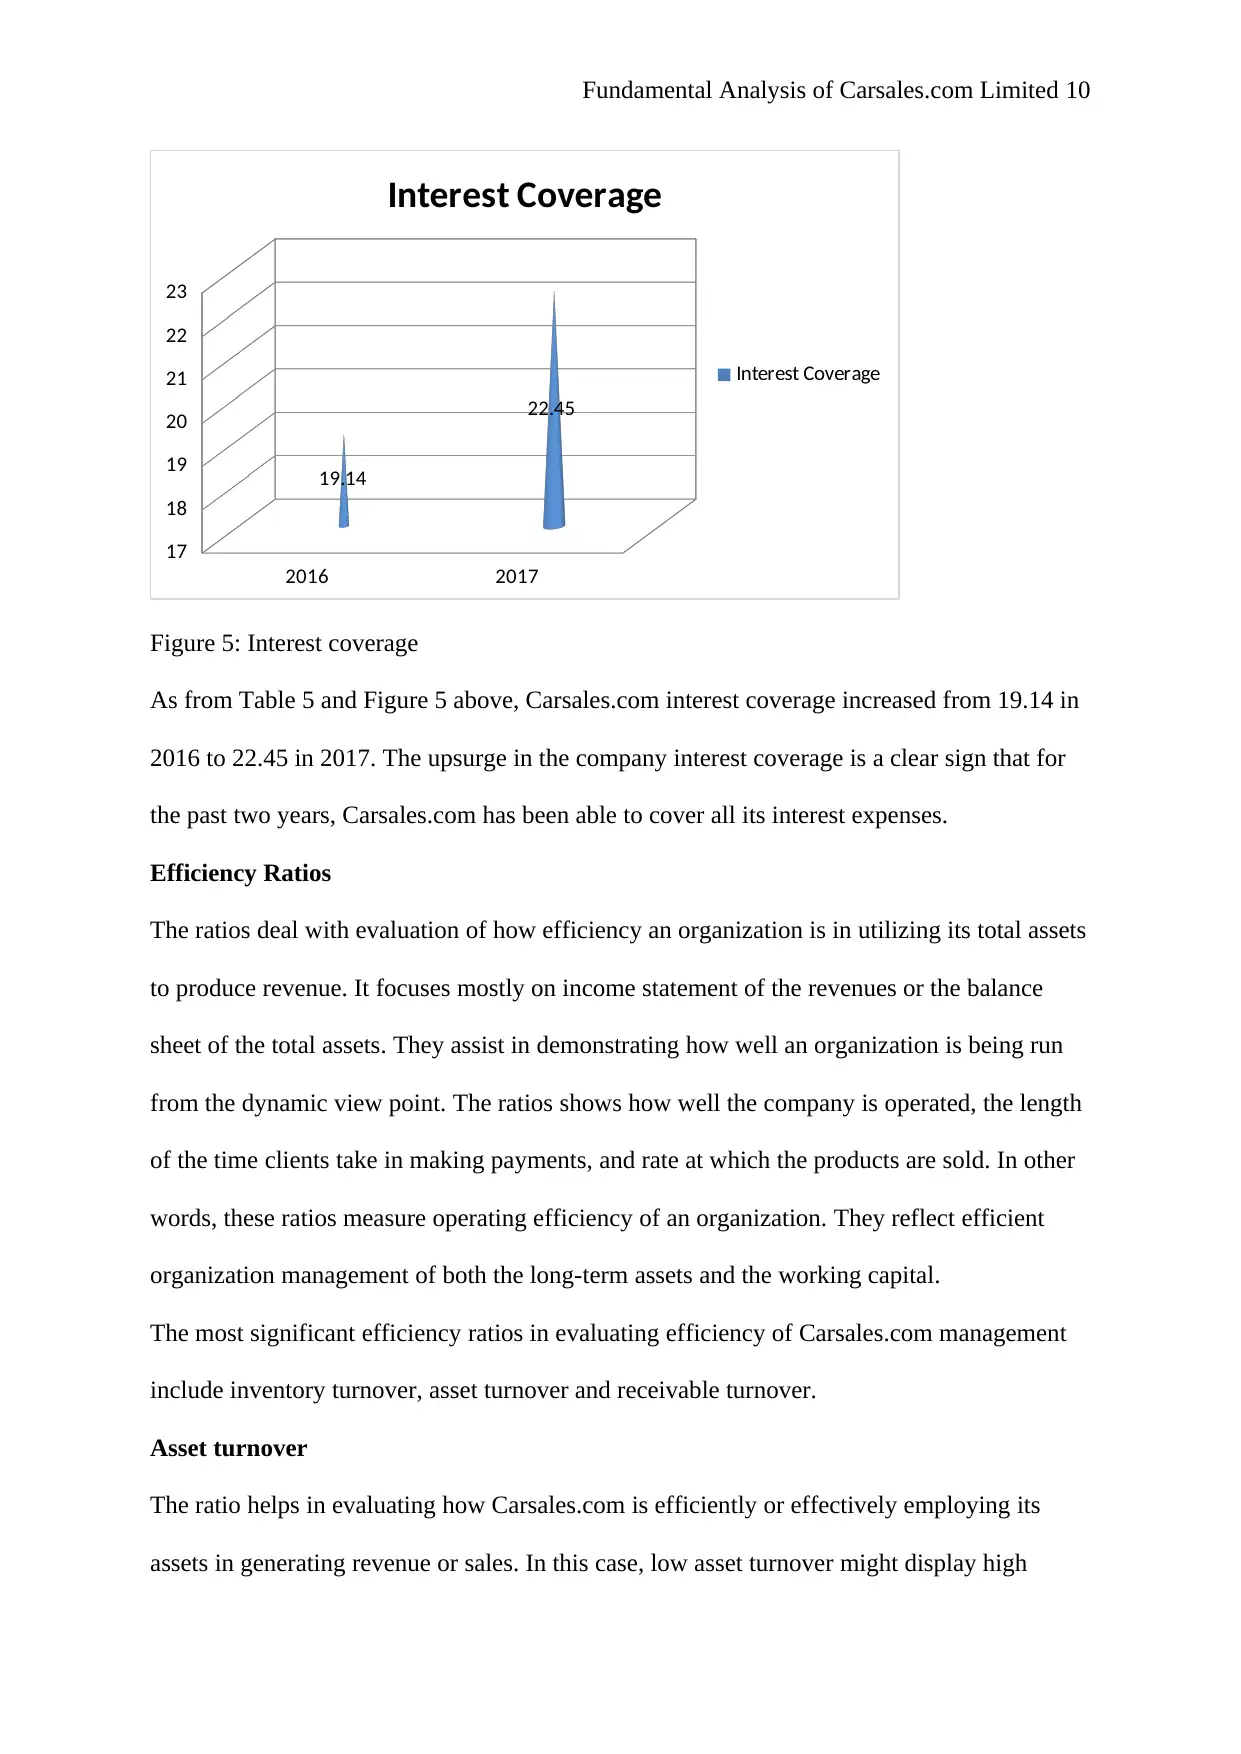
Figure 5: Interest coverage
As from Table 5 and Figure 5 above, Carsales.com interest coverage increased from 19.14 in
2016 to 22.45 in 2017. The upsurge in the company interest coverage is a clear sign that for
the past two years, Carsales.com has been able to cover all its interest expenses.
Efficiency Ratios
The ratios deal with evaluation of how efficiency an organization is in utilizing its total assets
to produce revenue. It focuses mostly on income statement of the revenues or the balance
sheet of the total assets. They assist in demonstrating how well an organization is being run
from the dynamic view point. The ratios shows how well the company is operated, the length
of the time clients take in making payments, and rate at which the products are sold. In other
words, these ratios measure operating efficiency of an organization. They reflect efficient
organization management of both the long-term assets and the working capital.
The most significant efficiency ratios in evaluating efficiency of Carsales.com management
include inventory turnover, asset turnover and receivable turnover.
Asset turnover
The ratio helps in evaluating how Carsales.com is efficiently or effectively employing its
assets in generating revenue or sales. In this case, low asset turnover might display high
2016 2017
17
18
19
20
21
22
23
19.14
22.45
Interest Coverage
Interest Coverage
Figure 5: Interest coverage
As from Table 5 and Figure 5 above, Carsales.com interest coverage increased from 19.14 in
2016 to 22.45 in 2017. The upsurge in the company interest coverage is a clear sign that for
the past two years, Carsales.com has been able to cover all its interest expenses.
Efficiency Ratios
The ratios deal with evaluation of how efficiency an organization is in utilizing its total assets
to produce revenue. It focuses mostly on income statement of the revenues or the balance
sheet of the total assets. They assist in demonstrating how well an organization is being run
from the dynamic view point. The ratios shows how well the company is operated, the length
of the time clients take in making payments, and rate at which the products are sold. In other
words, these ratios measure operating efficiency of an organization. They reflect efficient
organization management of both the long-term assets and the working capital.
The most significant efficiency ratios in evaluating efficiency of Carsales.com management
include inventory turnover, asset turnover and receivable turnover.
Asset turnover
The ratio helps in evaluating how Carsales.com is efficiently or effectively employing its
assets in generating revenue or sales. In this case, low asset turnover might display high
Paraphrase This Document
Need a fresh take? Get an instant paraphrase of this document with our AI Paraphraser
Fundamental Analysis of Carsales.com Limited 11
investment in the total assets compared to amount of revenue generated and vice versus. It is
gotten by dividing total revenue with its average total assets.
2016 2017
Asset Turnover 0.66 0.69
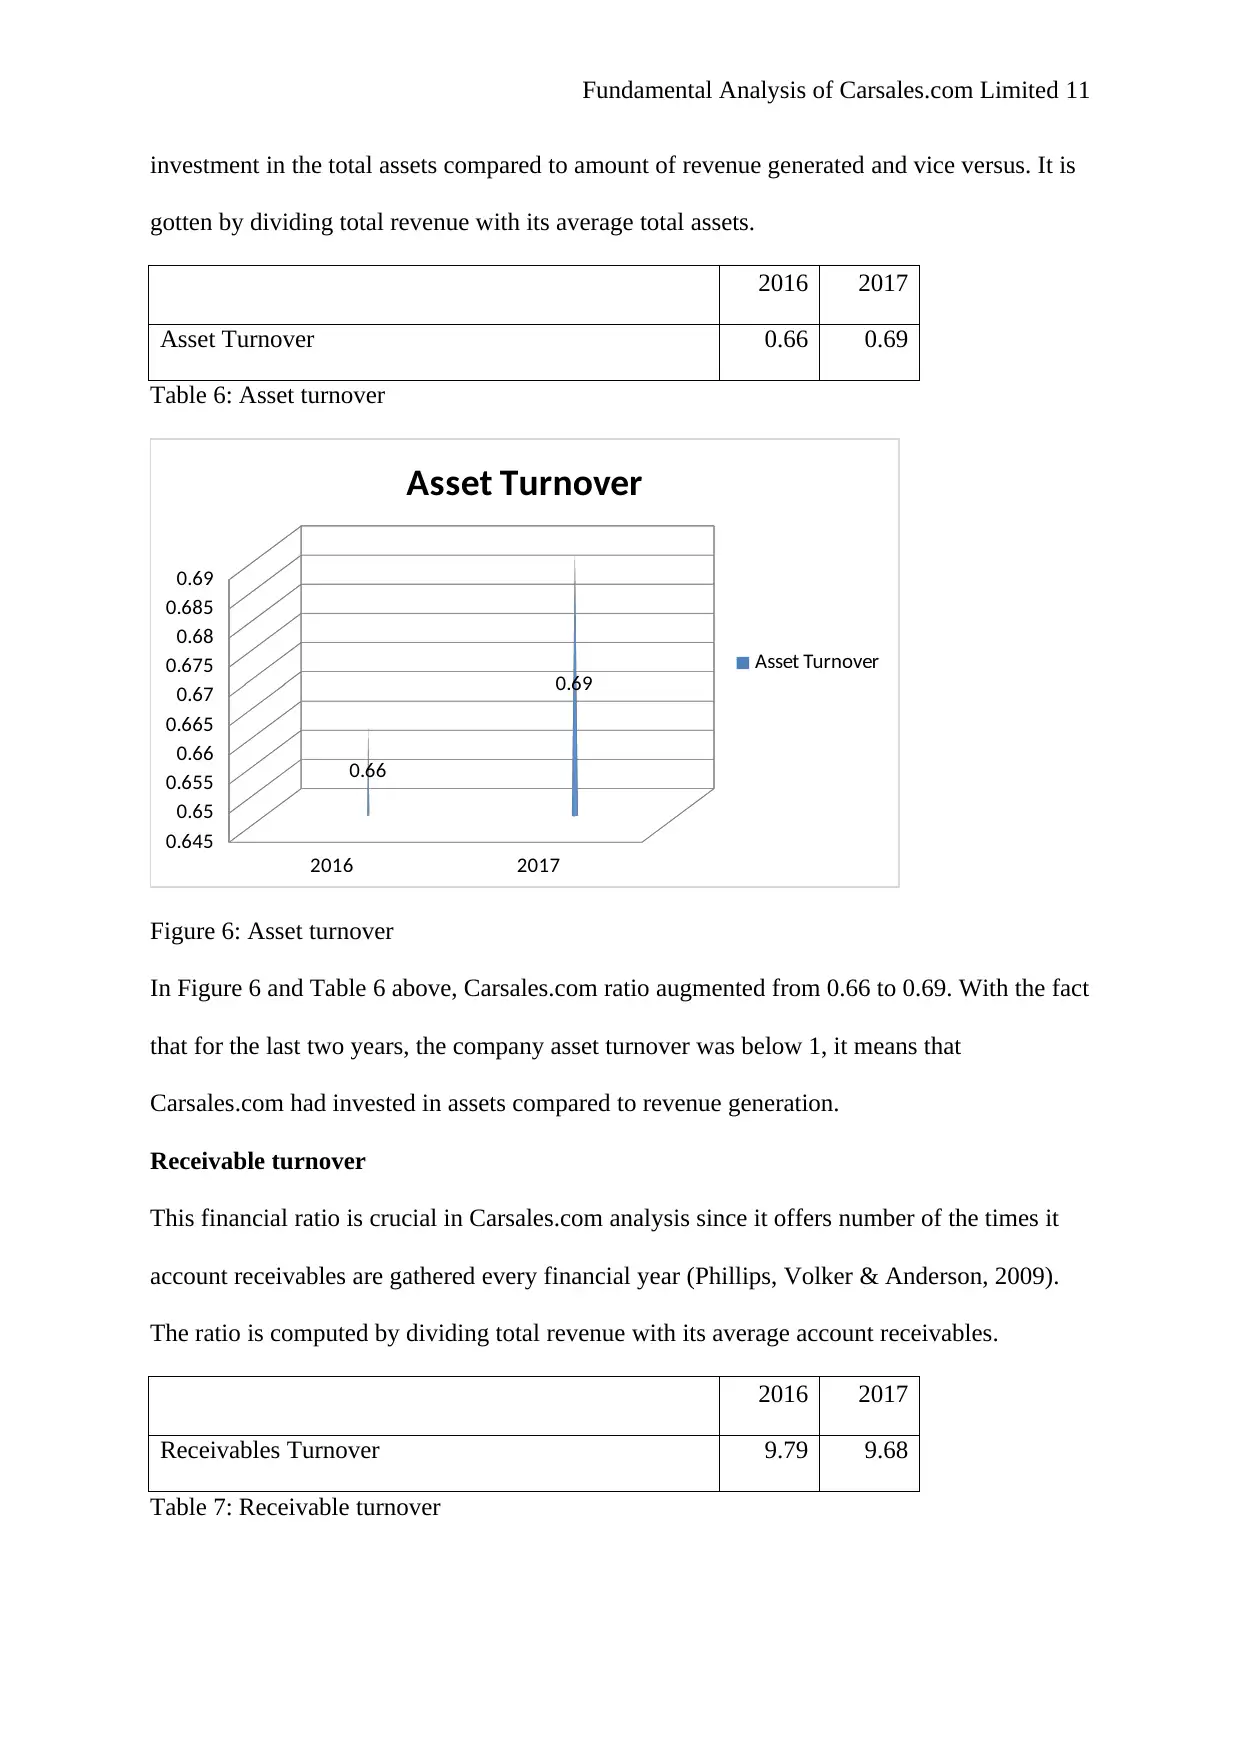
Table 6: Asset turnover
2016 2017
0.645
0.65
0.655
0.66
0.665
0.67
0.675
0.68
0.685
0.69
0.66
0.69
Asset Turnover
Asset Turnover
Figure 6: Asset turnover
In Figure 6 and Table 6 above, Carsales.com ratio augmented from 0.66 to 0.69. With the fact
that for the last two years, the company asset turnover was below 1, it means that
Carsales.com had invested in assets compared to revenue generation.
Receivable turnover
This financial ratio is crucial in Carsales.com analysis since it offers number of the times it
account receivables are gathered every financial year (Phillips, Volker & Anderson, 2009).
The ratio is computed by dividing total revenue with its average account receivables.
2016 2017
Receivables Turnover 9.79 9.68
Table 7: Receivable turnover
investment in the total assets compared to amount of revenue generated and vice versus. It is
gotten by dividing total revenue with its average total assets.
2016 2017
Asset Turnover 0.66 0.69
Table 6: Asset turnover
2016 2017
0.645
0.65
0.655
0.66
0.665
0.67
0.675
0.68
0.685
0.69
0.66
0.69
Asset Turnover
Asset Turnover
Figure 6: Asset turnover
In Figure 6 and Table 6 above, Carsales.com ratio augmented from 0.66 to 0.69. With the fact
that for the last two years, the company asset turnover was below 1, it means that
Carsales.com had invested in assets compared to revenue generation.
Receivable turnover
This financial ratio is crucial in Carsales.com analysis since it offers number of the times it
account receivables are gathered every financial year (Phillips, Volker & Anderson, 2009).
The ratio is computed by dividing total revenue with its average account receivables.
2016 2017
Receivables Turnover 9.79 9.68
Table 7: Receivable turnover
Fundamental Analysis of Carsales.com Limited 12
2016 2017
9.62
9.64
9.66
9.68
9.7
9.72
9.74
9.76
9.78
9.8
9.79
9.68
Receivables Turnover
Receivables Turnover
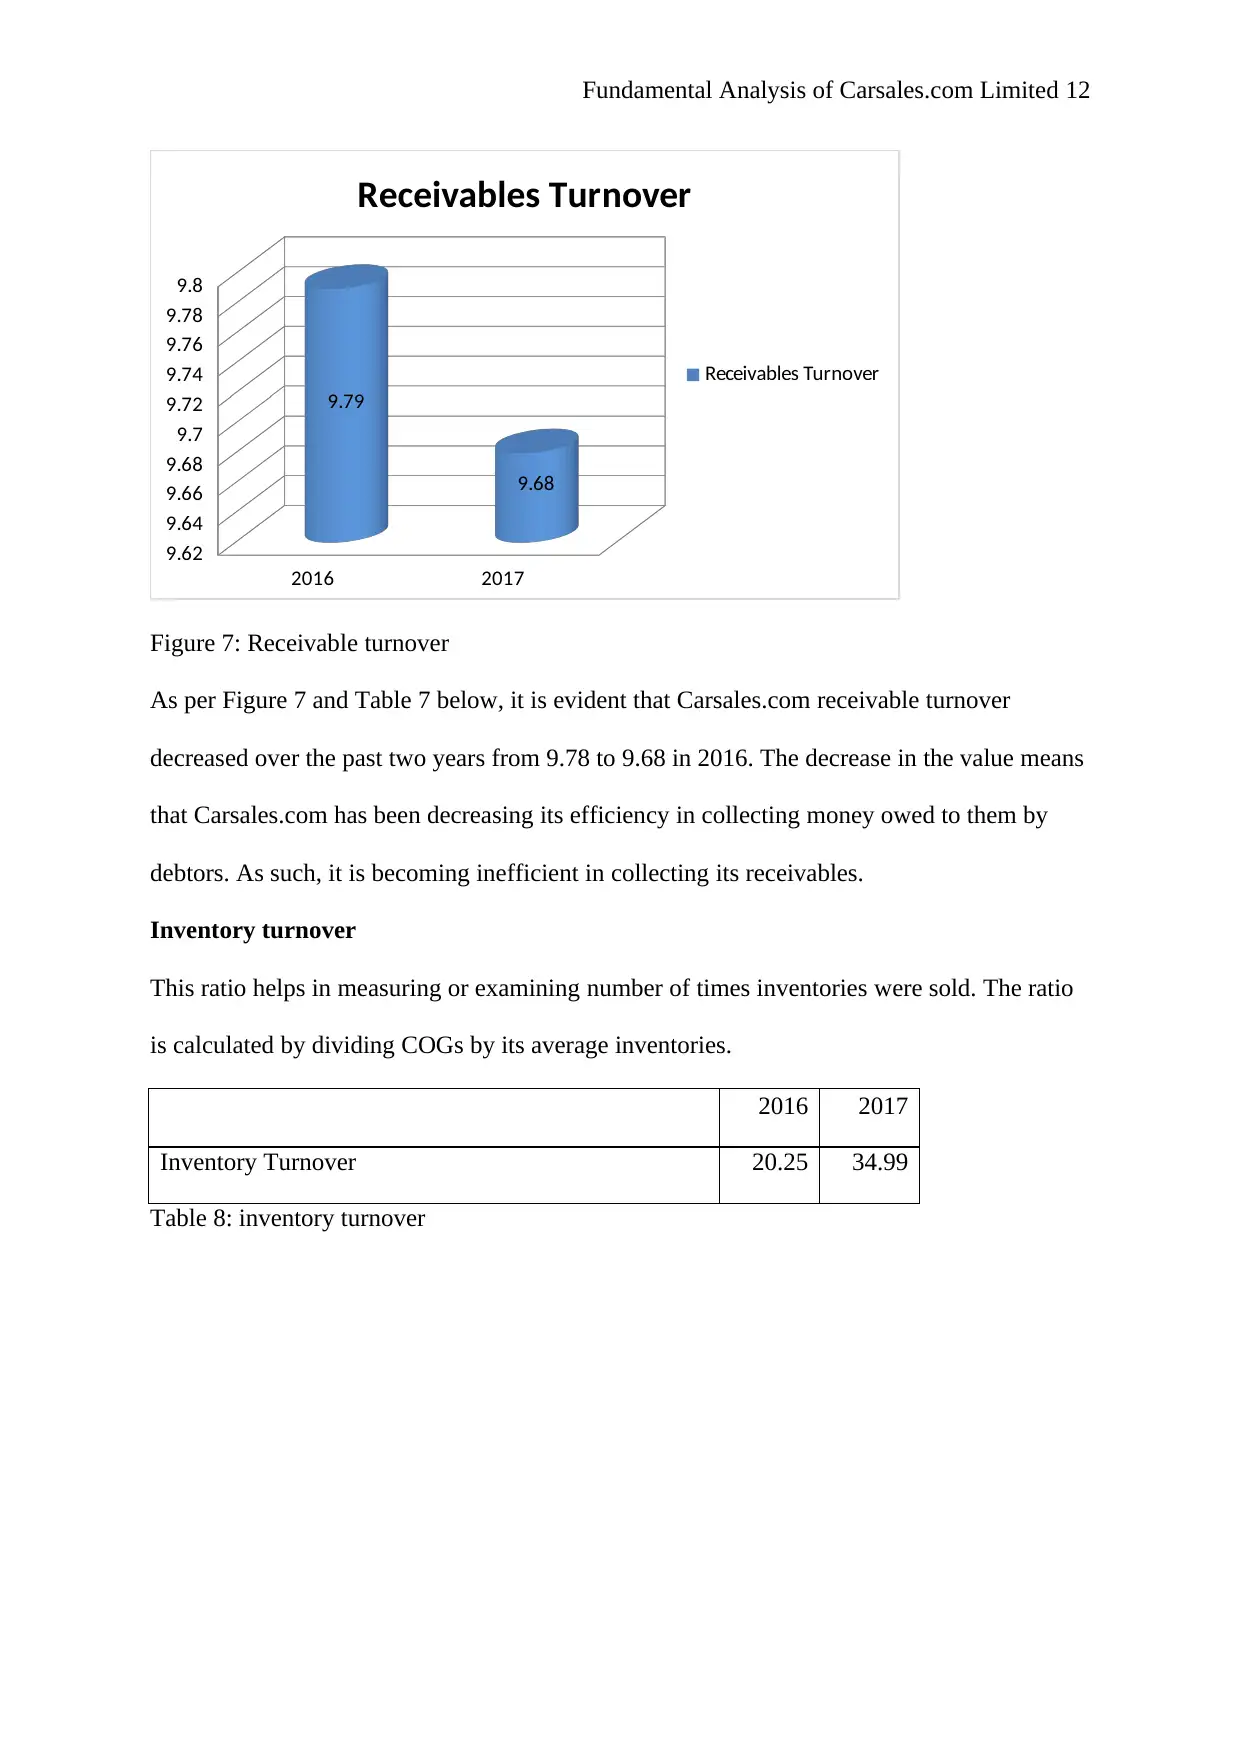
Figure 7: Receivable turnover
As per Figure 7 and Table 7 below, it is evident that Carsales.com receivable turnover
decreased over the past two years from 9.78 to 9.68 in 2016. The decrease in the value means
that Carsales.com has been decreasing its efficiency in collecting money owed to them by
debtors. As such, it is becoming inefficient in collecting its receivables.
Inventory turnover
This ratio helps in measuring or examining number of times inventories were sold. The ratio
is calculated by dividing COGs by its average inventories.
2016 2017
Inventory Turnover 20.25 34.99
Table 8: inventory turnover
2016 2017
9.62
9.64
9.66
9.68
9.7
9.72
9.74
9.76
9.78
9.8
9.79
9.68
Receivables Turnover
Receivables Turnover
Figure 7: Receivable turnover
As per Figure 7 and Table 7 below, it is evident that Carsales.com receivable turnover
decreased over the past two years from 9.78 to 9.68 in 2016. The decrease in the value means
that Carsales.com has been decreasing its efficiency in collecting money owed to them by
debtors. As such, it is becoming inefficient in collecting its receivables.
Inventory turnover
This ratio helps in measuring or examining number of times inventories were sold. The ratio
is calculated by dividing COGs by its average inventories.
2016 2017
Inventory Turnover 20.25 34.99
Table 8: inventory turnover
⊘ This is a preview!⊘
Do you want full access?
Subscribe today to unlock all pages.
Trusted by 1+ million students worldwide
1 out of 21
Related Documents


Your All-in-One AI-Powered Toolkit for Academic Success.
+13062052269
info@desklib.com
Available 24*7 on WhatsApp / Email
![[object Object]](/_next/static/media/star-bottom.7253800d.svg)
Unlock your academic potential
Copyright © 2020–2026 A2Z Services. All Rights Reserved. Developed and managed by ZUCOL.