Comprehensive Financial Analysis of ABP Properties and AMP Properties
VerifiedAdded on 2020/04/07
|22
|4490
|149
Project
AI Summary
This project report undertakes a fundamental analysis of ABP Properties Limited and AMP Properties Limited, both operating within the Australian real estate industry. The report begins with an introduction to fundamental analysis, followed by a detailed examination using both top-down and bottom-up approaches. The top-down analysis assesses macroeconomic factors such as interest rates, the value of the Australian dollar, the state of the real estate industry, future projections, inflation rates, fiscal policies, and GDP. The bottom-up analysis focuses on internal aspects like ratio analysis, financial statement analysis, and DuPont analysis for each company. The report compares the financial performance of both companies, drawing conclusions about the real estate industry's current state and the potential for investment. The analysis incorporates financial data, market trends, and economic indicators to provide a comprehensive evaluation of the companies' financial health and investment potential.

Running Head: Financial management principles
1
Project Report: Financial Management Principles
1
Project Report: Financial Management Principles
Paraphrase This Document
Need a fresh take? Get an instant paraphrase of this document with our AI Paraphraser

Financial management principles 2
Executive summary
This report has been prepares to analyze the fundamental analysis of ABP properties
limited and AMP properties limited. Both of these companies are related to real estate
industry. In this report, firstly, introduction has been given which depict about the
fundamental analysis. Further, top down analysis and bottom up analysis have been studied
on the basis of many methods and technique to analyze the performance of real estate
industry and the
Financial management principles 3
Contents
Introduction.......................................................................................................................4
Top down analysis............................................................................................................5
Current interest rate:.....................................................................................................6
Current value of AUD:.................................................................................................6
Real estate industry of Australia...................................................................................6
Future projections.........................................................................................................7
Inflation rate..................................................................................................................8
Fiscal policies...............................................................................................................8
GDP..............................................................................................................................8
Bottom up analysis...........................................................................................................8
Ratio analysis................................................................................................................8
ABP property group..................................................................................................8
AMP limited Australia..............................................................................................8
DU Pont analysis..........................................................................................................8
ABP properties group limited Australia...................................................................8
AMP limited.............................................................................................................8
Financial data analysis..................................................................................................8
ABP limited..............................................................................................................8
AMP limited.............................................................................................................8
Summary and recommendation........................................................................................8
References.........................................................................................................................8
⊘ This is a preview!⊘
Do you want full access?
Subscribe today to unlock all pages.
Trusted by 1+ million students worldwide
Financial management principles 4
Introduction:
Investment is an important element in the routine life of an investor. It is necessary for
every investor to identify and analyze all the relevant factors of the company and the
industry, economy, country etc. before making the investment into the security. Investors
could take the help of various online sources such as Morningstar, yahoo finance etc to
analyze the performance of the company and then they can make a decision about investment
into the particular country, particular industry and the particular company. Mainly 2 analysis
studies are done by the analyst and the investors to analyze the market condition and the
performance of the company in last few years and some upcoming years. Technical analysis
and fundamental analysis are the most common method to analyze the performance of the
company (Hajkowicz, Cook & Littleboy, 2012). Technical analysis study is done to make a
decision for short term investment whereas fundamental analysis study is done to make a
decision about the long term investment into a security.
This report mainly depict about the fundamental analysis. Fundamental analysis
depict the investors and analyst about the financial health of a company, for this analysis,
various economical, environmental, industry situation, future prediction, DU Pont analysis,
financial statement analysis, ratio analysis, GDP investigation, interest rate investigation etc.
has been done. Mainly fundamental analysis includes top down analysis and bottom up
analysis. Top down analysis concerns about the various external aspects such as interest rate,
GDP, future prediction, industry’s condition, AUD performance etc. consequently, the
bottom up analysis includes various internal aspects related to the firm such as ratio analysis,
final statement analysis and DU Pont analysis etc (Lou et al, 2012). bottom up analysis is
done on a particular company whereas the top down analysis depict about the entire industry
and all the related aspects which could affect the performance of the industry.
Paraphrase This Document
Need a fresh take? Get an instant paraphrase of this document with our AI Paraphraser
Financial management principles 5
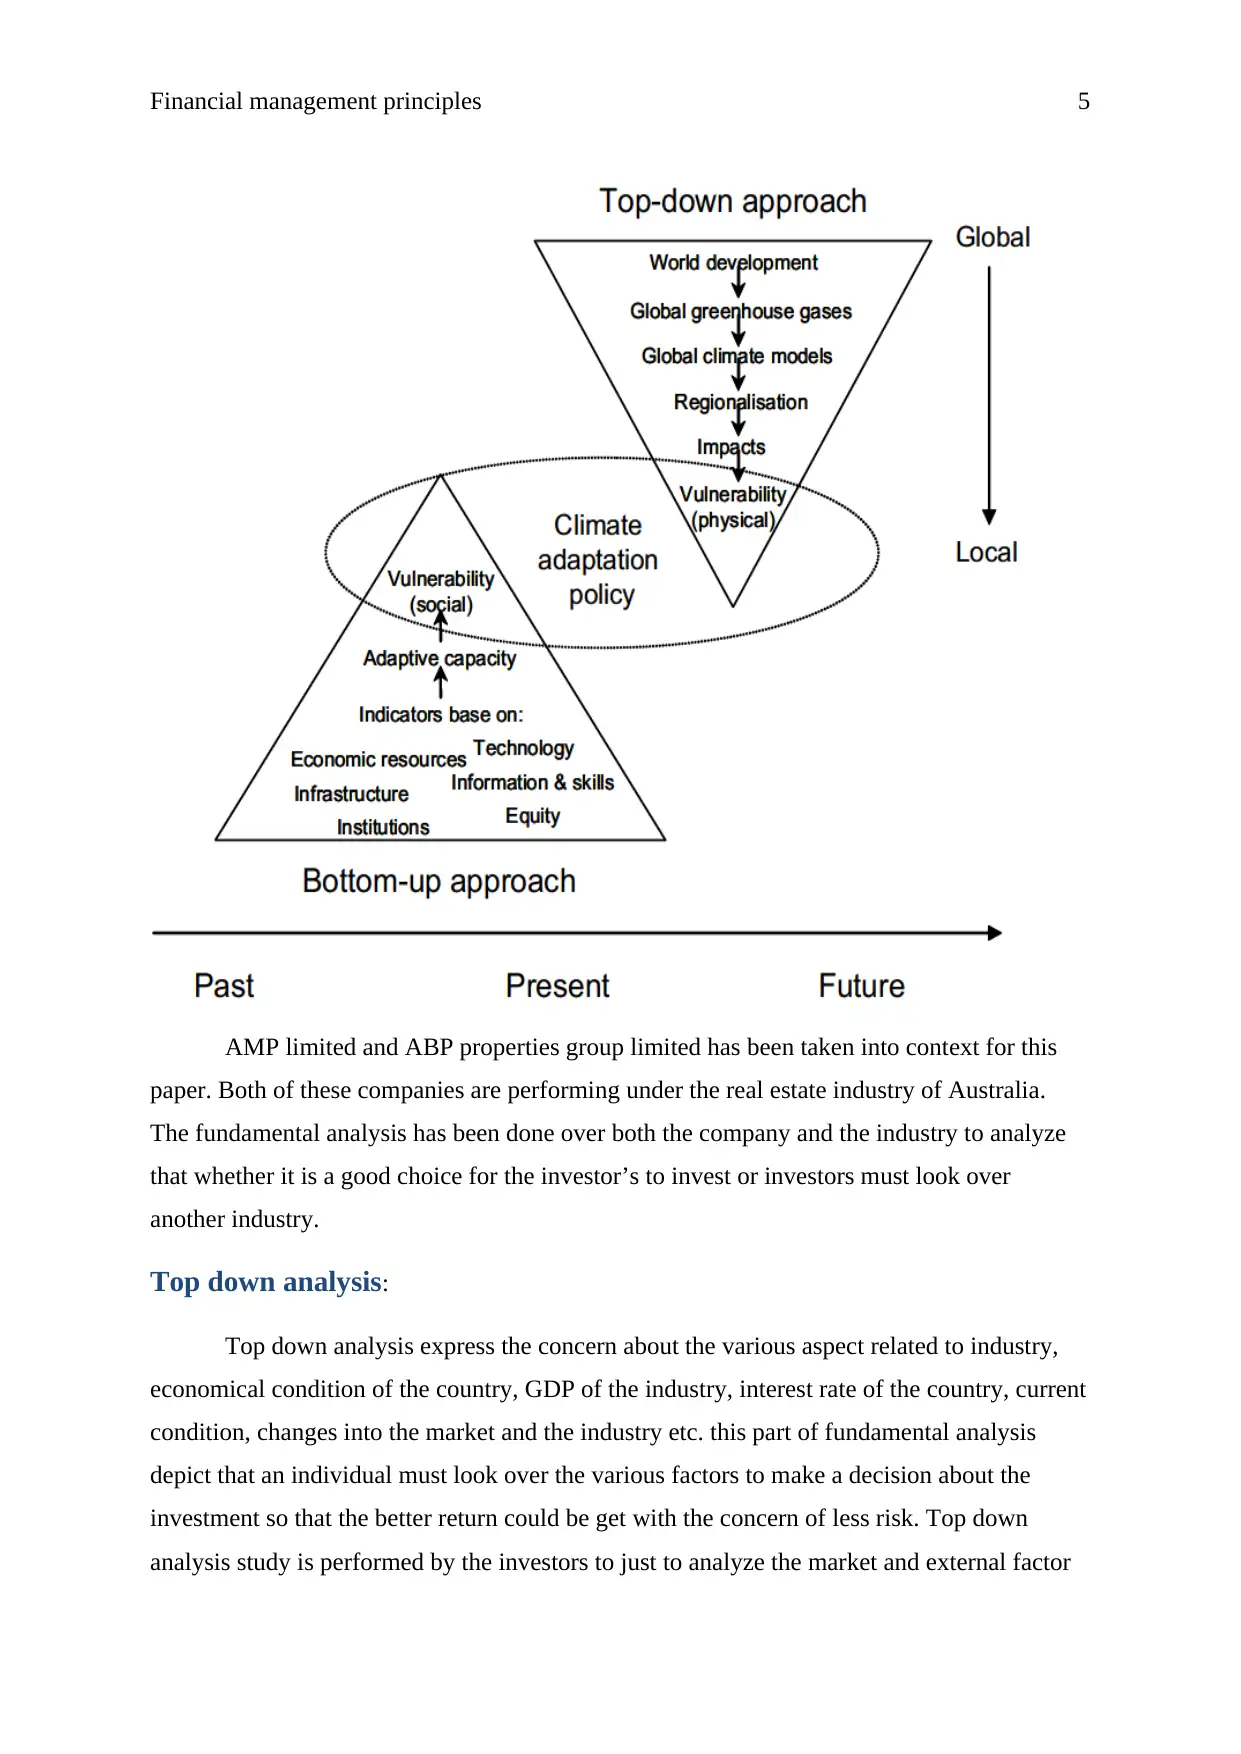
AMP limited and ABP properties group limited has been taken into context for this
paper. Both of these companies are performing under the real estate industry of Australia.
The fundamental analysis has been done over both the company and the industry to analyze
that whether it is a good choice for the investor’s to invest or investors must look over
another industry.
Top down analysis:
Top down analysis express the concern about the various aspect related to industry,
economical condition of the country, GDP of the industry, interest rate of the country, current
condition, changes into the market and the industry etc. this part of fundamental analysis
depict that an individual must look over the various factors to make a decision about the
investment so that the better return could be get with the concern of less risk. Top down
analysis study is performed by the investors to just to analyze the market and external factor
Financial management principles 6
condition. This concept depict that the external factors affect the condition of an individual
security more than the changes into the internal factors of the company. It depicts that if the
economical condition or the industry position would be decreased negatively than the security
would also be affected and thus the security price would be decreased and hence return would
also be less (Morote et al, 2013). Top down analysis is mainly performed by the investors to
express the concern of every micro factor about the company and the industry.
In this paper, ABP properties limited and AMP properties limited has been taken into
the context. Both of these companies are related to real estate industry. Various macro
economical and environmental aspects have been analyzed of real estate industry to manage
the performance of the industry so that the impact of external factors could be analyzed and
discussed over the companies which are performing their business under the real estate
industry. For this report, Australian dollars condition, interest rate of the country, real estate
industry, future changes in the industry, GDP, inflation rate, fiscal policies etc has been
analyzed over the Australian market and the real estate industry. Further, this report depicts
that how much the industry, economical and Australian market condition has affected the
performance of the company and the profitability position of the company. Through this
report, it has been concluded that the real estate industry is performing average right now.
The various crises which have taken place in last few years have impacted the performance
and the profitability position of the industry as well as the companies hugely. But currently,
various strategies and the policies had helped the company to achieve the strength again and
right now the performances are better than the last few years.
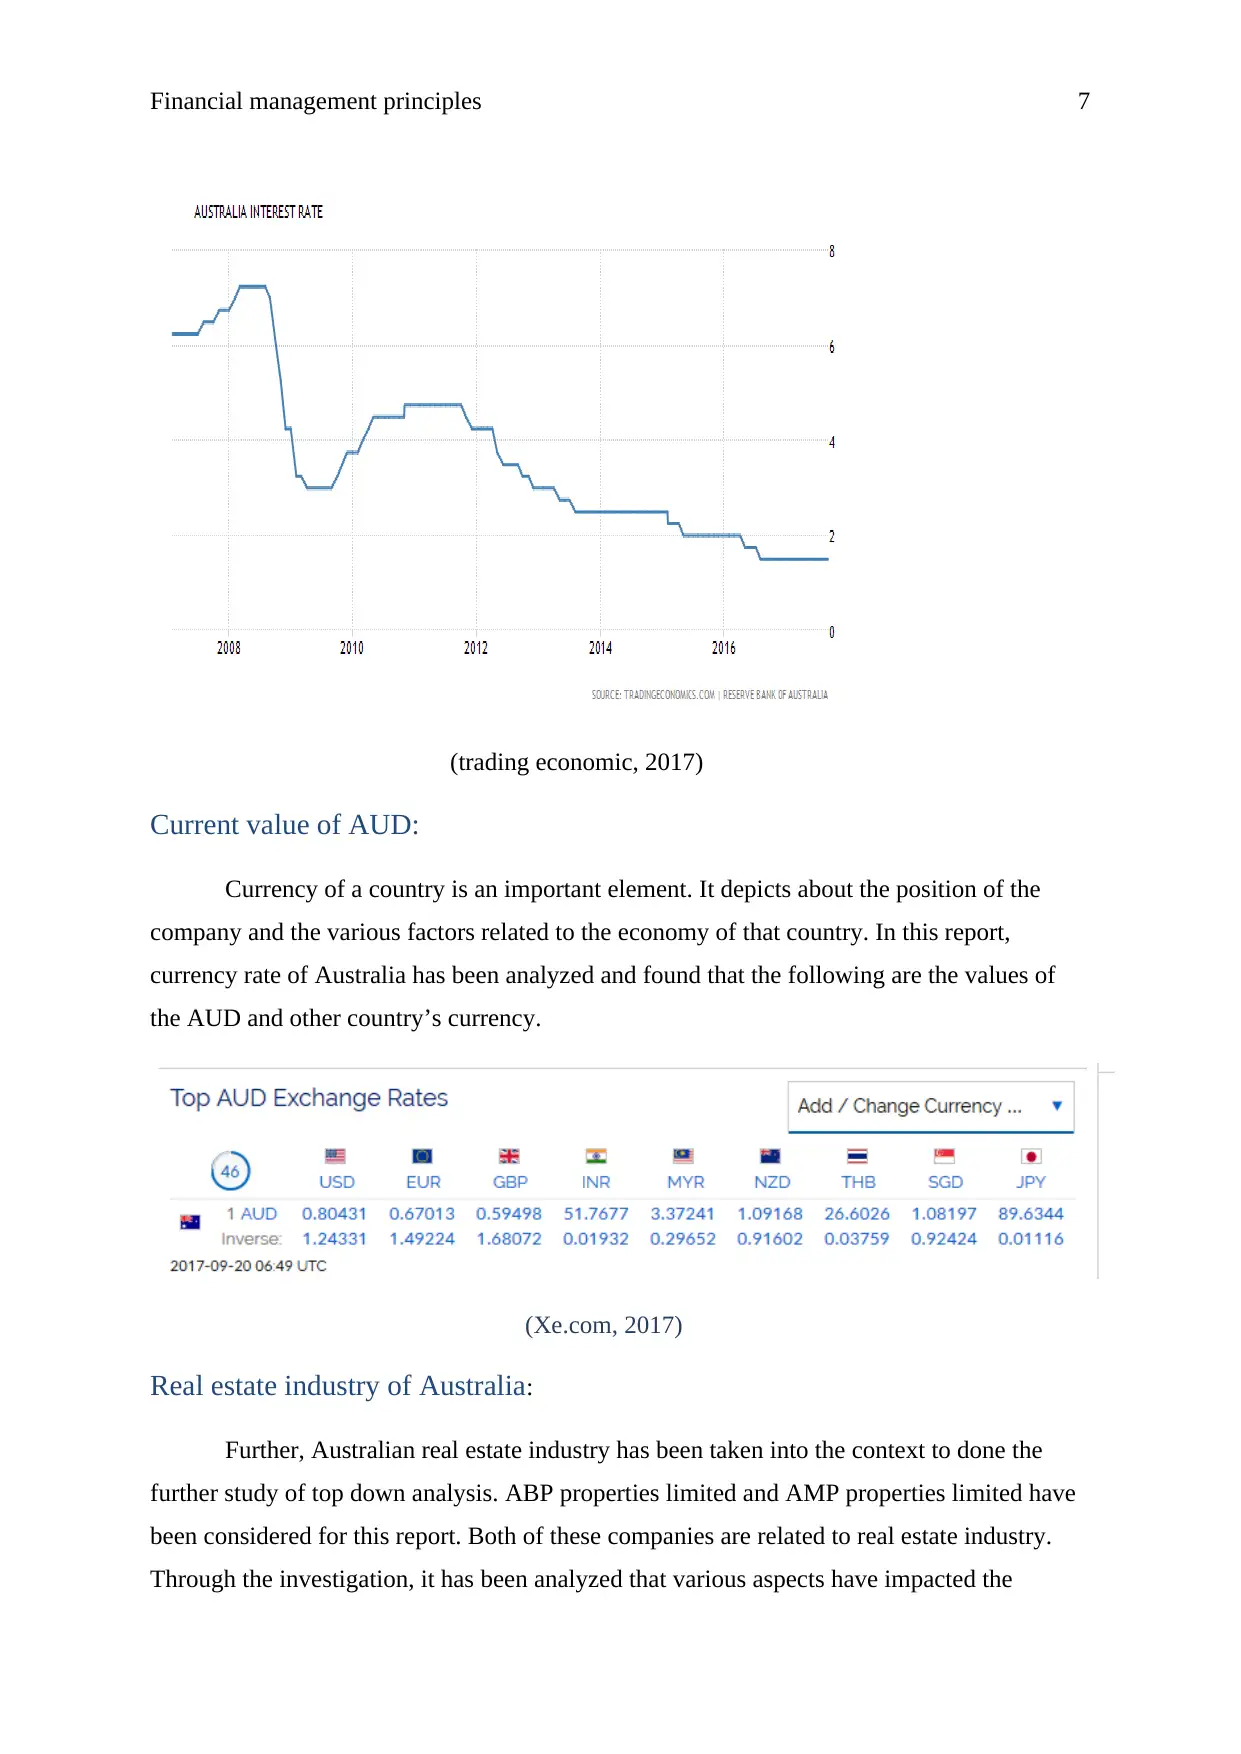
Current interest rate:
Interest rate is the amount which is charged over the principle amount as a fixed % by
the lender in return of a particular amount. Australian interest rate has been analyzed to
identify the total rate charged by the Australian government over the borrowers. It has been
analyzed that the interest rate of the country has been lowered from last year and the future
projection of the country depict that from 1990 to 2017, the average interest rate of the
country was 4.68%. Currently, a deduction of 1.50 has been noted in the interest rate of the
Australia (Nelson, Balakrishnan & Sidhu, 2012).
condition. This concept depict that the external factors affect the condition of an individual
security more than the changes into the internal factors of the company. It depicts that if the
economical condition or the industry position would be decreased negatively than the security
would also be affected and thus the security price would be decreased and hence return would
also be less (Morote et al, 2013). Top down analysis is mainly performed by the investors to
express the concern of every micro factor about the company and the industry.
In this paper, ABP properties limited and AMP properties limited has been taken into
the context. Both of these companies are related to real estate industry. Various macro
economical and environmental aspects have been analyzed of real estate industry to manage
the performance of the industry so that the impact of external factors could be analyzed and
discussed over the companies which are performing their business under the real estate
industry. For this report, Australian dollars condition, interest rate of the country, real estate
industry, future changes in the industry, GDP, inflation rate, fiscal policies etc has been
analyzed over the Australian market and the real estate industry. Further, this report depicts
that how much the industry, economical and Australian market condition has affected the
performance of the company and the profitability position of the company. Through this
report, it has been concluded that the real estate industry is performing average right now.
The various crises which have taken place in last few years have impacted the performance
and the profitability position of the industry as well as the companies hugely. But currently,
various strategies and the policies had helped the company to achieve the strength again and
right now the performances are better than the last few years.
Current interest rate:
Interest rate is the amount which is charged over the principle amount as a fixed % by
the lender in return of a particular amount. Australian interest rate has been analyzed to
identify the total rate charged by the Australian government over the borrowers. It has been
analyzed that the interest rate of the country has been lowered from last year and the future
projection of the country depict that from 1990 to 2017, the average interest rate of the
country was 4.68%. Currently, a deduction of 1.50 has been noted in the interest rate of the
Australia (Nelson, Balakrishnan & Sidhu, 2012).
⊘ This is a preview!⊘
Do you want full access?
Subscribe today to unlock all pages.
Trusted by 1+ million students worldwide
Financial management principles 7
(trading economic, 2017)
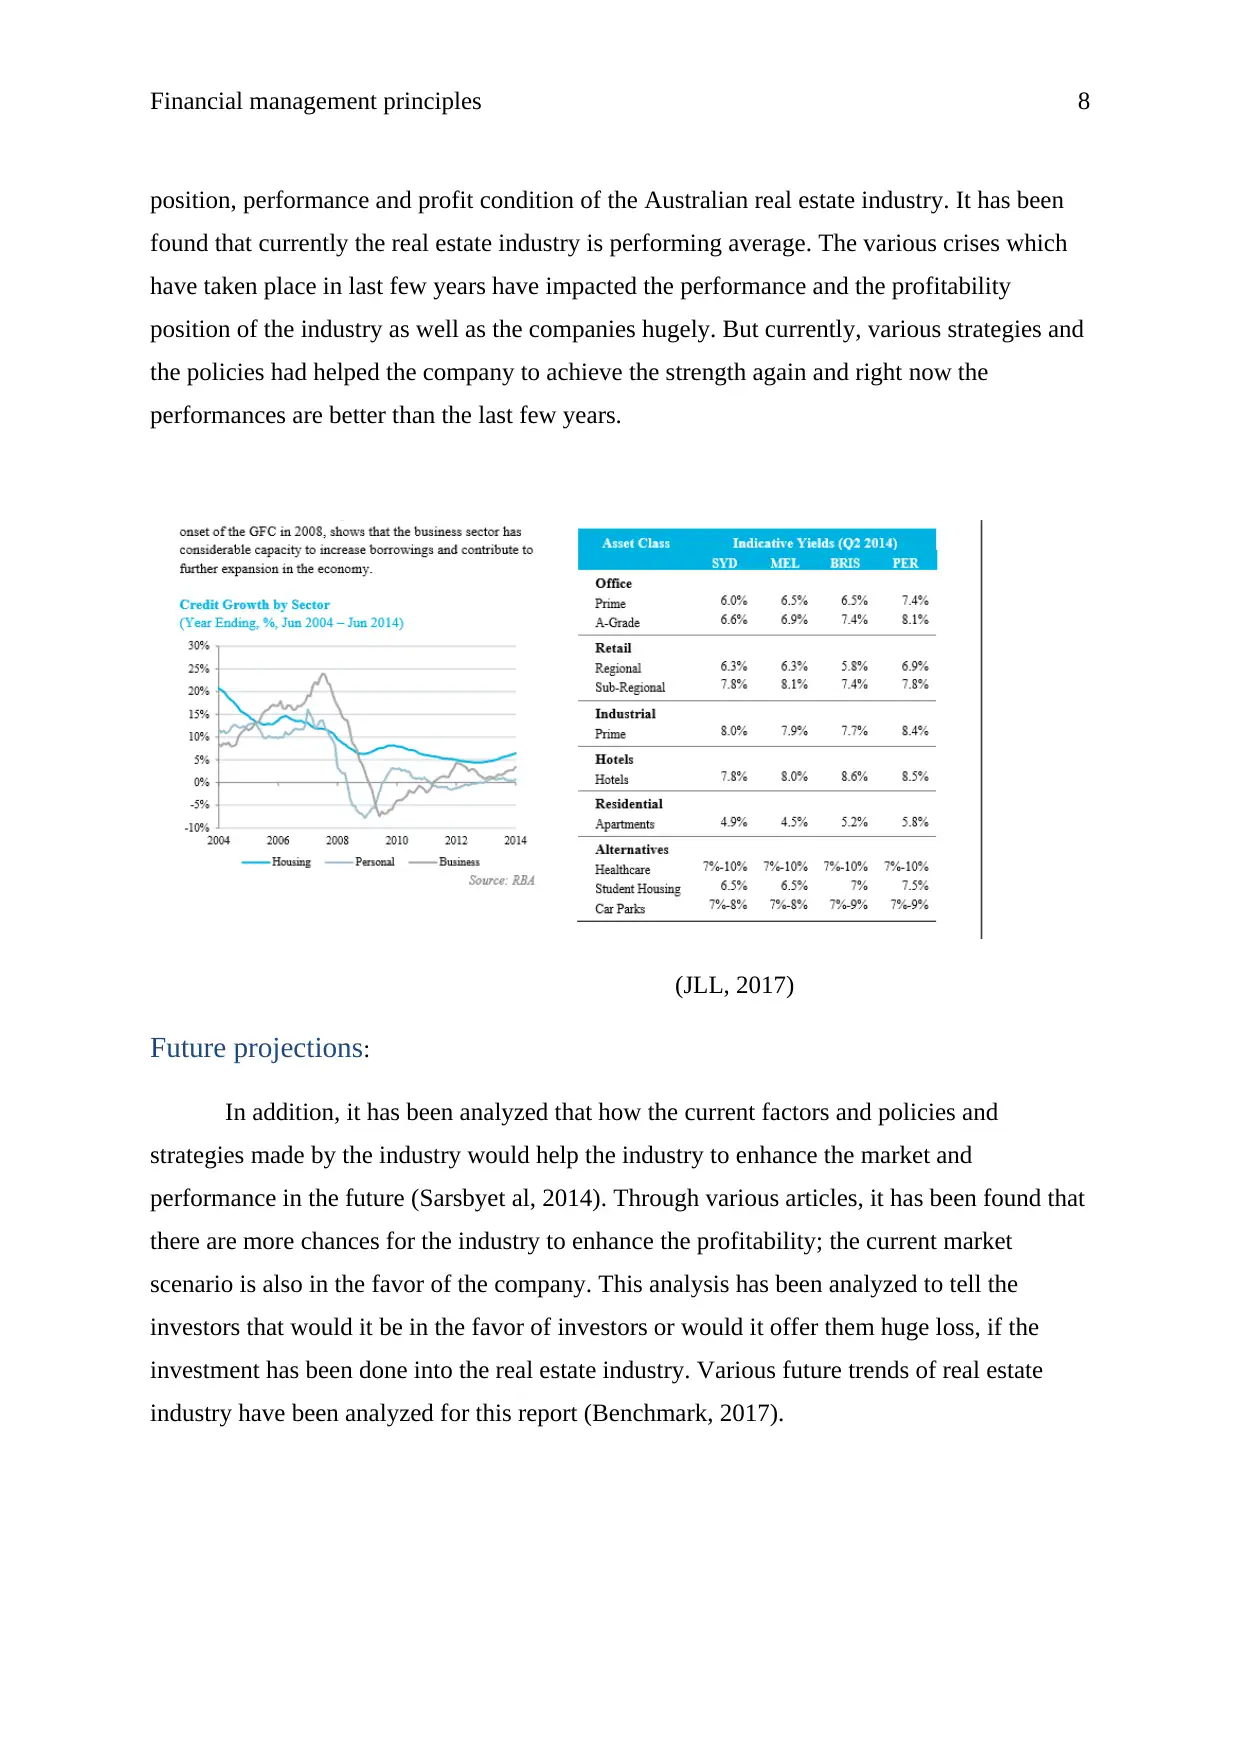
Current value of AUD:
Currency of a country is an important element. It depicts about the position of the
company and the various factors related to the economy of that country. In this report,
currency rate of Australia has been analyzed and found that the following are the values of
the AUD and other country’s currency.
(Xe.com, 2017)
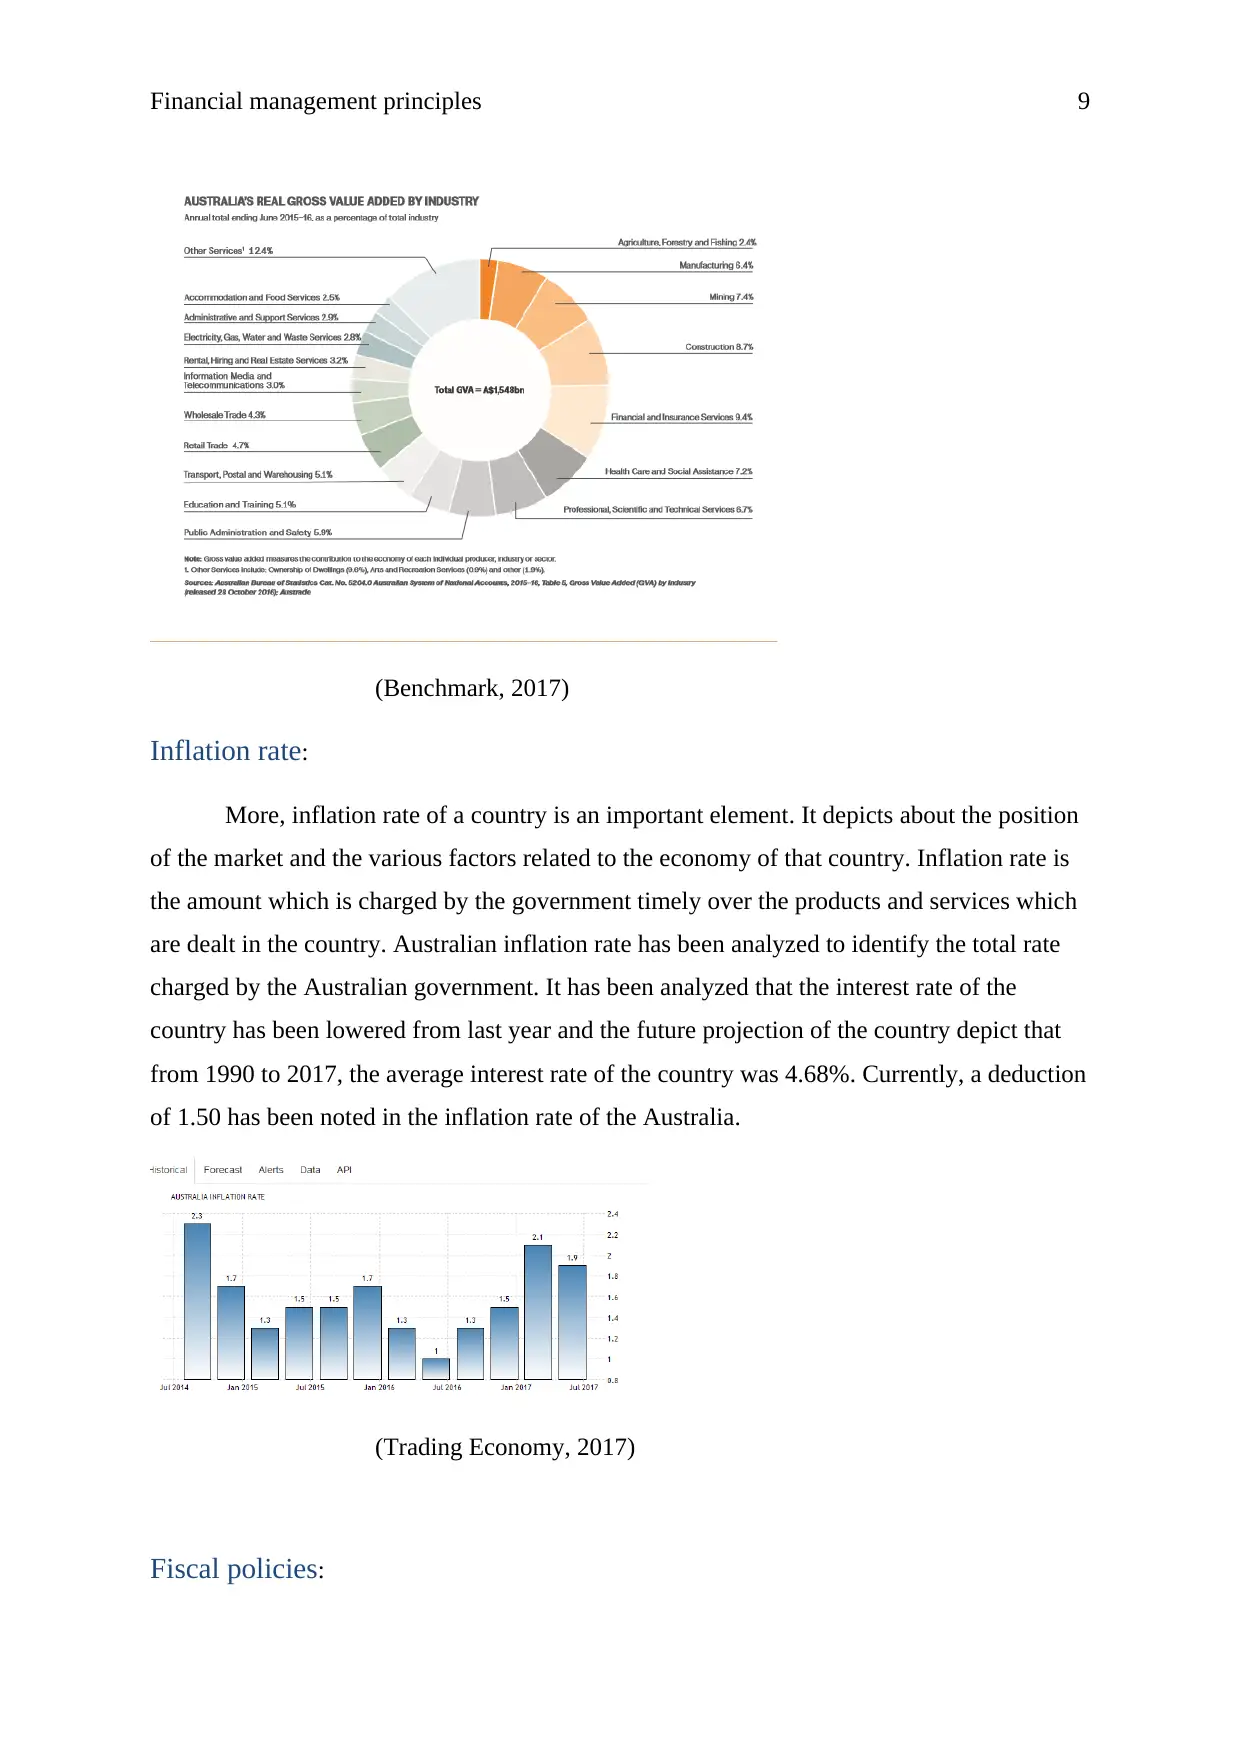
Real estate industry of Australia:
Further, Australian real estate industry has been taken into the context to done the
further study of top down analysis. ABP properties limited and AMP properties limited have
been considered for this report. Both of these companies are related to real estate industry.
Through the investigation, it has been analyzed that various aspects have impacted the
(trading economic, 2017)
Current value of AUD:
Currency of a country is an important element. It depicts about the position of the
company and the various factors related to the economy of that country. In this report,
currency rate of Australia has been analyzed and found that the following are the values of
the AUD and other country’s currency.
(Xe.com, 2017)
Real estate industry of Australia:
Further, Australian real estate industry has been taken into the context to done the
further study of top down analysis. ABP properties limited and AMP properties limited have
been considered for this report. Both of these companies are related to real estate industry.
Through the investigation, it has been analyzed that various aspects have impacted the
Paraphrase This Document
Need a fresh take? Get an instant paraphrase of this document with our AI Paraphraser
Financial management principles 8
position, performance and profit condition of the Australian real estate industry. It has been
found that currently the real estate industry is performing average. The various crises which
have taken place in last few years have impacted the performance and the profitability
position of the industry as well as the companies hugely. But currently, various strategies and
the policies had helped the company to achieve the strength again and right now the
performances are better than the last few years.
(JLL, 2017)
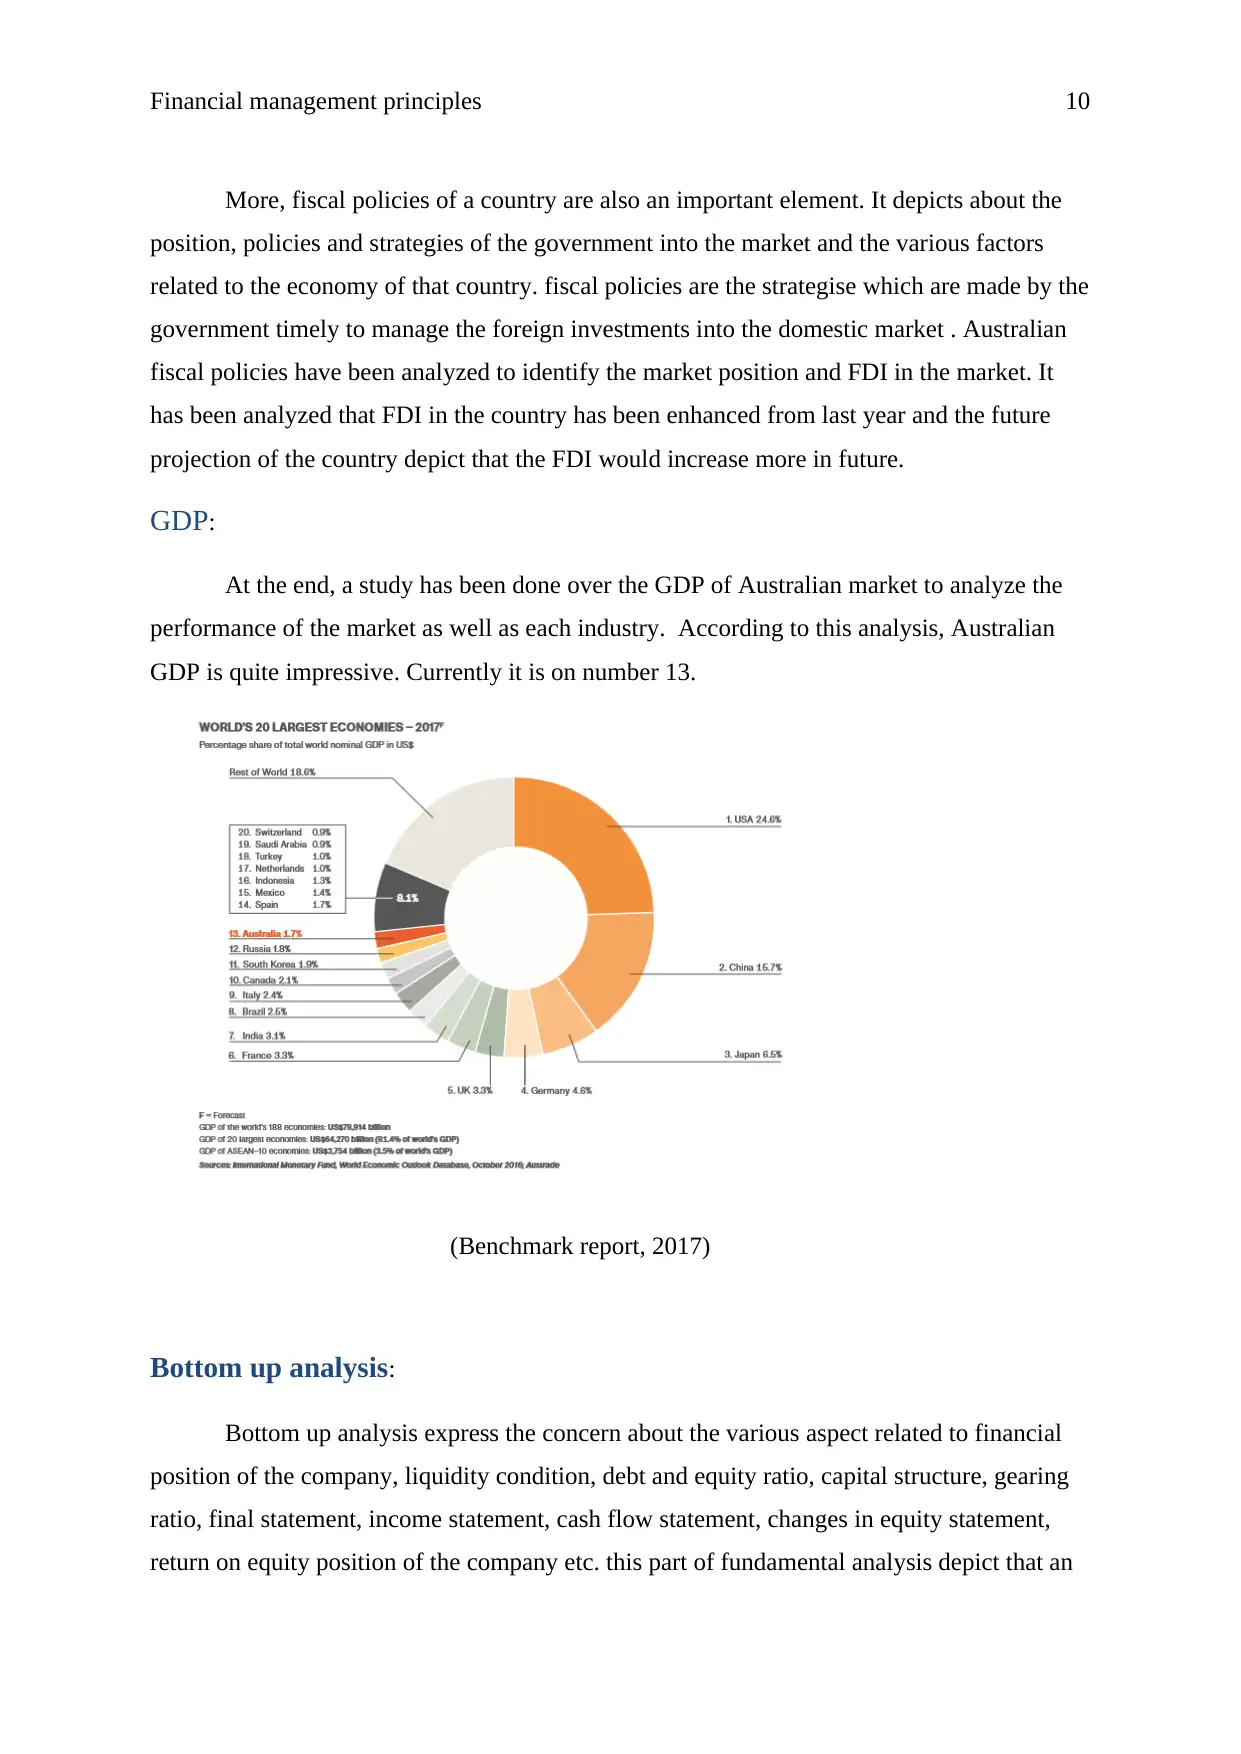
Future projections:
In addition, it has been analyzed that how the current factors and policies and
strategies made by the industry would help the industry to enhance the market and
performance in the future (Sarsbyet al, 2014). Through various articles, it has been found that
there are more chances for the industry to enhance the profitability; the current market
scenario is also in the favor of the company. This analysis has been analyzed to tell the
investors that would it be in the favor of investors or would it offer them huge loss, if the
investment has been done into the real estate industry. Various future trends of real estate
industry have been analyzed for this report (Benchmark, 2017).
position, performance and profit condition of the Australian real estate industry. It has been
found that currently the real estate industry is performing average. The various crises which
have taken place in last few years have impacted the performance and the profitability
position of the industry as well as the companies hugely. But currently, various strategies and
the policies had helped the company to achieve the strength again and right now the
performances are better than the last few years.
(JLL, 2017)
Future projections:
In addition, it has been analyzed that how the current factors and policies and
strategies made by the industry would help the industry to enhance the market and
performance in the future (Sarsbyet al, 2014). Through various articles, it has been found that
there are more chances for the industry to enhance the profitability; the current market
scenario is also in the favor of the company. This analysis has been analyzed to tell the
investors that would it be in the favor of investors or would it offer them huge loss, if the
investment has been done into the real estate industry. Various future trends of real estate
industry have been analyzed for this report (Benchmark, 2017).
Financial management principles 9
(Benchmark, 2017)
Inflation rate:
More, inflation rate of a country is an important element. It depicts about the position
of the market and the various factors related to the economy of that country. Inflation rate is
the amount which is charged by the government timely over the products and services which
are dealt in the country. Australian inflation rate has been analyzed to identify the total rate
charged by the Australian government. It has been analyzed that the interest rate of the
country has been lowered from last year and the future projection of the country depict that
from 1990 to 2017, the average interest rate of the country was 4.68%. Currently, a deduction
of 1.50 has been noted in the inflation rate of the Australia.
(Trading Economy, 2017)
Fiscal policies:
⊘ This is a preview!⊘
Do you want full access?
Subscribe today to unlock all pages.
Trusted by 1+ million students worldwide
Financial management principles 10
More, fiscal policies of a country are also an important element. It depicts about the
position, policies and strategies of the government into the market and the various factors
related to the economy of that country. fiscal policies are the strategise which are made by the
government timely to manage the foreign investments into the domestic market . Australian
fiscal policies have been analyzed to identify the market position and FDI in the market. It
has been analyzed that FDI in the country has been enhanced from last year and the future
projection of the country depict that the FDI would increase more in future.
GDP:
At the end, a study has been done over the GDP of Australian market to analyze the
performance of the market as well as each industry. According to this analysis, Australian
GDP is quite impressive. Currently it is on number 13.
(Benchmark report, 2017)
Bottom up analysis:
Bottom up analysis express the concern about the various aspect related to financial
position of the company, liquidity condition, debt and equity ratio, capital structure, gearing
ratio, final statement, income statement, cash flow statement, changes in equity statement,
return on equity position of the company etc. this part of fundamental analysis depict that an
Paraphrase This Document
Need a fresh take? Get an instant paraphrase of this document with our AI Paraphraser
Financial management principles 11
individual must look over the various factors to make a decision about the investment so that
the better return could be get with the concern of less risk. Bottom up analysis study is
performed by the investors to just to analyze the internal factor condition. This concept depict
that the internal factors affect the condition of an individual security more than the changes
into the external factors of the company. It depicts that if the internal position and
performance would be decreased negatively than the security would also be affected and thus
the security price would be decreased and hence return would also be less. Bottom up
analysis is mainly performed by the investors to express the concern of every micro factor
about the company.
In this paper, ABP properties limited and AMP properties limited has been taken into
the context. Both of these companies are related to real estate industry. Various micro aspects
have been analyzed of ABP properties limited and AMP properties limited to manage the
performance of the company so that the impact of internal factors could be analyzed and
discussed over the companies which are performing their business under the real estate
industry (Parker, & Vannest, 2012). For this report, financial position of the company,
liquidity condition, debt and equity ratio, capital structure, gearing ratio, final statement,
income statement, cash flow statement, changes in equity statement, return on equity position
of the company etc has been analyzed over the companies. Further, this report depicts that
how much the internal factors have affected the performance of the company and the
profitability position of the company. Through this report, it has been concluded that the
performance of both the companies are different from each other. Various strategies and the
policies had helped the companies to achieve the strength again and right now the
performances are better of both the companies than the last few years.
Ratio analysis:
Ratio analysis is main part of bottom up analysis. This study depict about all the entire
aspects and changes into the financial performance of the company. This study assists the
investors to make a better decision about the investment into the company. Through the ratio
analysis, it becomes easy for the investors to analyze the various financial position of the
company in terms of current ratio, quick ratio, net profit, gross profit, debt equity ratio,
efficiency ratio etc. for this paper, ABP properties limited and AMP properties limited has
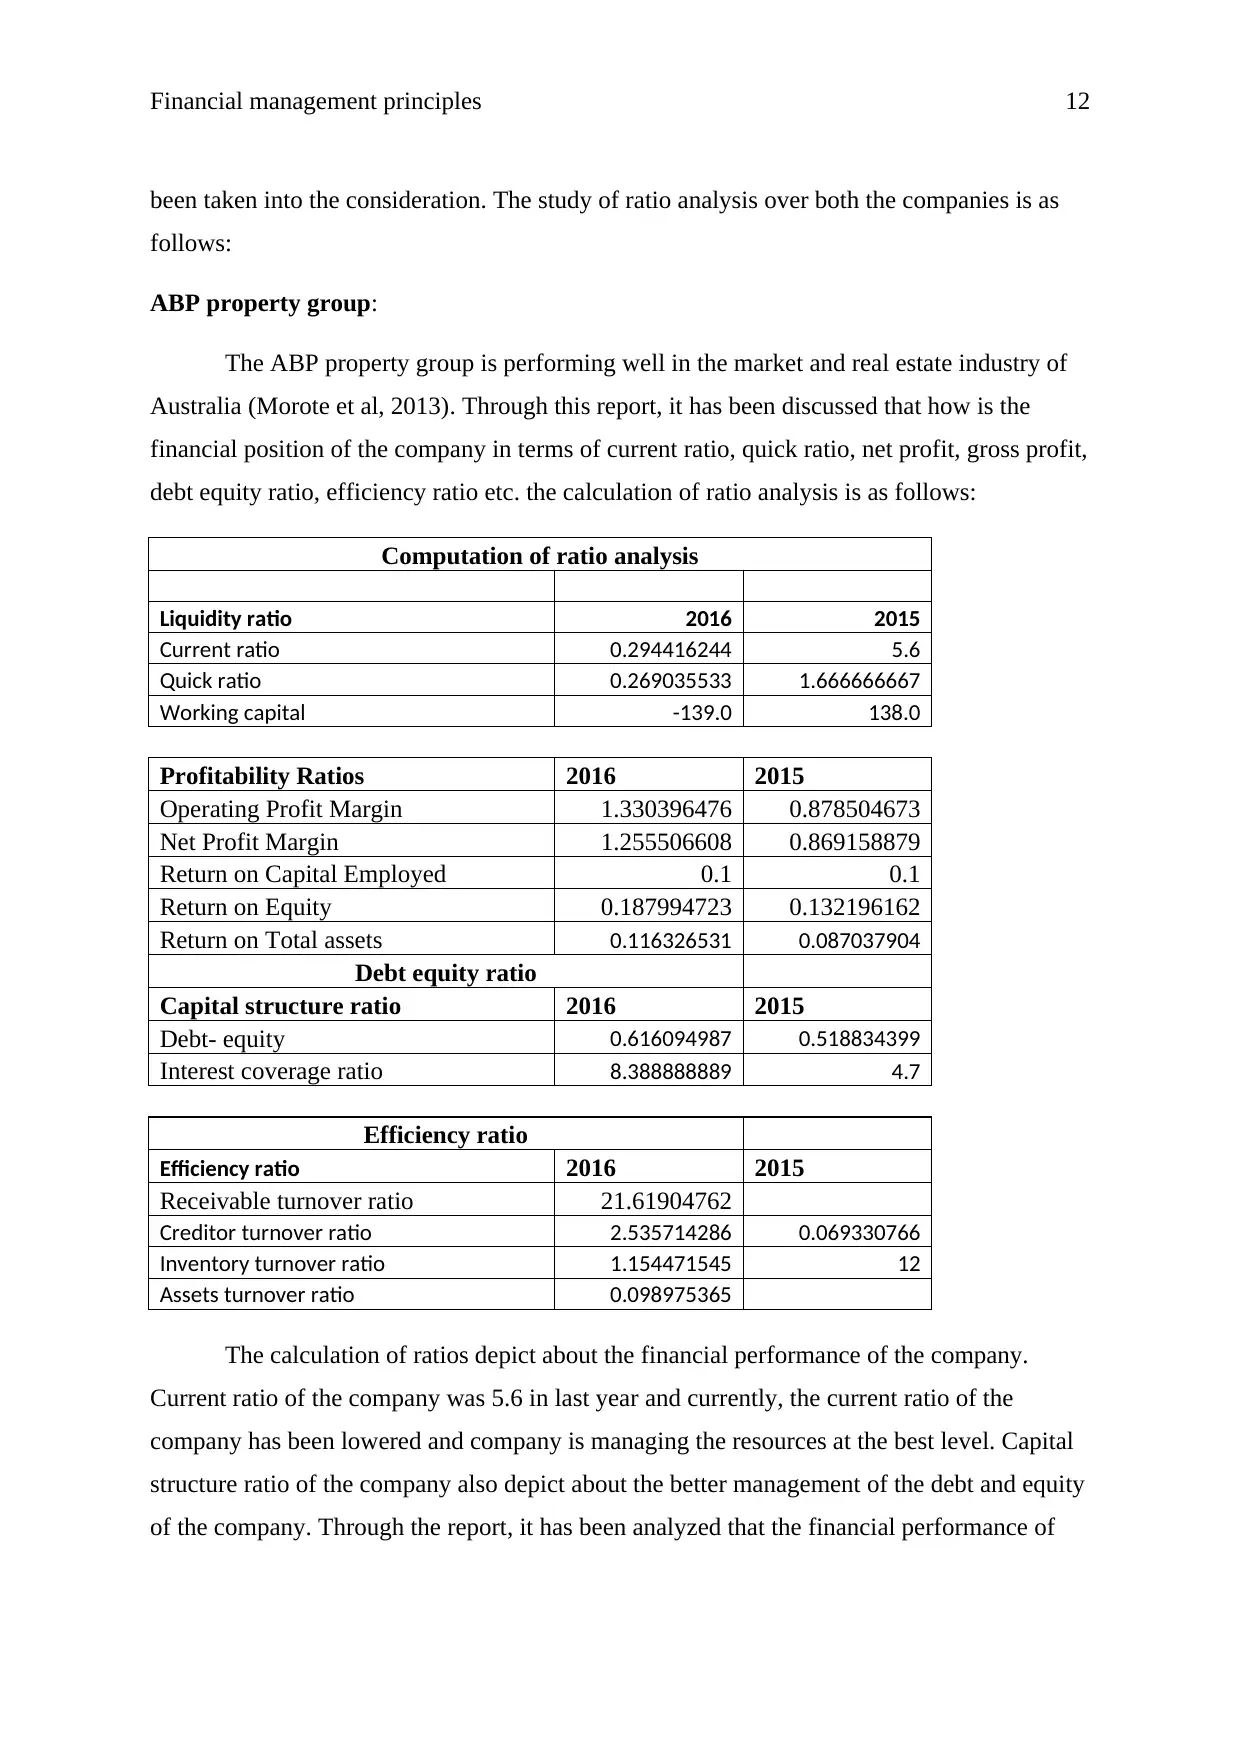
Financial management principles 12
been taken into the consideration. The study of ratio analysis over both the companies is as
follows:
ABP property group:
The ABP property group is performing well in the market and real estate industry of
Australia (Morote et al, 2013). Through this report, it has been discussed that how is the
financial position of the company in terms of current ratio, quick ratio, net profit, gross profit,
debt equity ratio, efficiency ratio etc. the calculation of ratio analysis is as follows:
Computation of ratio analysis
Liquidity ratio 2016 2015
Current ratio 0.294416244 5.6
Quick ratio 0.269035533 1.666666667
Working capital -139.0 138.0
Profitability Ratios 2016 2015
Operating Profit Margin 1.330396476 0.878504673
Net Profit Margin 1.255506608 0.869158879
Return on Capital Employed 0.1 0.1
Return on Equity 0.187994723 0.132196162
Return on Total assets 0.116326531 0.087037904
Debt equity ratio
Capital structure ratio 2016 2015
Debt- equity 0.616094987 0.518834399
Interest coverage ratio 8.388888889 4.7
Efficiency ratio
Efficiency ratio 2016 2015
Receivable turnover ratio 21.61904762
Creditor turnover ratio 2.535714286 0.069330766
Inventory turnover ratio 1.154471545 12
Assets turnover ratio 0.098975365
The calculation of ratios depict about the financial performance of the company.
Current ratio of the company was 5.6 in last year and currently, the current ratio of the
company has been lowered and company is managing the resources at the best level. Capital
structure ratio of the company also depict about the better management of the debt and equity
of the company. Through the report, it has been analyzed that the financial performance of
⊘ This is a preview!⊘
Do you want full access?
Subscribe today to unlock all pages.
Trusted by 1+ million students worldwide
1 out of 22
Related Documents


Your All-in-One AI-Powered Toolkit for Academic Success.
+13062052269
info@desklib.com
Available 24*7 on WhatsApp / Email
![[object Object]](/_next/static/media/star-bottom.7253800d.svg)
Unlock your academic potential
Copyright © 2020–2026 A2Z Services. All Rights Reserved. Developed and managed by ZUCOL.