Comparative Analysis: Fundamental and Technical of Two Companies
VerifiedAdded on 2023/01/23
|11
|1883
|80
Report
AI Summary
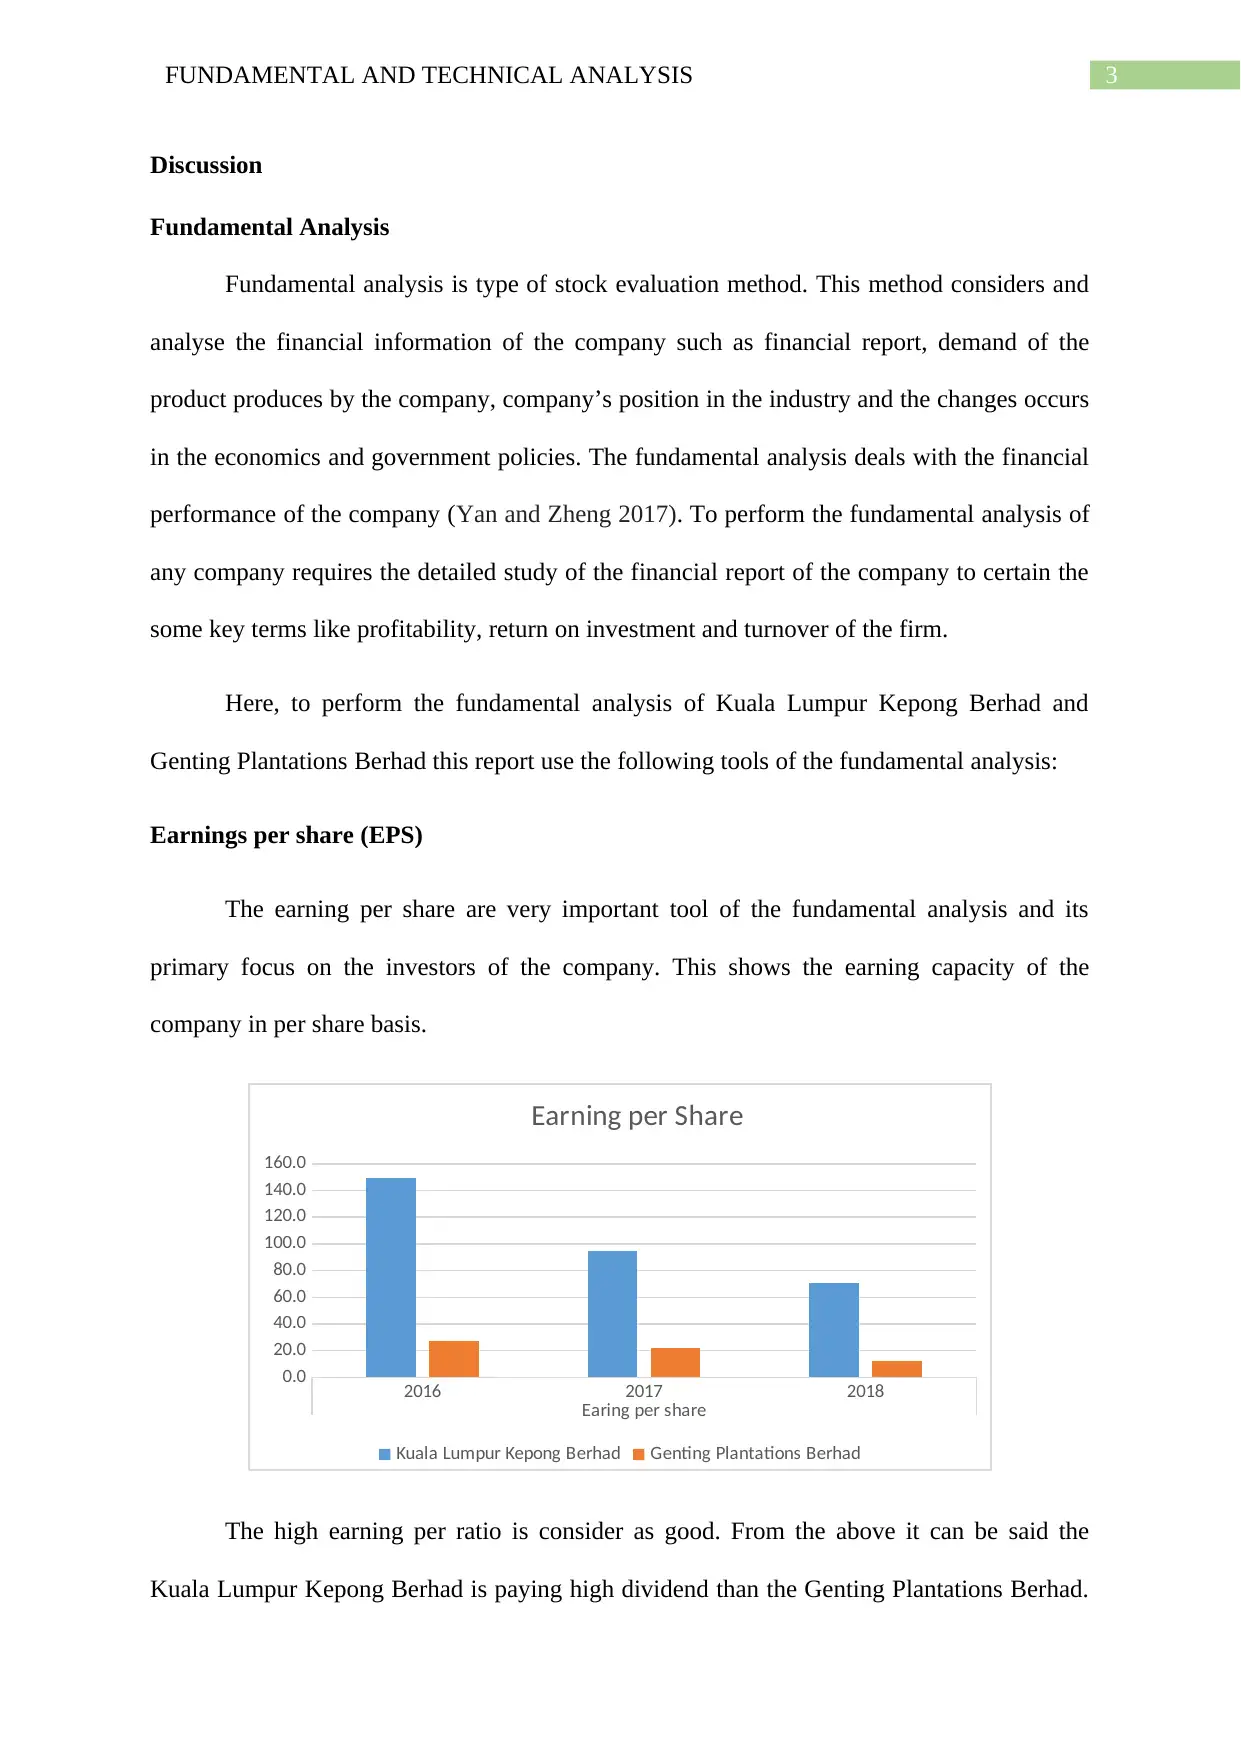
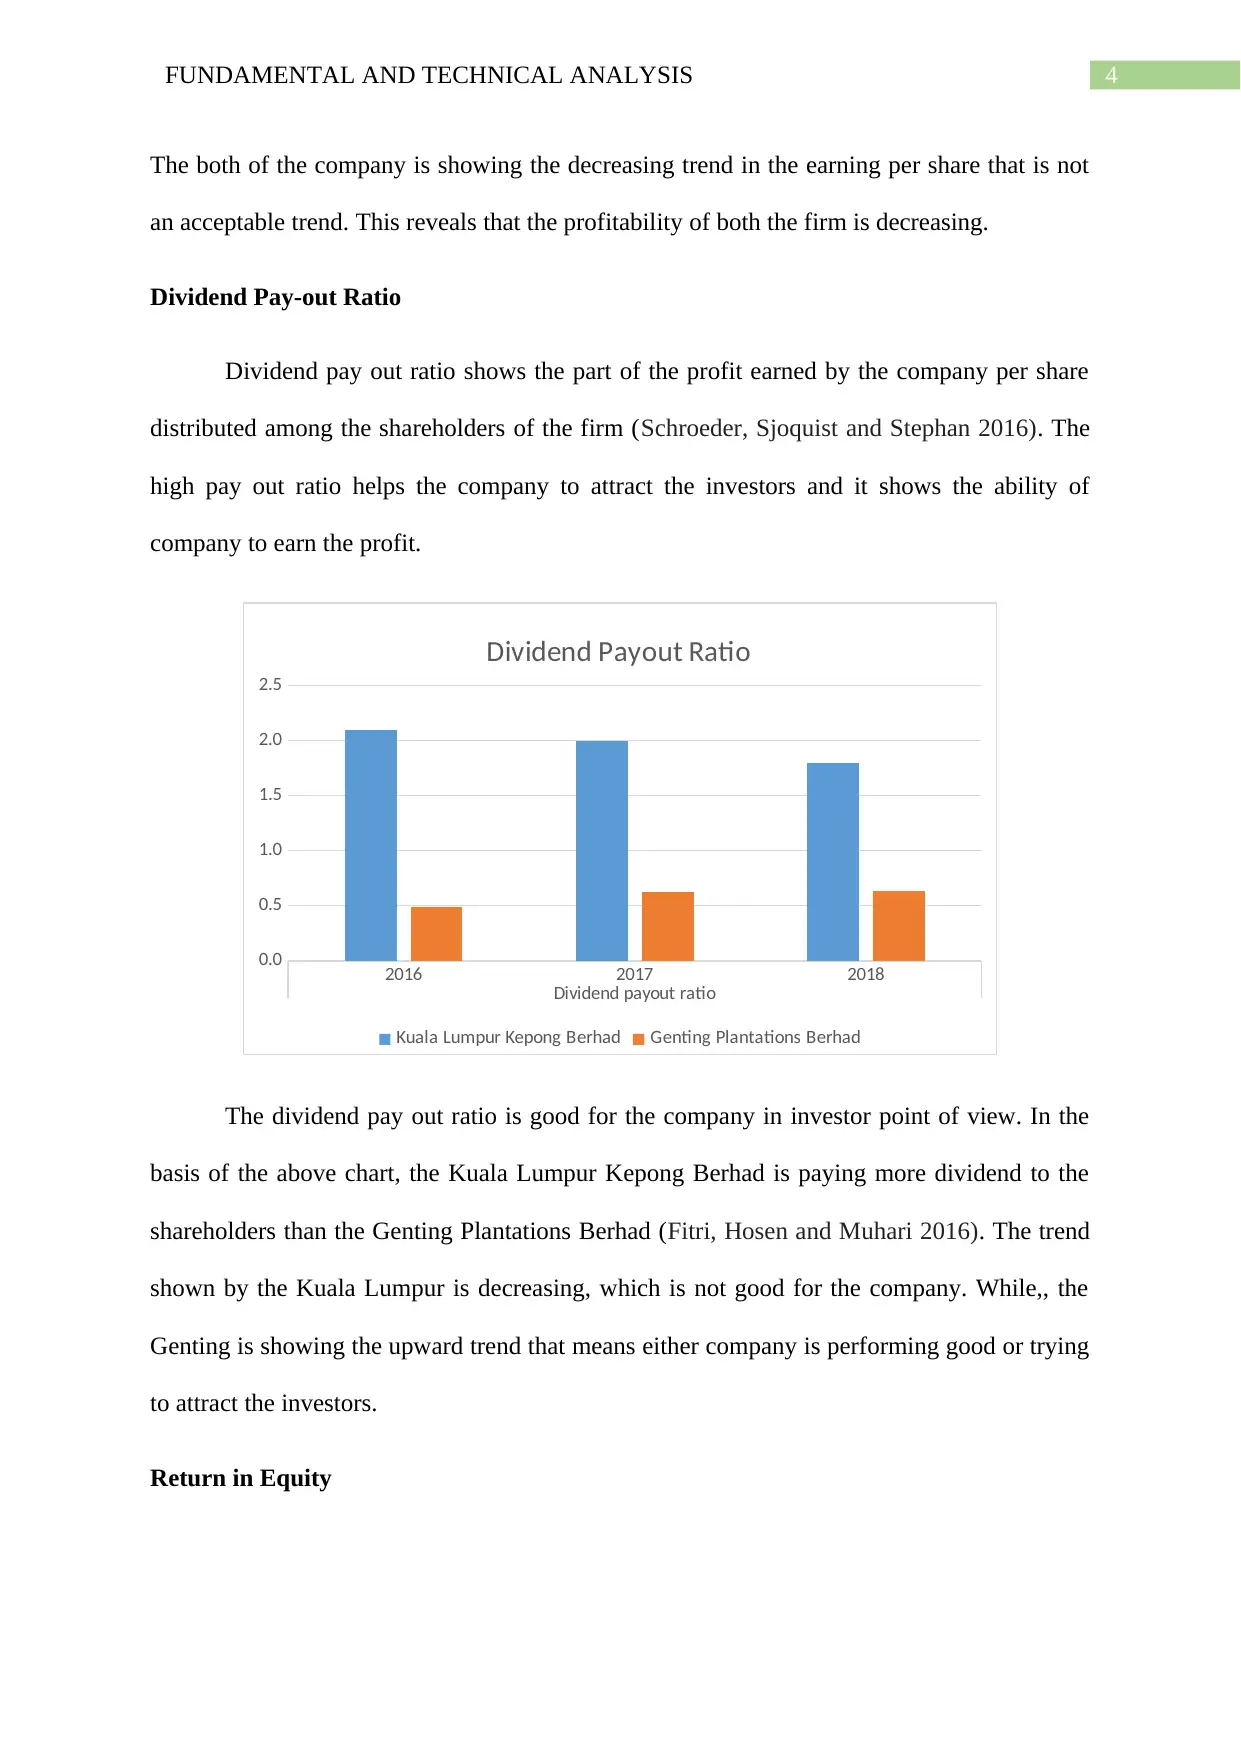
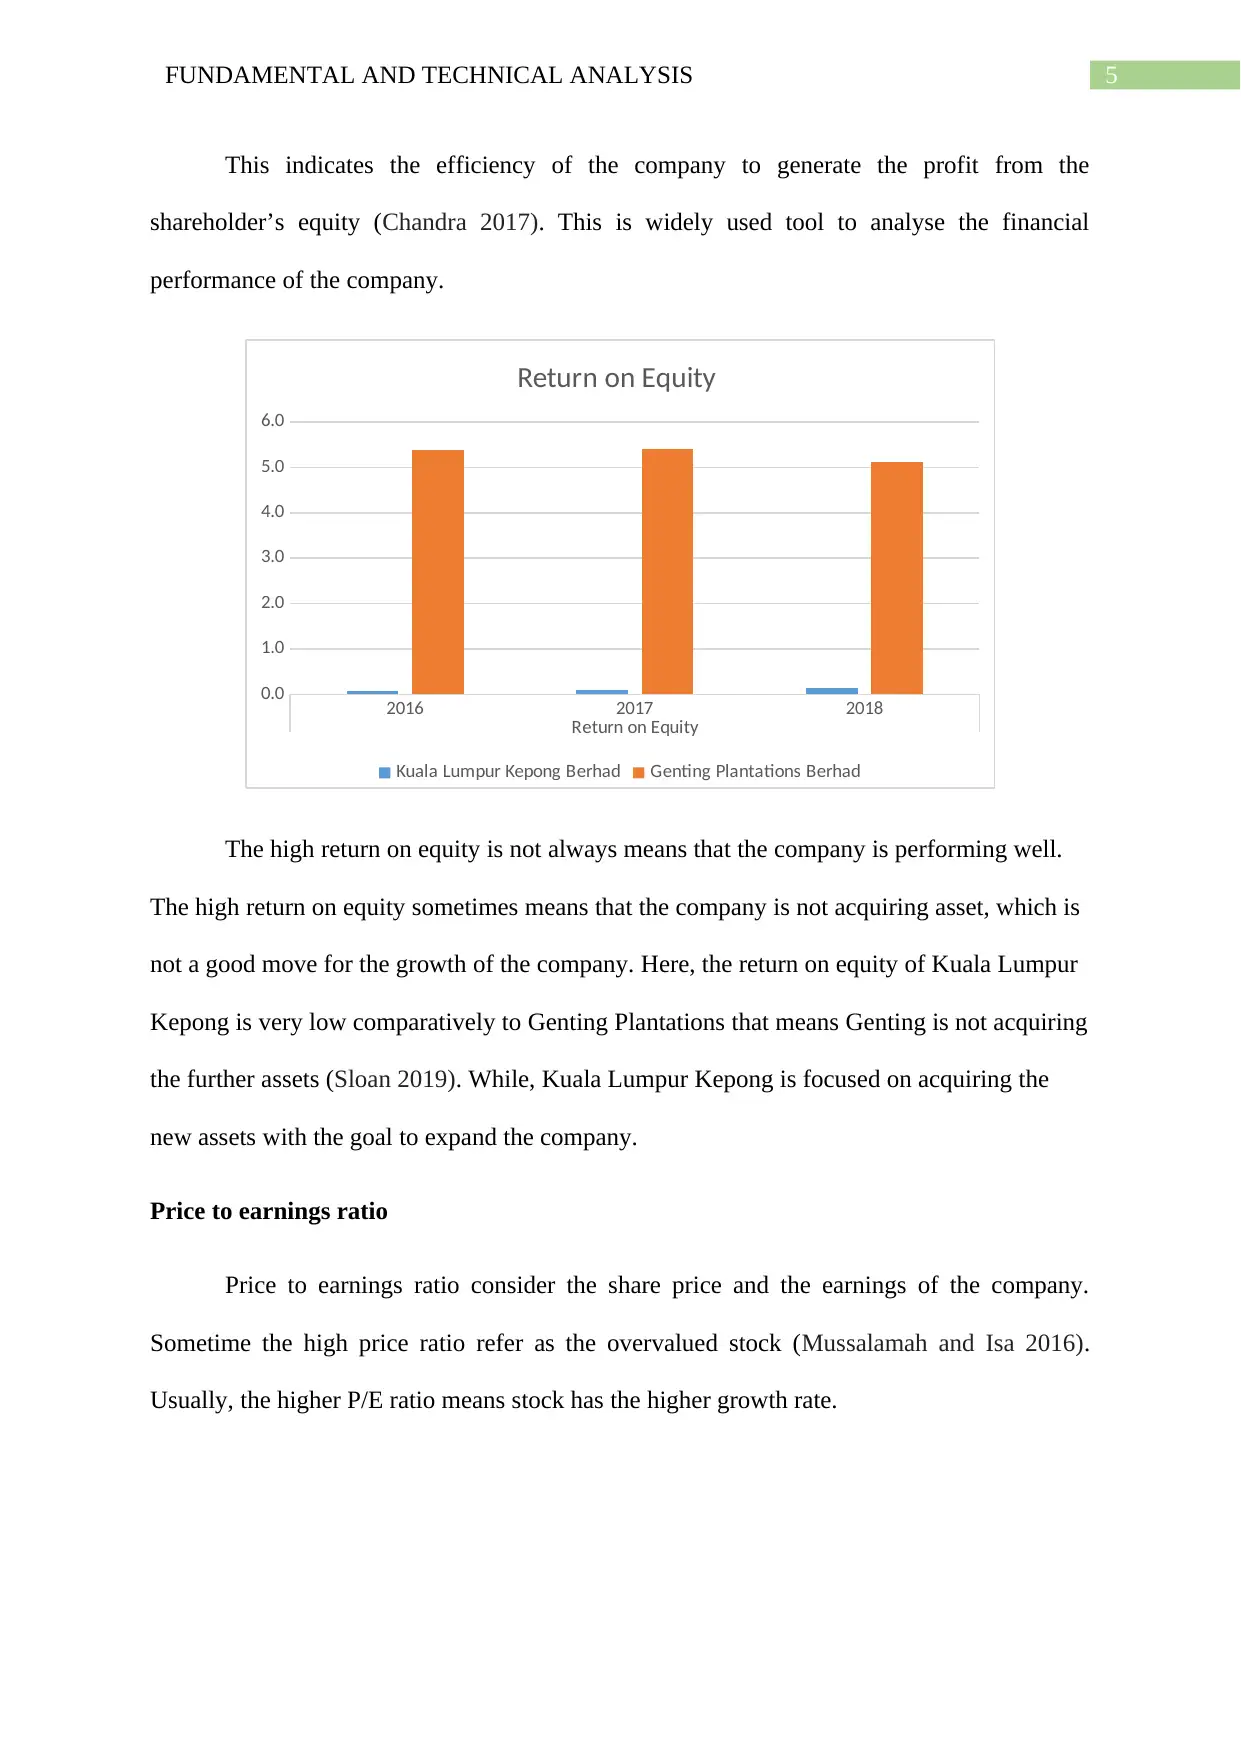
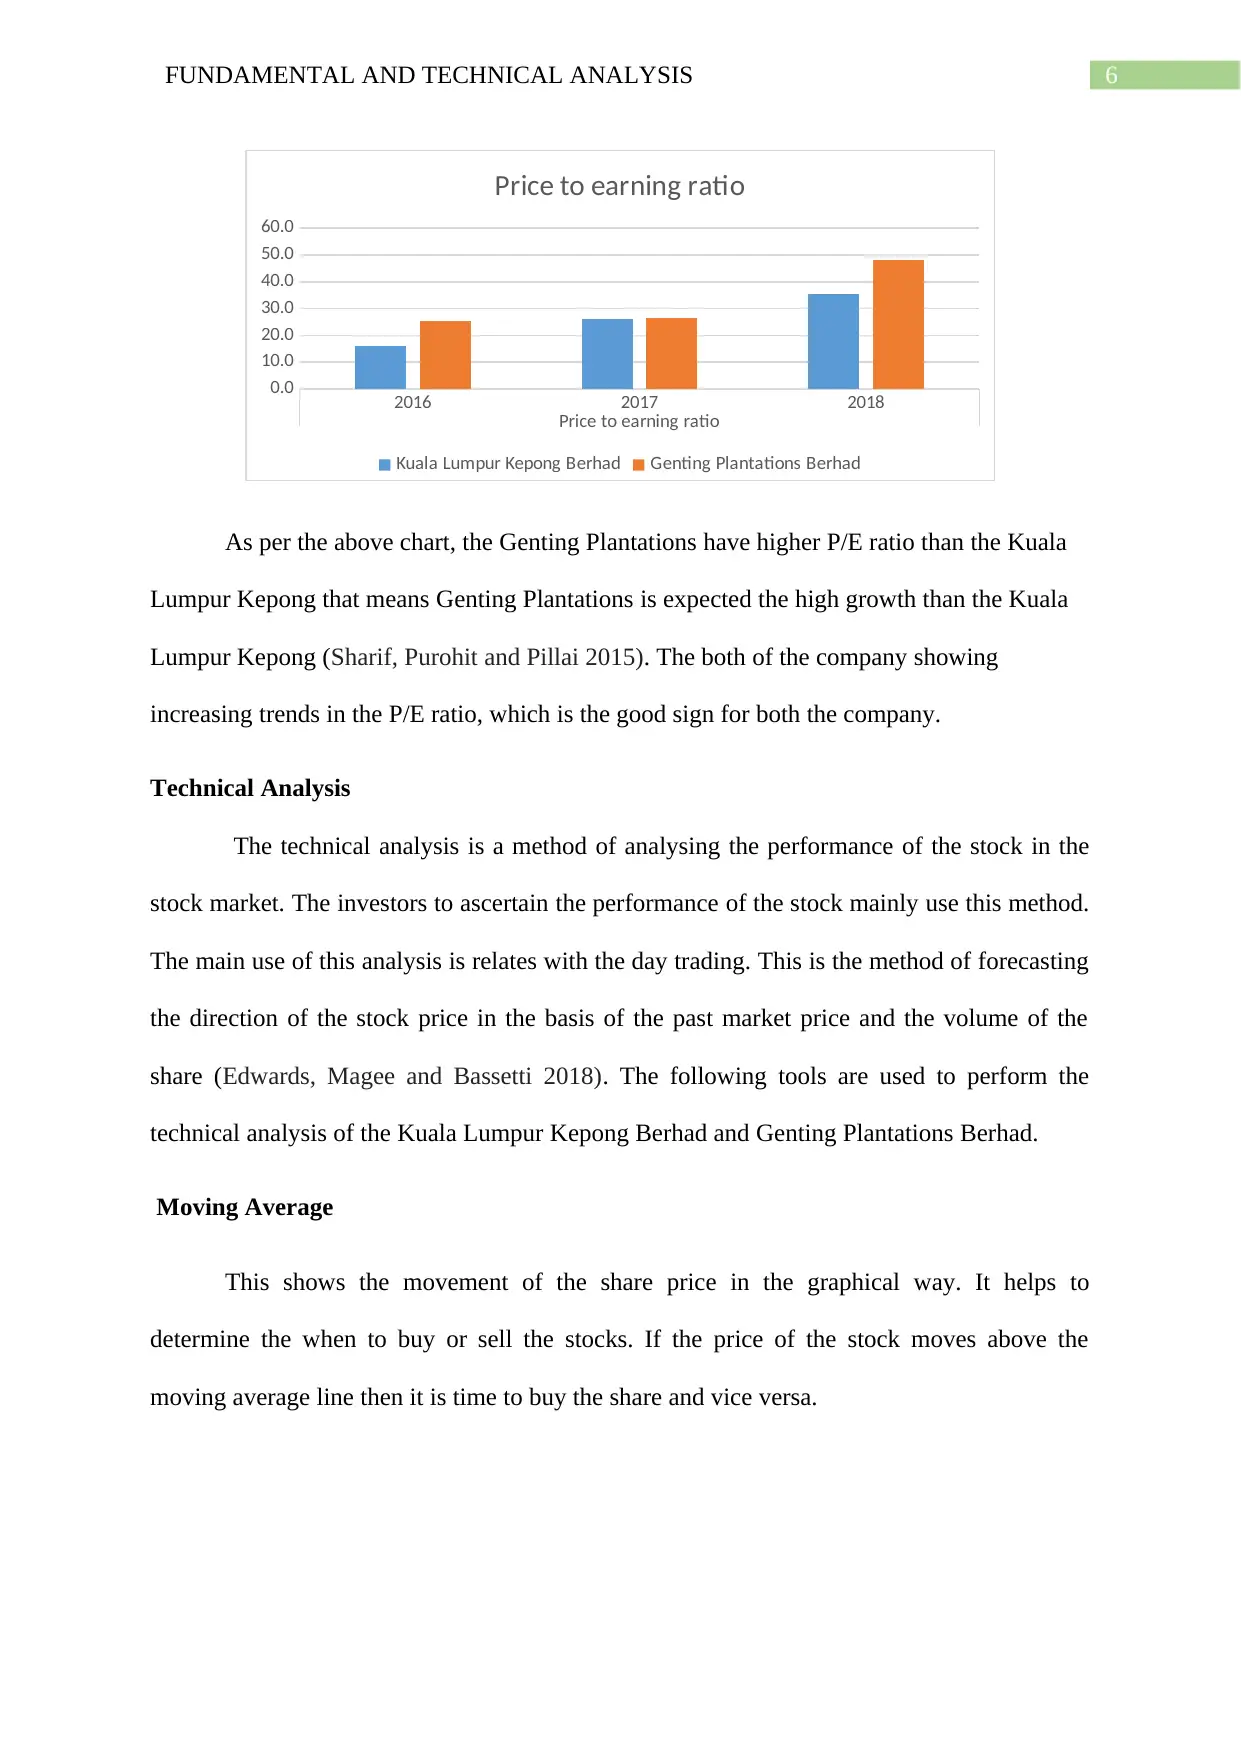
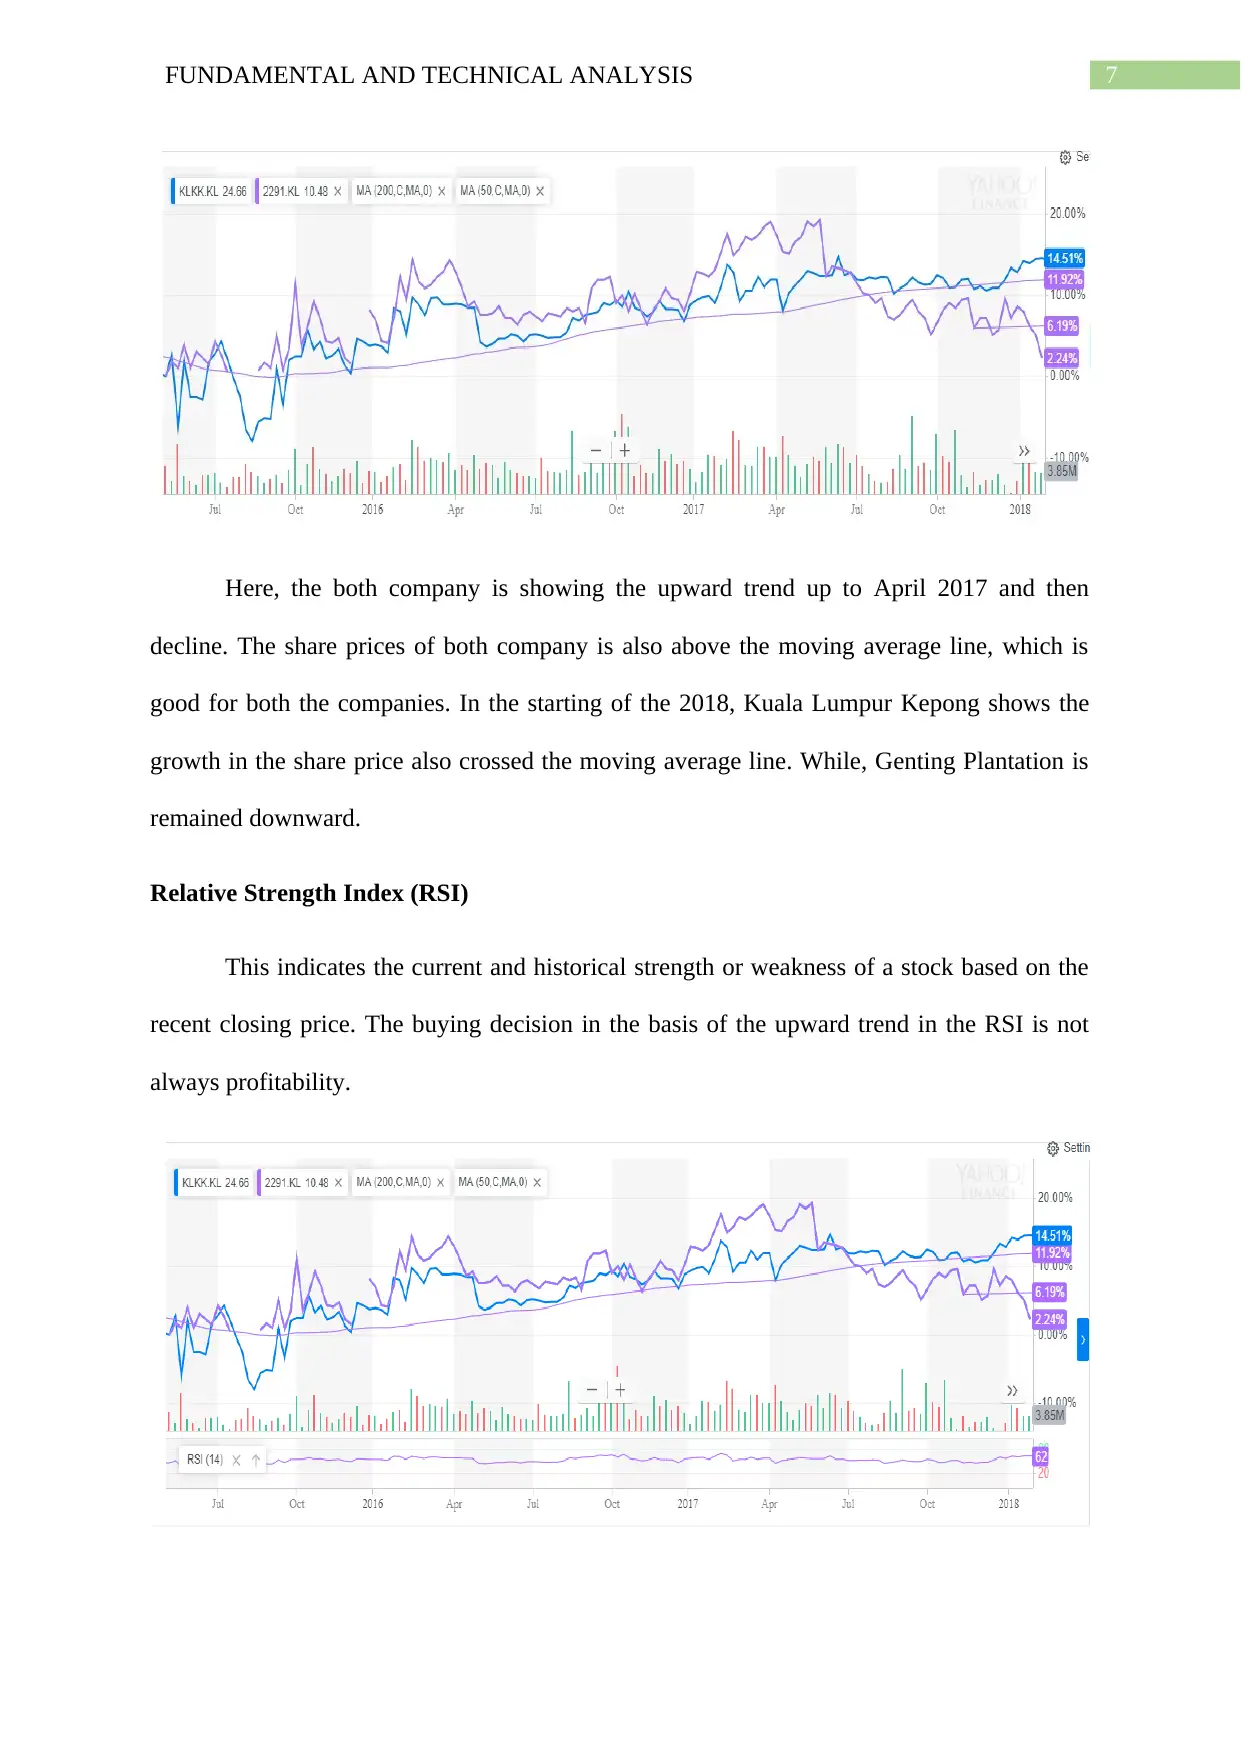
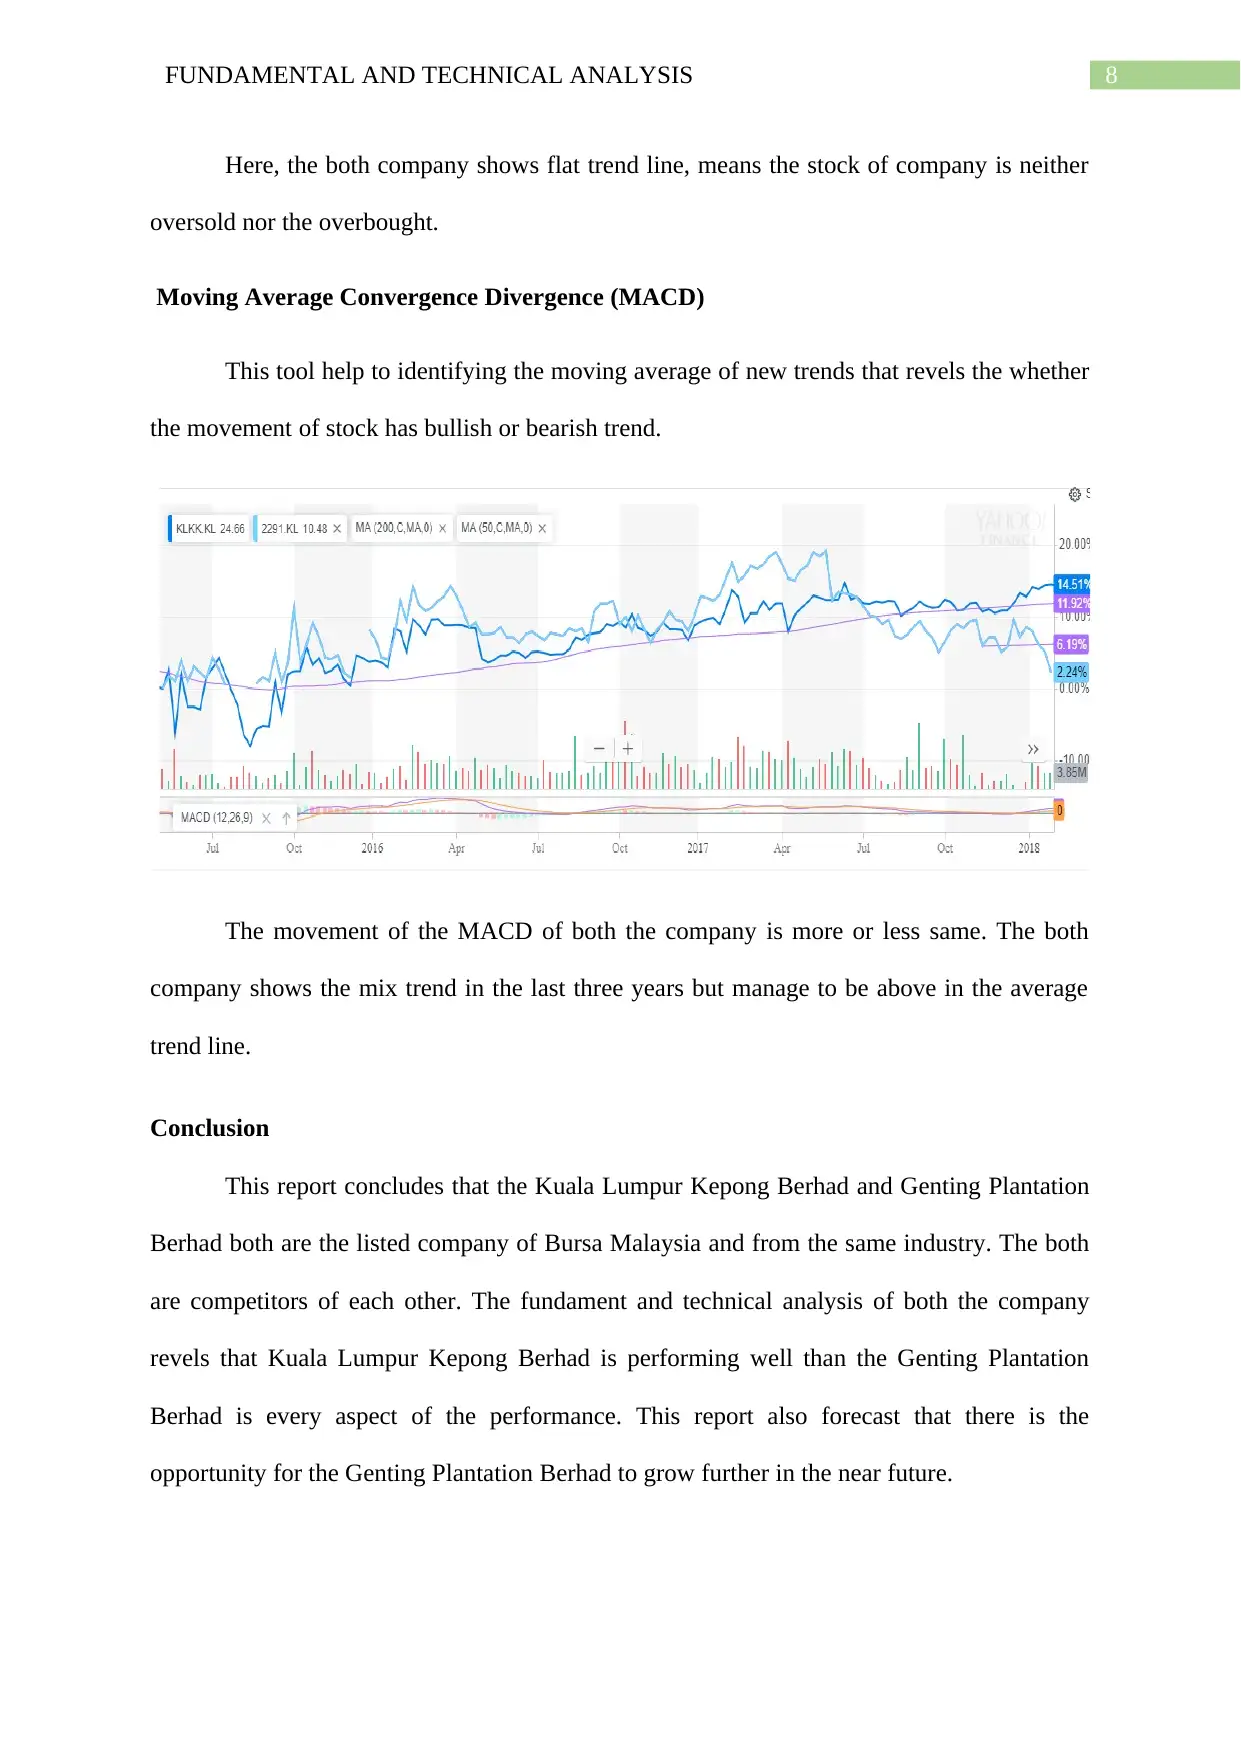
This report conducts a comparative analysis of two Malaysian companies, Kuala Lumpur Kepong Berhad and Genting Plantations Berhad, both operating in the plantation industry and listed on the Bursa Malaysia stock exchange. The analysis employs both fundamental and technical approaches to evaluate their financial performance. Fundamental analysis includes an examination of key financial metrics such as Earnings per Share (EPS), dividend payout ratio, return on equity, and price-to-earnings ratio, comparing the trends and performance of each company over a three-year period. Technical analysis utilizes tools like moving averages, Relative Strength Index (RSI), and Moving Average Convergence Divergence (MACD) to assess stock price movements and market trends. The report concludes with a comparative assessment, highlighting the strengths and weaknesses of each company based on the analysis, and offers insights into their potential for future growth and investment opportunities. The report is based on the student's work and is available on Desklib.
Contribute Materials
Your contribution can guide someone’s learning journey. Share your
documents today.

Running head: FUNDAMENTAL AND TECHNICAL ANALYSIS
FUNDAMENTAL AND TECHNICAL ANALYSIS
Name of the Student:
Name of the University:
Author Note
FUNDAMENTAL AND TECHNICAL ANALYSIS
Name of the Student:
Name of the University:
Author Note
Secure Best Marks with AI Grader
Need help grading? Try our AI Grader for instant feedback on your assignments.

1FUNDAMENTAL AND TECHNICAL ANALYSIS
Table of Contents
Introduction................................................................................................................................2
Genting Plantations Berhad....................................................................................................2
Kuala Lumpur Kepong Berhad..............................................................................................2
Discussion..................................................................................................................................3
Fundamental Analysis............................................................................................................3
Technical Analysis.................................................................................................................6
Conclusion..................................................................................................................................8
References..................................................................................................................................9

2FUNDAMENTAL AND TECHNICAL ANALYSIS
Introduction
The report titled “Fundamental and Technical Analysis” is prepared to analyse the
two listed companies of Malaysia both in terms of fundamental and technical. The selected
company for this report are Kuala Lumpur Kepong Berhad and Genting Plantations Berhad.
The both company are listed in the Bursa Malaysia that is Malaysian stock exchange for more
than 3 years. The both selected company are from the same industry called plantations. The
following is the brief about both the companies.
Genting Plantations Berhad
The Genting Plantations Berhad was founded in 1977 as a private limited company.
This started it operation in 1980 under the Genting Group. This one of the leading palm oil
plantation group of region. The company increased its land bank from 13,700 hectares to
247,400 hectares and currently operates in Malaysia and Indonesia (Gentingplantations
2019). The head office of the company is situated in the Kuala Lumpur, Malaysia.
Kuala Lumpur Kepong Berhad
Kuala Lumpur Kepong Berhad is also a conglomerate in the palm oil and
plantations industry. The company have the balance of 270,000 hectares in their land bank.
Apart from the palm oil, the company also manufacture some other product as well as
involved in the property business (Klk.com.my 2019). The company performing its oil
business more than 100 years having the head office in Kuala Lumpur, Malaysia.

3FUNDAMENTAL AND TECHNICAL ANALYSIS
Discussion
Fundamental Analysis
Fundamental analysis is type of stock evaluation method. This method considers and
analyse the financial information of the company such as financial report, demand of the
product produces by the company, company’s position in the industry and the changes occurs
in the economics and government policies. The fundamental analysis deals with the financial
performance of the company (Yan and Zheng 2017). To perform the fundamental analysis of
any company requires the detailed study of the financial report of the company to certain the
some key terms like profitability, return on investment and turnover of the firm.
Here, to perform the fundamental analysis of Kuala Lumpur Kepong Berhad and
Genting Plantations Berhad this report use the following tools of the fundamental analysis:
Earnings per share (EPS)
The earning per share are very important tool of the fundamental analysis and its
primary focus on the investors of the company. This shows the earning capacity of the
company in per share basis.
2016 2017 2018
Earing per share
0.0
20.0
40.0
60.0
80.0
100.0
120.0
140.0
160.0
Earning per Share
Kuala Lumpur Kepong Berhad Genting Plantations Berhad
The high earning per ratio is consider as good. From the above it can be said the
Kuala Lumpur Kepong Berhad is paying high dividend than the Genting Plantations Berhad.
Secure Best Marks with AI Grader
Need help grading? Try our AI Grader for instant feedback on your assignments.

4FUNDAMENTAL AND TECHNICAL ANALYSIS
The both of the company is showing the decreasing trend in the earning per share that is not
an acceptable trend. This reveals that the profitability of both the firm is decreasing.
Dividend Pay-out Ratio
Dividend pay out ratio shows the part of the profit earned by the company per share
distributed among the shareholders of the firm (Schroeder, Sjoquist and Stephan 2016). The
high pay out ratio helps the company to attract the investors and it shows the ability of
company to earn the profit.
2016 2017 2018
Dividend payout ratio
0.0
0.5
1.0
1.5
2.0
2.5
Dividend Payout Ratio
Kuala Lumpur Kepong Berhad Genting Plantations Berhad
The dividend pay out ratio is good for the company in investor point of view. In the
basis of the above chart, the Kuala Lumpur Kepong Berhad is paying more dividend to the
shareholders than the Genting Plantations Berhad (Fitri, Hosen and Muhari 2016). The trend
shown by the Kuala Lumpur is decreasing, which is not good for the company. While,, the
Genting is showing the upward trend that means either company is performing good or trying
to attract the investors.
Return in Equity

5FUNDAMENTAL AND TECHNICAL ANALYSIS
This indicates the efficiency of the company to generate the profit from the
shareholder’s equity (Chandra 2017). This is widely used tool to analyse the financial
performance of the company.
2016 2017 2018
Return on Equity
0.0
1.0
2.0
3.0
4.0
5.0
6.0
Return on Equity
Kuala Lumpur Kepong Berhad Genting Plantations Berhad
The high return on equity is not always means that the company is performing well.
The high return on equity sometimes means that the company is not acquiring asset, which is
not a good move for the growth of the company. Here, the return on equity of Kuala Lumpur
Kepong is very low comparatively to Genting Plantations that means Genting is not acquiring
the further assets (Sloan 2019). While, Kuala Lumpur Kepong is focused on acquiring the
new assets with the goal to expand the company.
Price to earnings ratio
Price to earnings ratio consider the share price and the earnings of the company.
Sometime the high price ratio refer as the overvalued stock (Mussalamah and Isa 2016).
Usually, the higher P/E ratio means stock has the higher growth rate.

6FUNDAMENTAL AND TECHNICAL ANALYSIS
2016 2017 2018
Price to earning ratio
0.0
10.0
20.0
30.0
40.0
50.0
60.0
Price to earning ratio
Kuala Lumpur Kepong Berhad Genting Plantations Berhad
As per the above chart, the Genting Plantations have higher P/E ratio than the Kuala
Lumpur Kepong that means Genting Plantations is expected the high growth than the Kuala
Lumpur Kepong (Sharif, Purohit and Pillai 2015). The both of the company showing
increasing trends in the P/E ratio, which is the good sign for both the company.
Technical Analysis
The technical analysis is a method of analysing the performance of the stock in the
stock market. The investors to ascertain the performance of the stock mainly use this method.
The main use of this analysis is relates with the day trading. This is the method of forecasting
the direction of the stock price in the basis of the past market price and the volume of the
share (Edwards, Magee and Bassetti 2018). The following tools are used to perform the
technical analysis of the Kuala Lumpur Kepong Berhad and Genting Plantations Berhad.
Moving Average
This shows the movement of the share price in the graphical way. It helps to
determine the when to buy or sell the stocks. If the price of the stock moves above the
moving average line then it is time to buy the share and vice versa.
Paraphrase This Document
Need a fresh take? Get an instant paraphrase of this document with our AI Paraphraser

7FUNDAMENTAL AND TECHNICAL ANALYSIS
Here, the both company is showing the upward trend up to April 2017 and then
decline. The share prices of both company is also above the moving average line, which is
good for both the companies. In the starting of the 2018, Kuala Lumpur Kepong shows the
growth in the share price also crossed the moving average line. While, Genting Plantation is
remained downward.
Relative Strength Index (RSI)
This indicates the current and historical strength or weakness of a stock based on the
recent closing price. The buying decision in the basis of the upward trend in the RSI is not
always profitability.

8FUNDAMENTAL AND TECHNICAL ANALYSIS
Here, the both company shows flat trend line, means the stock of company is neither
oversold nor the overbought.
Moving Average Convergence Divergence (MACD)
This tool help to identifying the moving average of new trends that revels the whether
the movement of stock has bullish or bearish trend.
The movement of the MACD of both the company is more or less same. The both
company shows the mix trend in the last three years but manage to be above in the average
trend line.
Conclusion
This report concludes that the Kuala Lumpur Kepong Berhad and Genting Plantation
Berhad both are the listed company of Bursa Malaysia and from the same industry. The both
are competitors of each other. The fundament and technical analysis of both the company
revels that Kuala Lumpur Kepong Berhad is performing well than the Genting Plantation
Berhad is every aspect of the performance. This report also forecast that there is the
opportunity for the Genting Plantation Berhad to grow further in the near future.

9FUNDAMENTAL AND TECHNICAL ANALYSIS
References
Chandra, P., 2017. Investment analysis and portfolio management. McGraw-Hill Education.
Edwards, R.D., Magee, J. and Bassetti, W.C., 2018. Technical analysis of stock trends. CRC
press.
Fitri, R.R., Hosen, M.N. and Muhari, S., 2016. Analysis of factors that impact dividend
payout ratio on listed companies at Jakarta islamic index. International Journal of Academic
Research in Accounting, Finance and Management Sciences, 6(2), pp.87-97.
Gentingplantations 2019. Corporate Profile. [online] Gentingplantations.com. Available at:
http://www.gentingplantations.com/corporate_profile/ [Accessed 24 Apr. 2019].
Klk.com.my 2019. Overview – Kuala Lumpur Kepong Berhad | KLK Malaysia. [online]
Klk.com.my. Available at: https://www.klk.com.my/company-profile/ [Accessed 24 Apr.
2019].
Mussalamah, A.D.M. and Isa, M., 2016. Pengaruh earning per share (EPS), debt to equity
ratio (DER) dan return on equity (ROE) terhadap harga saham (Studi empiris pada
perusahaan manufaktur yang terdaftar di bursa efek Indonesia tahun 2007-2011). Benefit:
Jurnal Manajemen dan Bisnis, 19(2), pp.189-195.
Schroeder, L.D., Sjoquist, D.L. and Stephan, P.E., 2016. Understanding regression analysis:
An introductory guide (Vol. 57). Sage Publications.
Sharif, T., Purohit, H. and Pillai, R., 2015. Analysis of factors affecting share prices: The case
of Bahrain stock exchange. International Journal of Economics and Finance, 7(3), pp.207-
216.
Sloan, R.G., 2019. Fundamental analysis redux. The Accounting Review, 94(2), pp.363-377.
Secure Best Marks with AI Grader
Need help grading? Try our AI Grader for instant feedback on your assignments.

10FUNDAMENTAL AND TECHNICAL ANALYSIS
Yan, X. and Zheng, L., 2017. Fundamental analysis and the cross-section of stock returns: A
data-mining approach. The Review of Financial Studies, 30(4), pp.1382-1423.
Yan, X. and Zheng, L., 2017. Fundamental analysis and the cross-section of stock returns: A
data-mining approach. The Review of Financial Studies, 30(4), pp.1382-1423.
1 out of 11
Related Documents

Your All-in-One AI-Powered Toolkit for Academic Success.
+13062052269
info@desklib.com
Available 24*7 on WhatsApp / Email
Unlock your academic potential
© 2024 | Zucol Services PVT LTD | All rights reserved.