Accounting Fundamentals: Financial Statement and Ratio Analysis Report

Verified

Added on  2023/06/18

|17
|2825
|153
Report
AI Summary
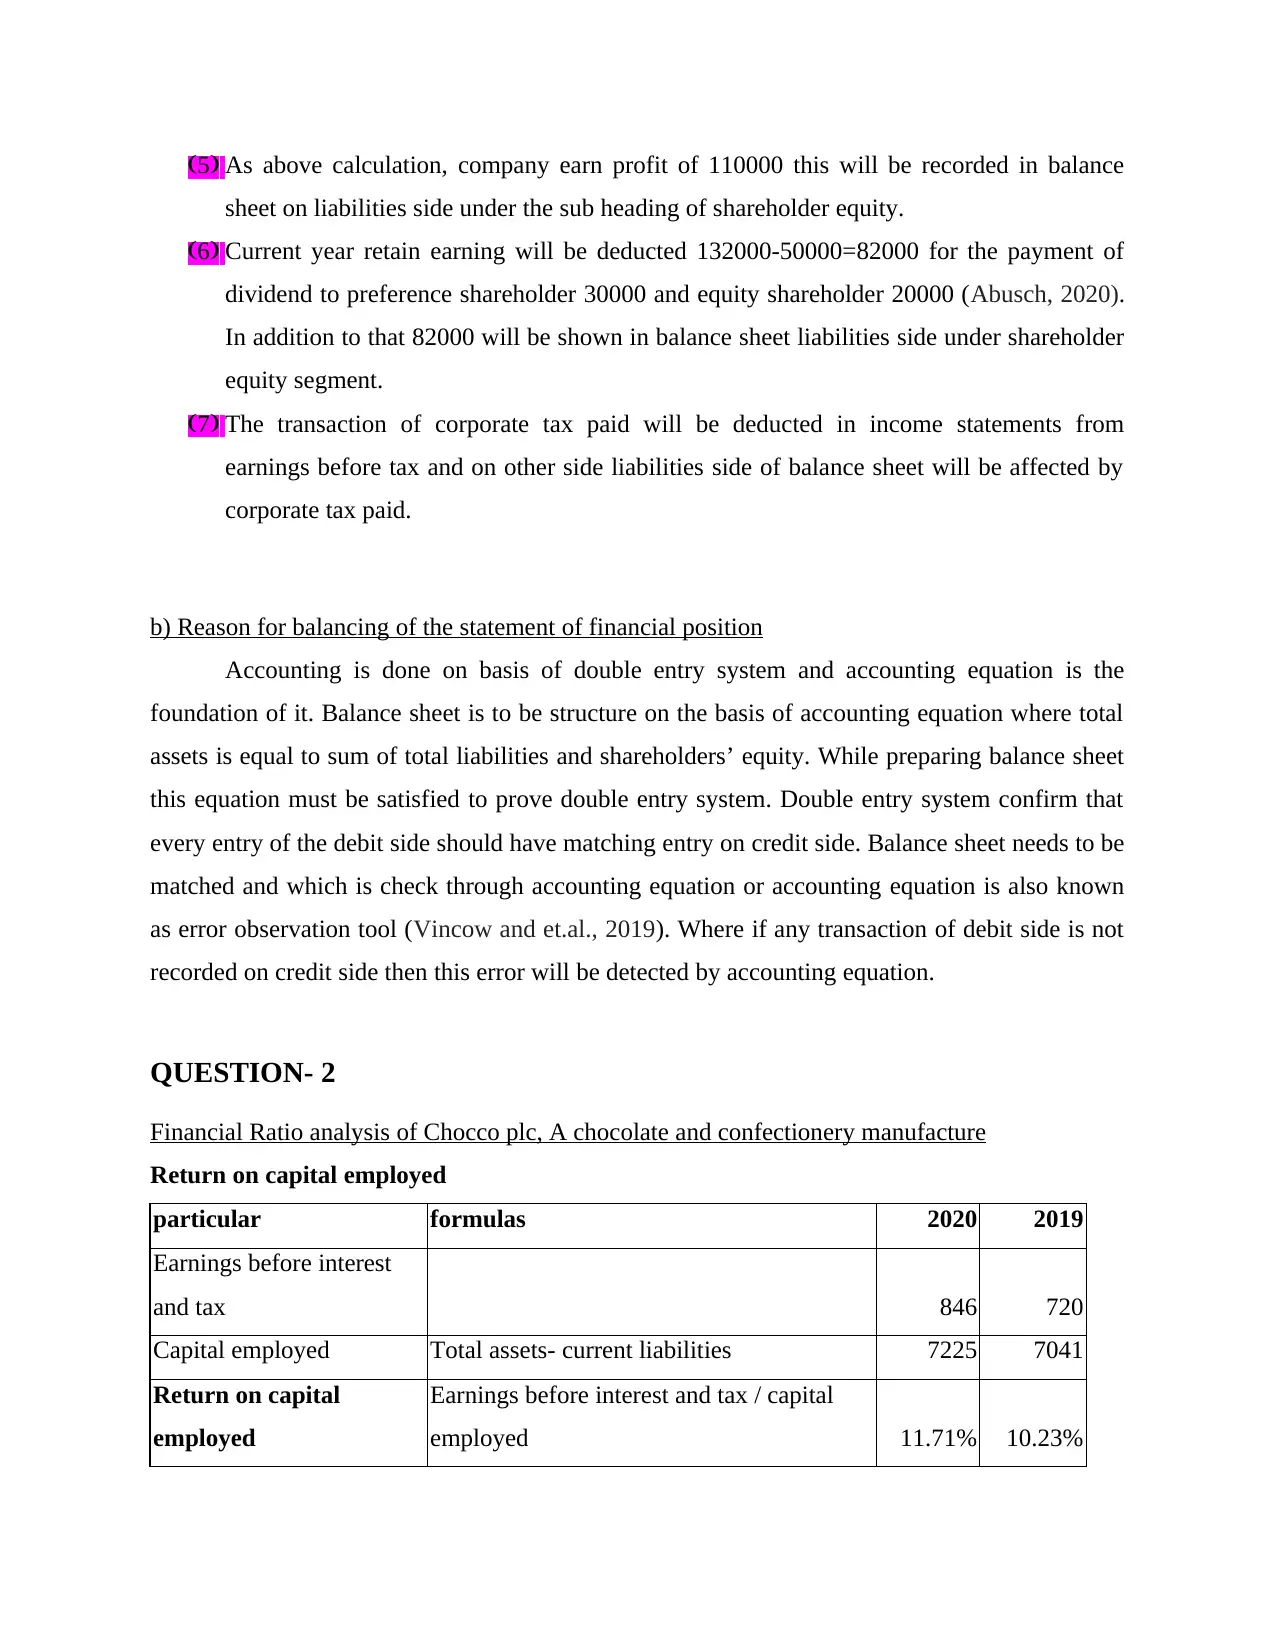
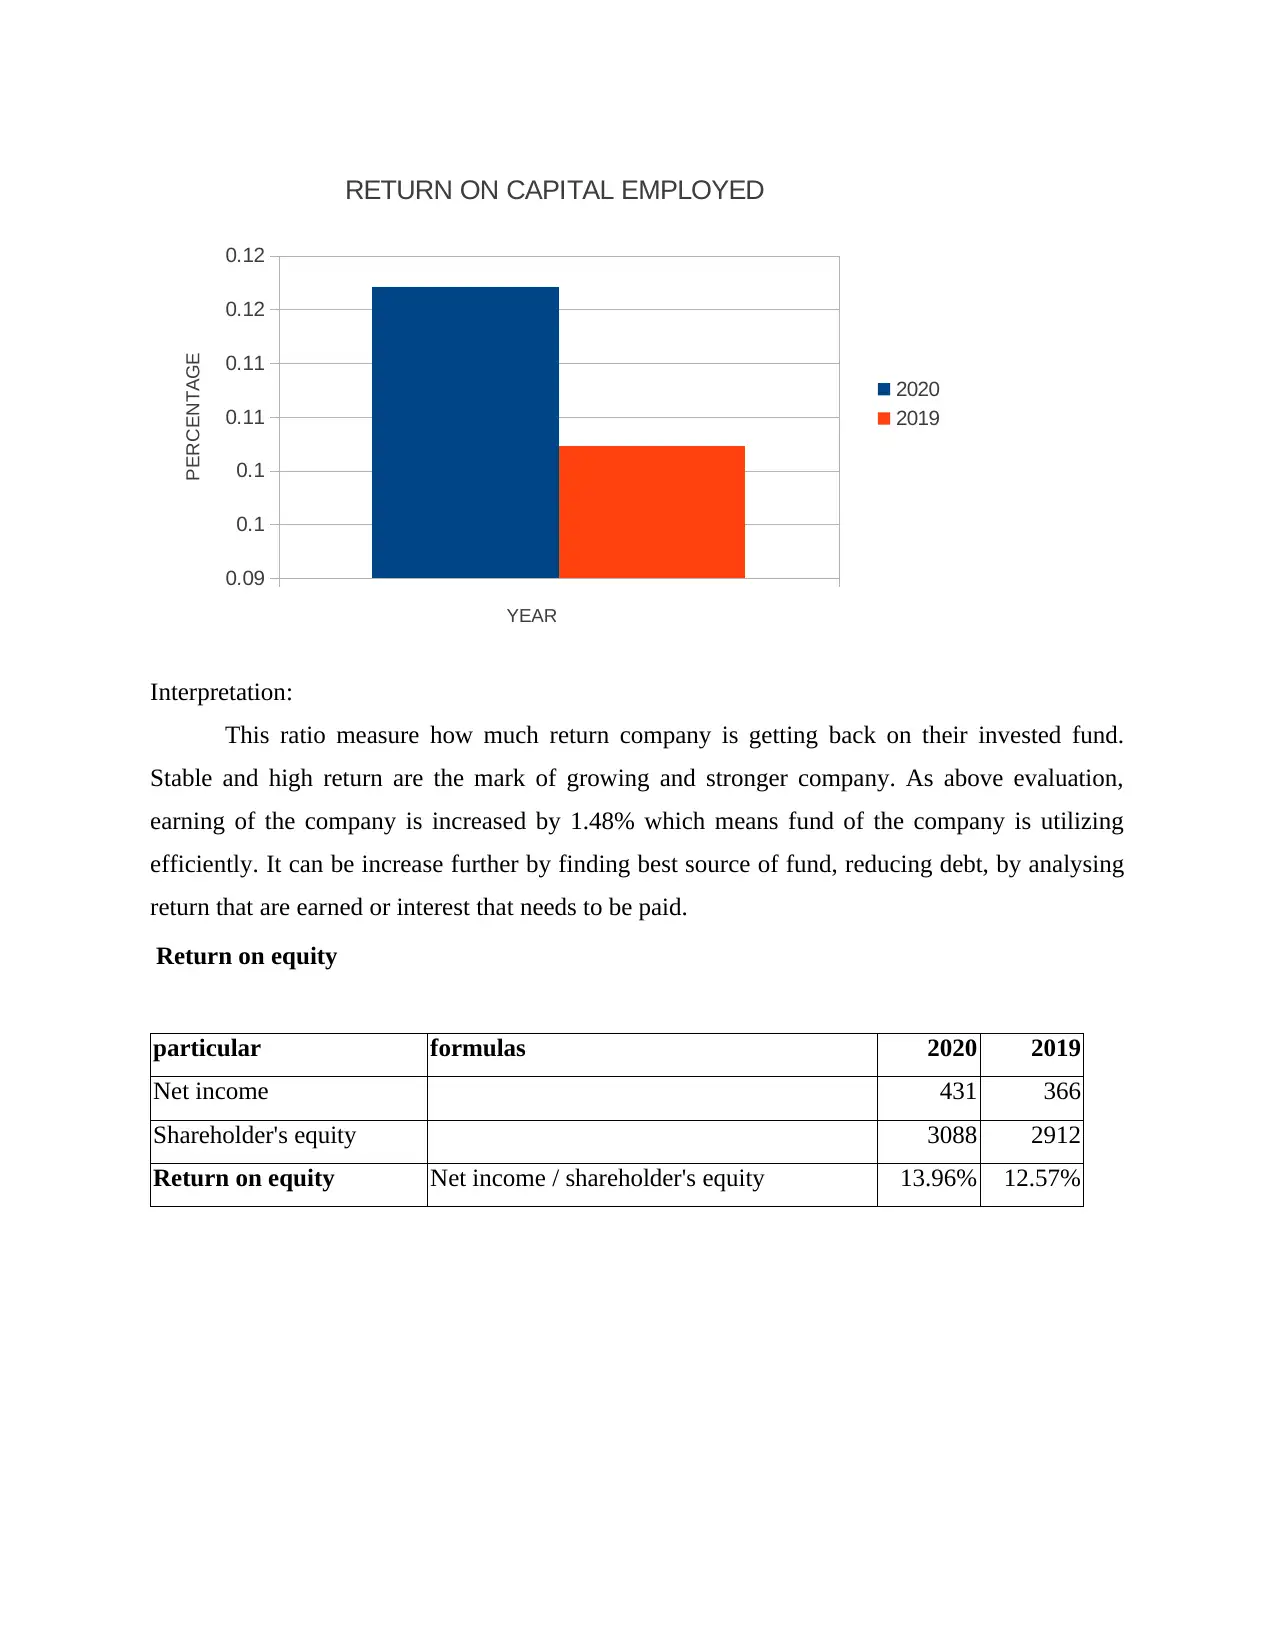
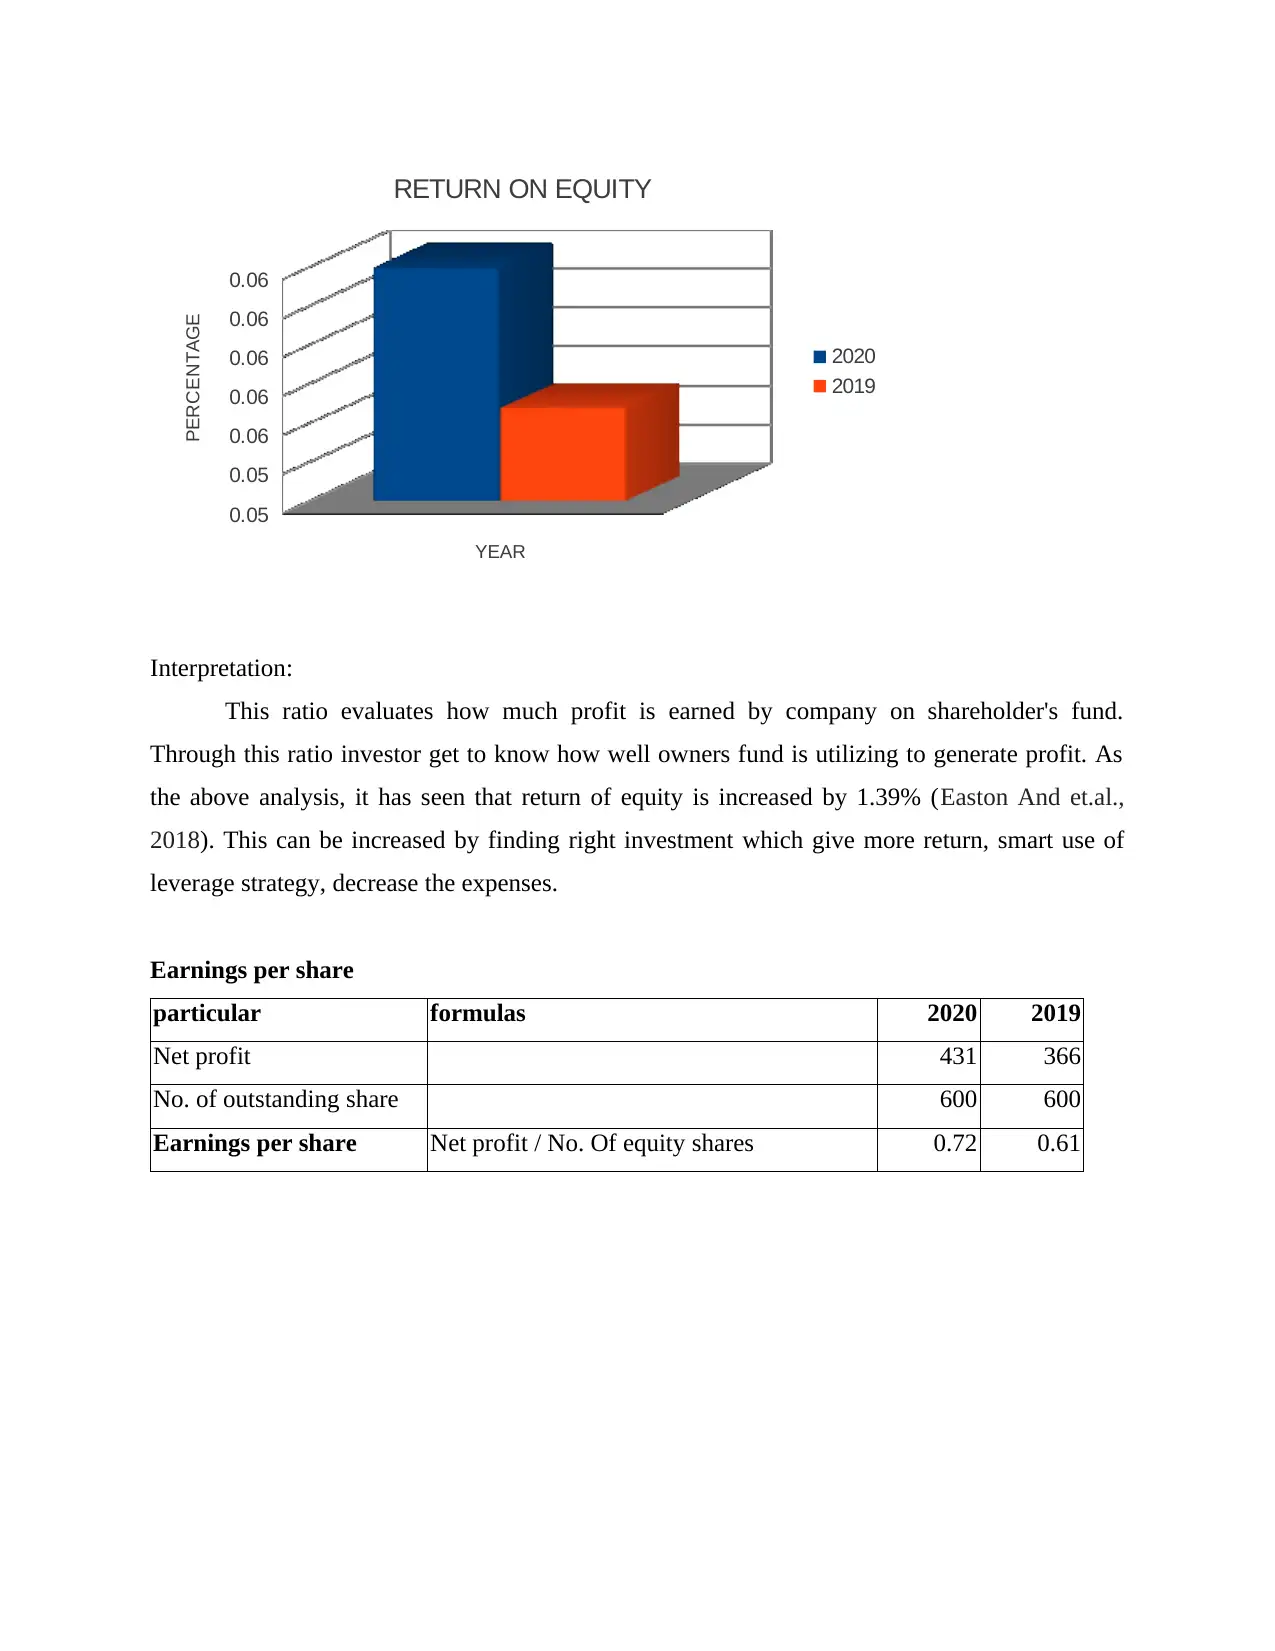
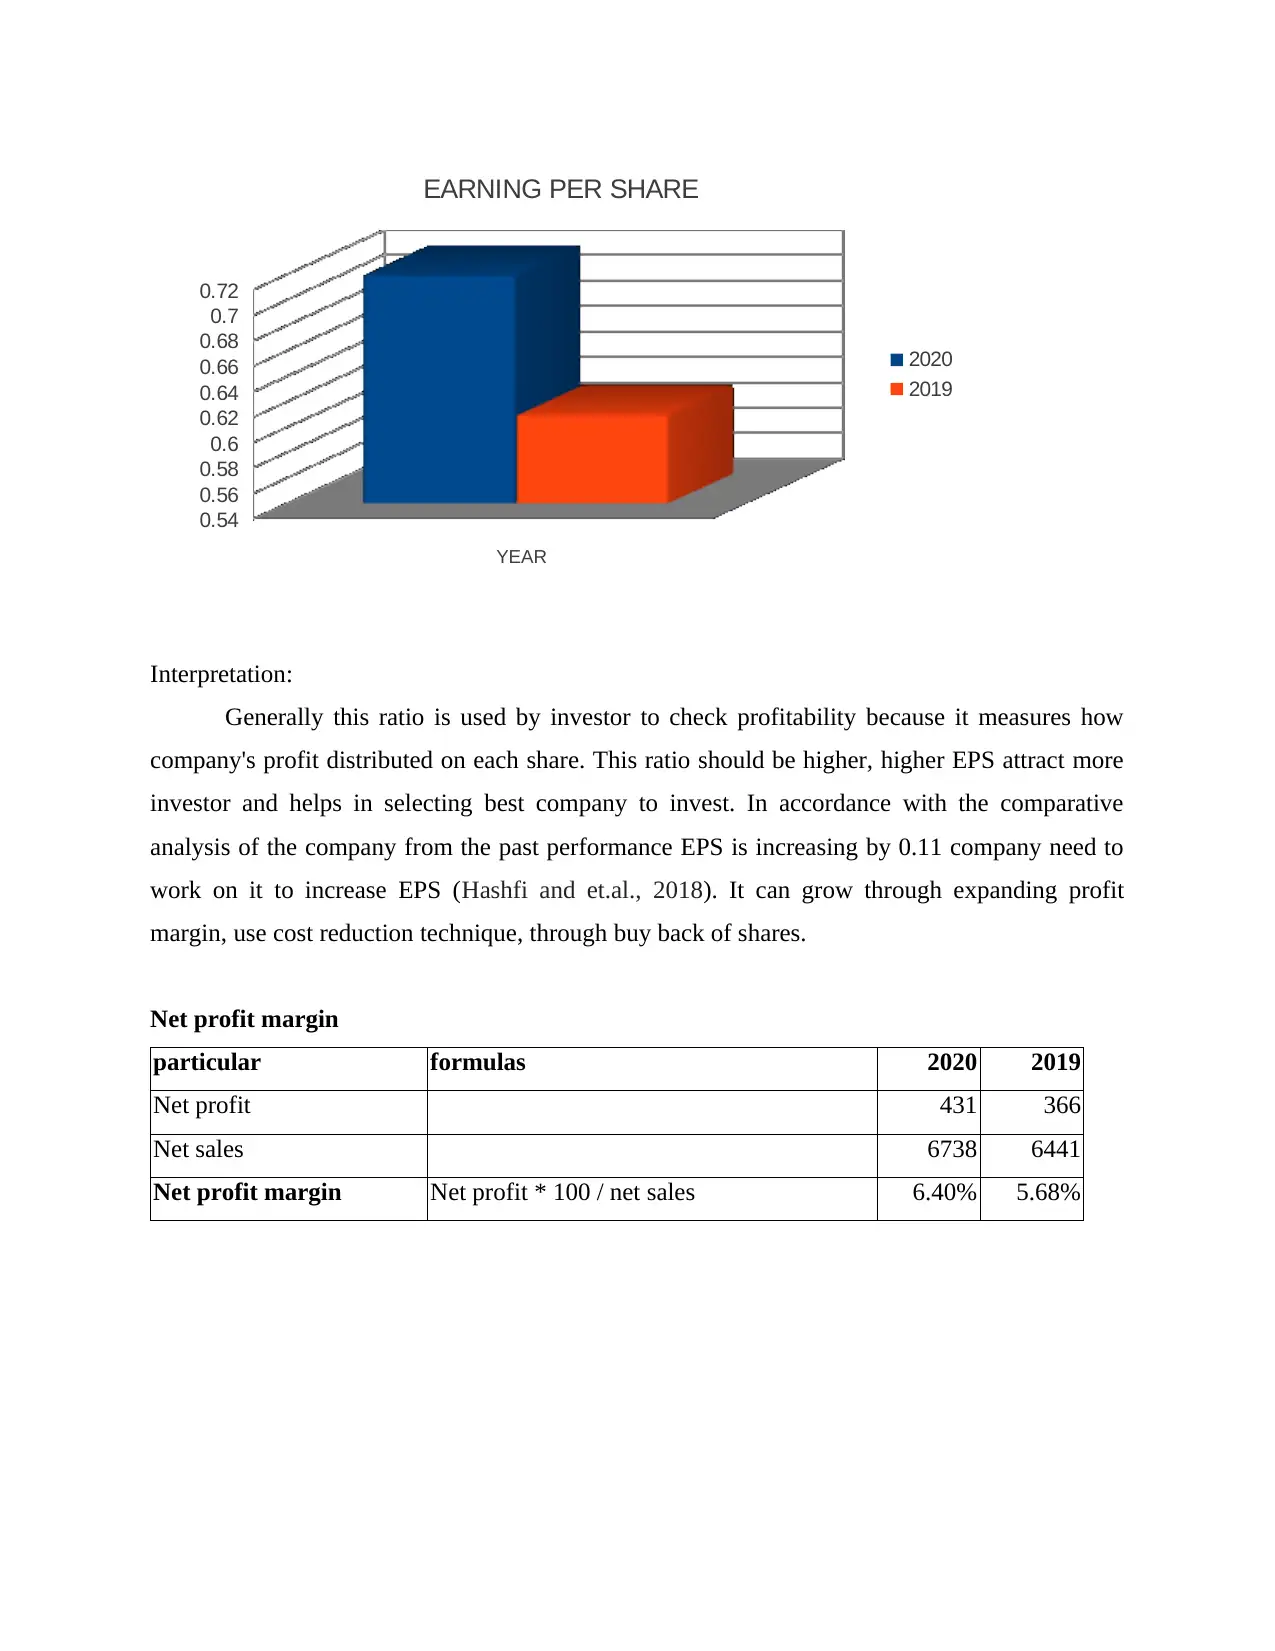
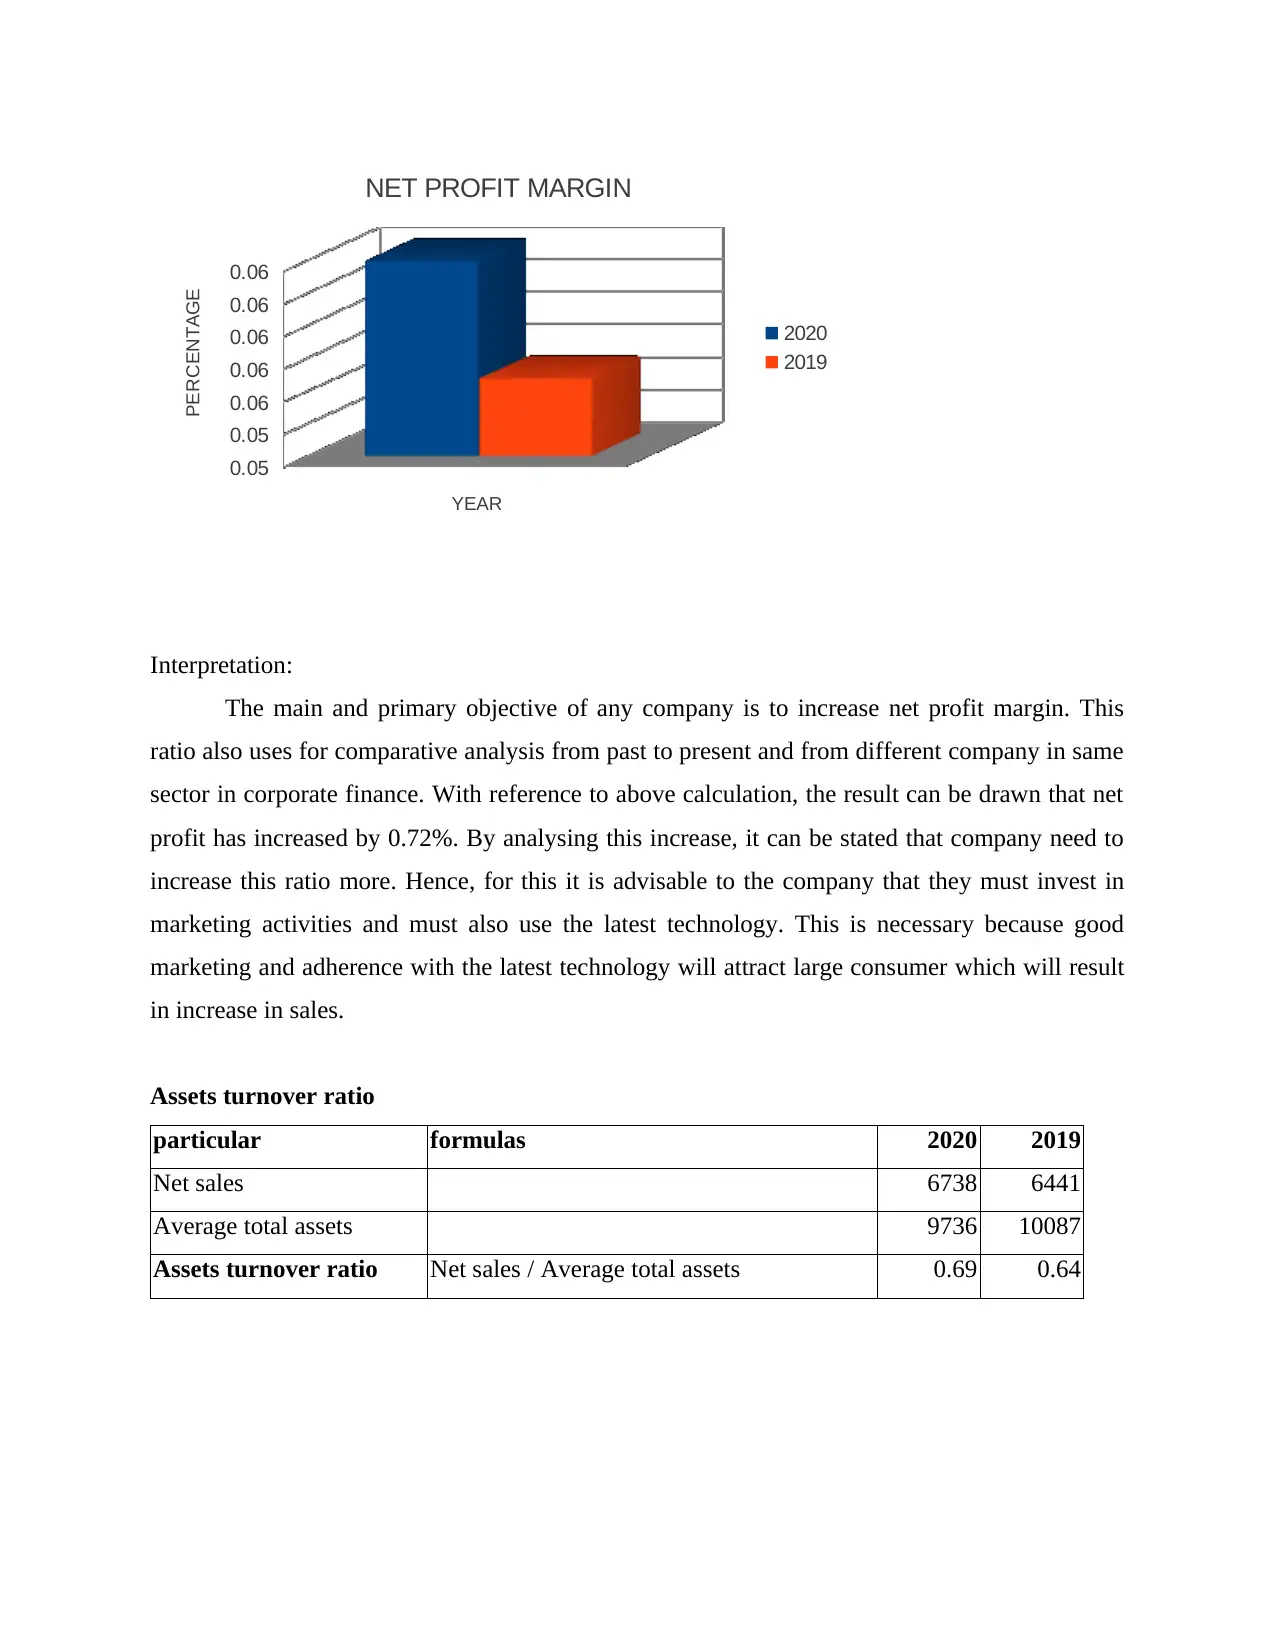
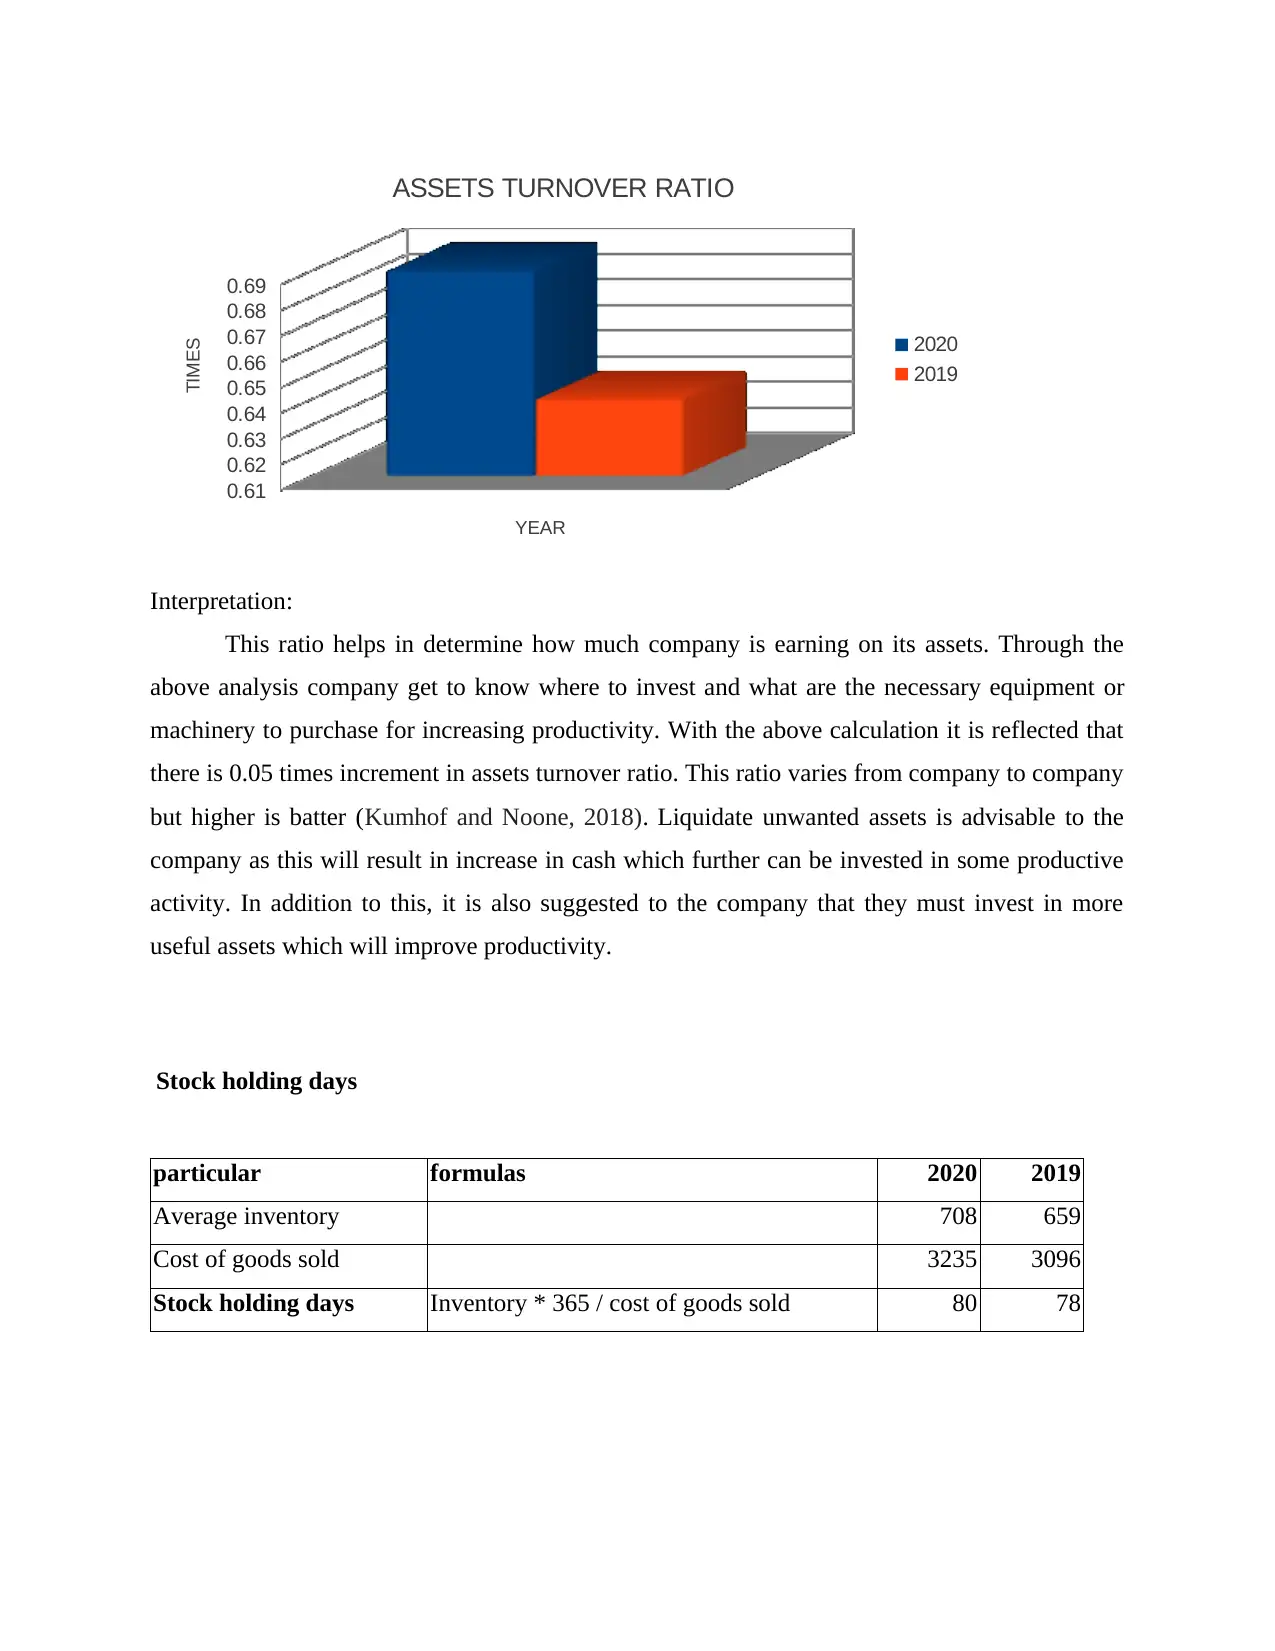
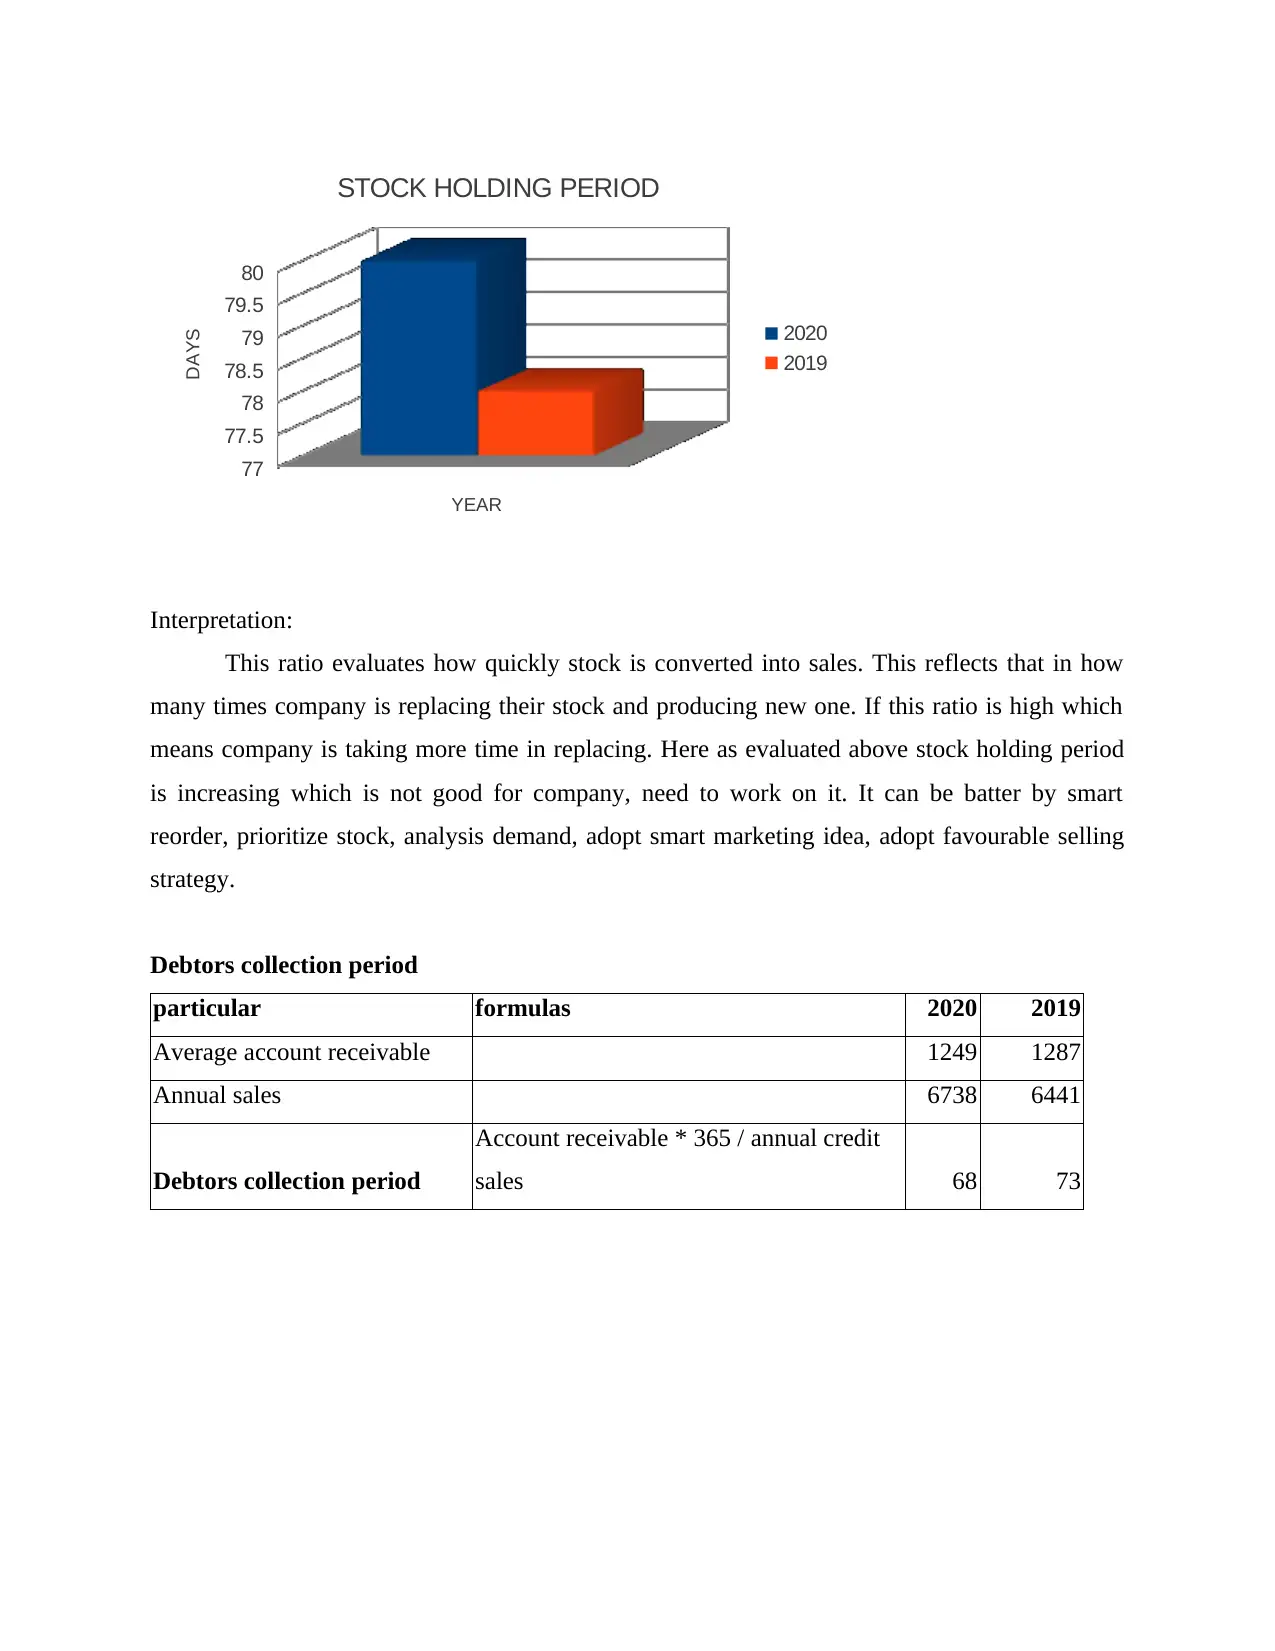
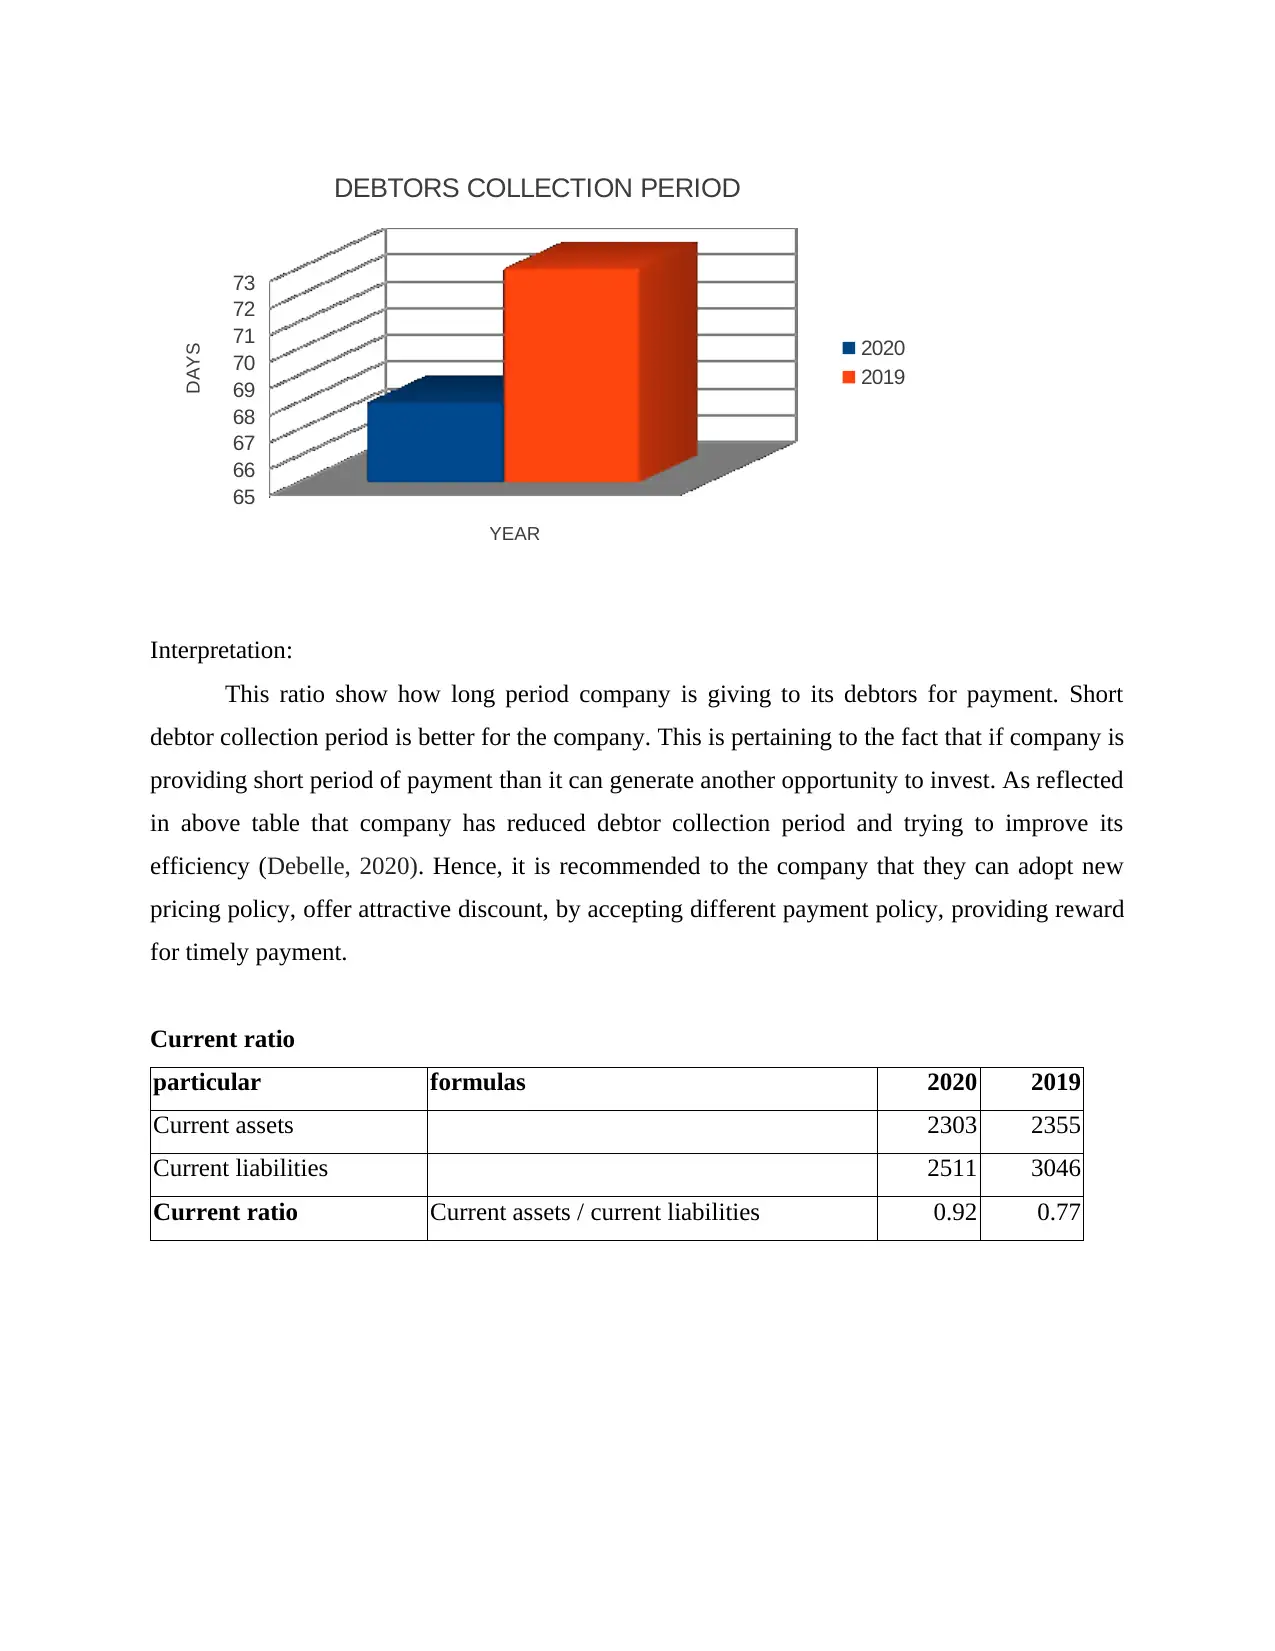
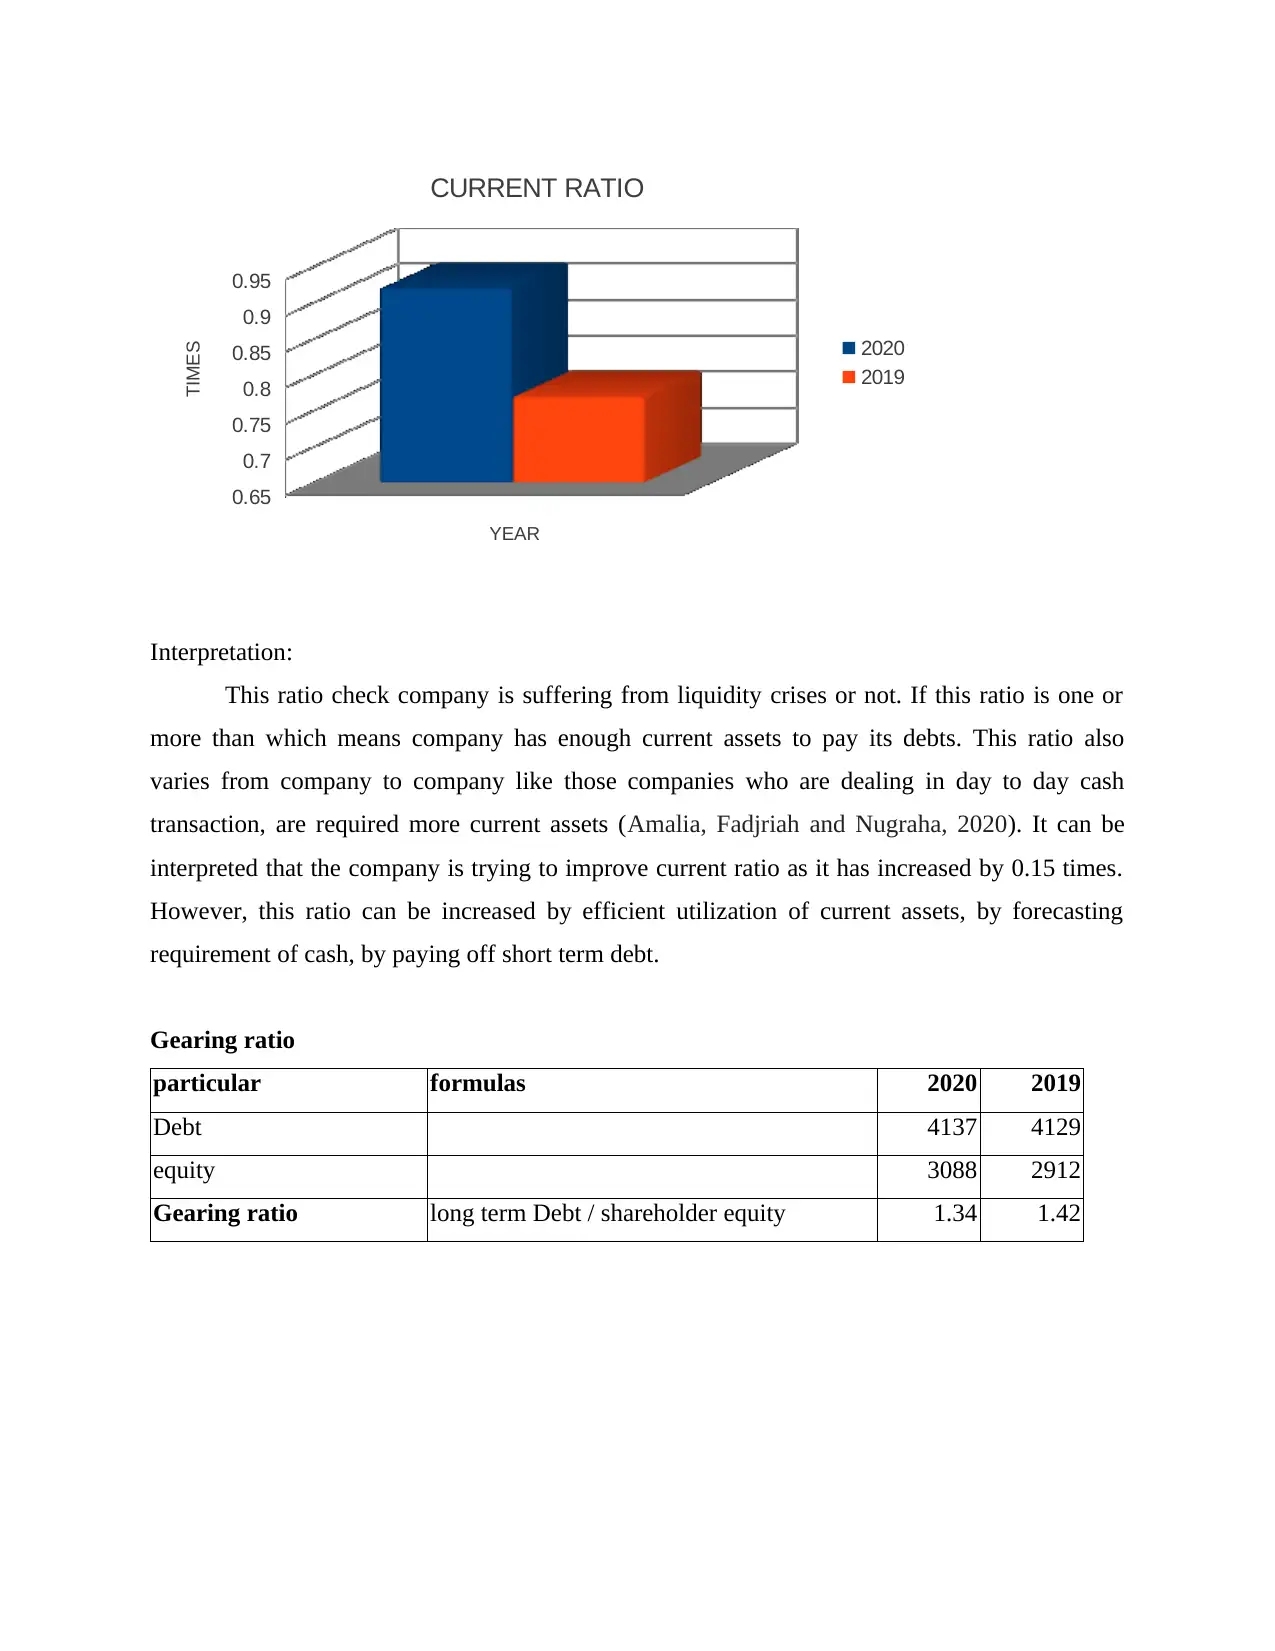
This report provides a detailed analysis of accounting fundamentals, focusing on the preparation and interpretation of financial statements. It includes an examination of Kedison PLC's financial statements, highlighting key adjustments and their impact on the balance sheet and income statement. The report further delves into financial ratio analysis of Chocco PLC, a chocolate and confectionery manufacturer, evaluating various ratios such as Return on Capital Employed, Return on Equity, Earnings per Share, Net Profit Margin, Assets Turnover Ratio, Stock Holding Days, Debtors Collection Period, Current Ratio, Gearing Ratio, and Inventory Turnover Ratio. Each ratio is calculated for the years 2020 and 2019, providing comparative insights into the company's performance and efficiency. The analysis aims to provide a comprehensive understanding of the company's financial health and operational effectiveness, with recommendations for improvement in areas such as inventory management, debt utilization, and profitability enhancement.
Document Page
ACCOUNTING
FUNDAMENTALS
tabler-icon-diamond-filled.svg

Paraphrase This Document

Need a fresh take? Get an instant paraphrase of this document with our AI Paraphraser
Document Page
TABLE OF CONTENTS
INTRODUCTION...........................................................................................................................3
MAIN BODY...................................................................................................................................3
QUESTION- 1.................................................................................................................................3
a) Financial statements of Kedison PLC.....................................................................................3
b) Reason for balancing of the statement of financial position...................................................4
QUESTION- 2.................................................................................................................................4
Financial Ratio analysis of Chocco plc, A chocolate and confectionery manufacture...............4
CONCLUSION..............................................................................................................................14
REFERENCES..............................................................................................................................15
APPENDIX....................................................................................................................................16
Document Page
INTRODUCTION
Accounting is an art of recording transaction in journal, classify into ledger, summarize
in terms of trail balance and further analysis and interpret through final statements then
communicate to investor, management, usable people. Accounting fundamentals are used for
preparing final accounts which include income statements i.e. also called profit and loss account,
balance sheet and cash flow statement. This report will include Income statements, that will
highlight profit and loss of company during the period and financial position can be identified
through balance sheet. Further this report will go ahead with financial ratios, that will help in
deep analysis of micro factors of the company (Jin, Pei and Tsukuda, 2019). This financial
statements use by company to get information about liquidity, efficient utilization of assets, uses
of fund etc.
MAIN BODY
QUESTION- 1
a) Financial statements of Kedison PLC
Enclosed in Appendix
Working note:
(1) Interest is to be paid on 100000 debentures that is 100000×4%=4000. Out of this 4000,
2000 is paid but remaining 2000 will be recorded as interest paid in expenses side of
income statement and on other side this 2000 will be recorded as outstanding liability on
liabilities side of balance sheet.
(2) Sales commission which belong to current year is to be paid to sales man in January. This
transaction will be adjusted by showing in income statement as an expense (Zargar and
et.al., 2017). In addition to this, transaction will be show in balance sheet as outstanding
commission.
(3) Dividend is income of shareholders which is not shown in income statements while
computing profit.
(4) Goods that had been provided to the customer on credit basis as on 31st December 2020,
are not recorded in books of accounts. This transaction will be shown by reducing
inventory from 980 and on other side debtors will be up by 980 because payment will be
received by next year.
Document Page
(5) As above calculation, company earn profit of 110000 this will be recorded in balance
sheet on liabilities side under the sub heading of shareholder equity.
(6) Current year retain earning will be deducted 132000-50000=82000 for the payment of
dividend to preference shareholder 30000 and equity shareholder 20000 (Abusch, 2020).
In addition to that 82000 will be shown in balance sheet liabilities side under shareholder
equity segment.
(7) The transaction of corporate tax paid will be deducted in income statements from
earnings before tax and on other side liabilities side of balance sheet will be affected by
corporate tax paid.
b) Reason for balancing of the statement of financial position
Accounting is done on basis of double entry system and accounting equation is the
foundation of it. Balance sheet is to be structure on the basis of accounting equation where total
assets is equal to sum of total liabilities and shareholders’ equity. While preparing balance sheet
this equation must be satisfied to prove double entry system. Double entry system confirm that
every entry of the debit side should have matching entry on credit side. Balance sheet needs to be
matched and which is check through accounting equation or accounting equation is also known
as error observation tool (Vincow and et.al., 2019). Where if any transaction of debit side is not
recorded on credit side then this error will be detected by accounting equation.
QUESTION- 2
Financial Ratio analysis of Chocco plc, A chocolate and confectionery manufacture
Return on capital employed
particular formulas 2020 2019
Earnings before interest
and tax 846 720
Capital employed Total assets- current liabilities 7225 7041
Return on capital
employed
Earnings before interest and tax / capital
employed 11.71% 10.23%
tabler-icon-diamond-filled.svg

Paraphrase This Document

Need a fresh take? Get an instant paraphrase of this document with our AI Paraphraser
Document Page
0.09
0.1
0.1
0.11
0.11
0.12
0.12
RETURN ON CAPITAL EMPLOYED
2020
2019
YEAR
PERCENTAGE
Interpretation:
This ratio measure how much return company is getting back on their invested fund.
Stable and high return are the mark of growing and stronger company. As above evaluation,
earning of the company is increased by 1.48% which means fund of the company is utilizing
efficiently. It can be increase further by finding best source of fund, reducing debt, by analysing
return that are earned or interest that needs to be paid.
Return on equity
particular formulas 2020 2019
Net income 431 366
Shareholder's equity 3088 2912
Return on equity Net income / shareholder's equity 13.96% 12.57%
Document Page
0.05
0.05
0.06
0.06
0.06
0.06
0.06
RETURN ON EQUITY
2020
2019
YEAR
PERCENTAGE
Interpretation:
This ratio evaluates how much profit is earned by company on shareholder's fund.
Through this ratio investor get to know how well owners fund is utilizing to generate profit. As
the above analysis, it has seen that return of equity is increased by 1.39% (Easton And et.al.,
2018). This can be increased by finding right investment which give more return, smart use of
leverage strategy, decrease the expenses.
Earnings per share
particular formulas 2020 2019
Net profit 431 366
No. of outstanding share 600 600
Earnings per share Net profit / No. Of equity shares 0.72 0.61
Document Page
0.54
0.56
0.58
0.6
0.62
0.64
0.66
0.68
0.7
0.72
EARNING PER SHARE
2020
2019
YEAR
Interpretation:
Generally this ratio is used by investor to check profitability because it measures how
company's profit distributed on each share. This ratio should be higher, higher EPS attract more
investor and helps in selecting best company to invest. In accordance with the comparative
analysis of the company from the past performance EPS is increasing by 0.11 company need to
work on it to increase EPS (Hashfi and et.al., 2018). It can grow through expanding profit
margin, use cost reduction technique, through buy back of shares.
Net profit margin
particular formulas 2020 2019
Net profit 431 366
Net sales 6738 6441
Net profit margin Net profit * 100 / net sales 6.40% 5.68%
tabler-icon-diamond-filled.svg

Paraphrase This Document

Need a fresh take? Get an instant paraphrase of this document with our AI Paraphraser
Document Page
0.05
0.05
0.06
0.06
0.06
0.06
0.06
NET PROFIT MARGIN
2020
2019
YEAR
PERCENTAGE
Interpretation:
The main and primary objective of any company is to increase net profit margin. This
ratio also uses for comparative analysis from past to present and from different company in same
sector in corporate finance. With reference to above calculation, the result can be drawn that net
profit has increased by 0.72%. By analysing this increase, it can be stated that company need to
increase this ratio more. Hence, for this it is advisable to the company that they must invest in
marketing activities and must also use the latest technology. This is necessary because good
marketing and adherence with the latest technology will attract large consumer which will result
in increase in sales.
Assets turnover ratio
particular formulas 2020 2019
Net sales 6738 6441
Average total assets 9736 10087
Assets turnover ratio Net sales / Average total assets 0.69 0.64
Document Page
0.61
0.62
0.63
0.64
0.65
0.66
0.67
0.68
0.69
ASSETS TURNOVER RATIO
2020
2019
YEAR
TIMES
Interpretation:
This ratio helps in determine how much company is earning on its assets. Through the
above analysis company get to know where to invest and what are the necessary equipment or
machinery to purchase for increasing productivity. With the above calculation it is reflected that
there is 0.05 times increment in assets turnover ratio. This ratio varies from company to company
but higher is batter (Kumhof and Noone, 2018). Liquidate unwanted assets is advisable to the
company as this will result in increase in cash which further can be invested in some productive
activity. In addition to this, it is also suggested to the company that they must invest in more
useful assets which will improve productivity.
Stock holding days
particular formulas 2020 2019
Average inventory 708 659
Cost of goods sold 3235 3096
Stock holding days Inventory * 365 / cost of goods sold 80 78
Document Page
77
77.5
78
78.5
79
79.5
80
STOCK HOLDING PERIOD
2020
2019
YEAR
DAYS
Interpretation:
This ratio evaluates how quickly stock is converted into sales. This reflects that in how
many times company is replacing their stock and producing new one. If this ratio is high which
means company is taking more time in replacing. Here as evaluated above stock holding period
is increasing which is not good for company, need to work on it. It can be batter by smart
reorder, prioritize stock, analysis demand, adopt smart marketing idea, adopt favourable selling
strategy.
Debtors collection period
particular formulas 2020 2019
Average account receivable 1249 1287
Annual sales 6738 6441
Debtors collection period
Account receivable * 365 / annual credit
sales 68 73
tabler-icon-diamond-filled.svg

Paraphrase This Document

Need a fresh take? Get an instant paraphrase of this document with our AI Paraphraser
Document Page
65
66
67
68
69
70
71
72
73
DEBTORS COLLECTION PERIOD
2020
2019
YEAR
DAYS
Interpretation:
This ratio show how long period company is giving to its debtors for payment. Short
debtor collection period is better for the company. This is pertaining to the fact that if company is
providing short period of payment than it can generate another opportunity to invest. As reflected
in above table that company has reduced debtor collection period and trying to improve its
efficiency (Debelle, 2020). Hence, it is recommended to the company that they can adopt new
pricing policy, offer attractive discount, by accepting different payment policy, providing reward
for timely payment.
Current ratio
particular formulas 2020 2019
Current assets 2303 2355
Current liabilities 2511 3046
Current ratio Current assets / current liabilities 0.92 0.77
Document Page
0.65
0.7
0.75
0.8
0.85
0.9
0.95
CURRENT RATIO
2020
2019
YEAR
TIMES
Interpretation:
This ratio check company is suffering from liquidity crises or not. If this ratio is one or
more than which means company has enough current assets to pay its debts. This ratio also
varies from company to company like those companies who are dealing in day to day cash
transaction, are required more current assets (Amalia, Fadjriah and Nugraha, 2020). It can be
interpreted that the company is trying to improve current ratio as it has increased by 0.15 times.
However, this ratio can be increased by efficient utilization of current assets, by forecasting
requirement of cash, by paying off short term debt.
Gearing ratio
particular formulas 2020 2019
Debt 4137 4129
equity 3088 2912
Gearing ratio long term Debt / shareholder equity 1.34 1.42
chevron_up_icon
1 out of 17
circle_padding
hide_on_mobile
zoom_out_icon
[object Object]