ACC102 Assignment: Financial Accounting for Depreciation and Inventory
VerifiedAdded on 2023/06/04
|10
|1204
|103
Homework Assignment
AI Summary
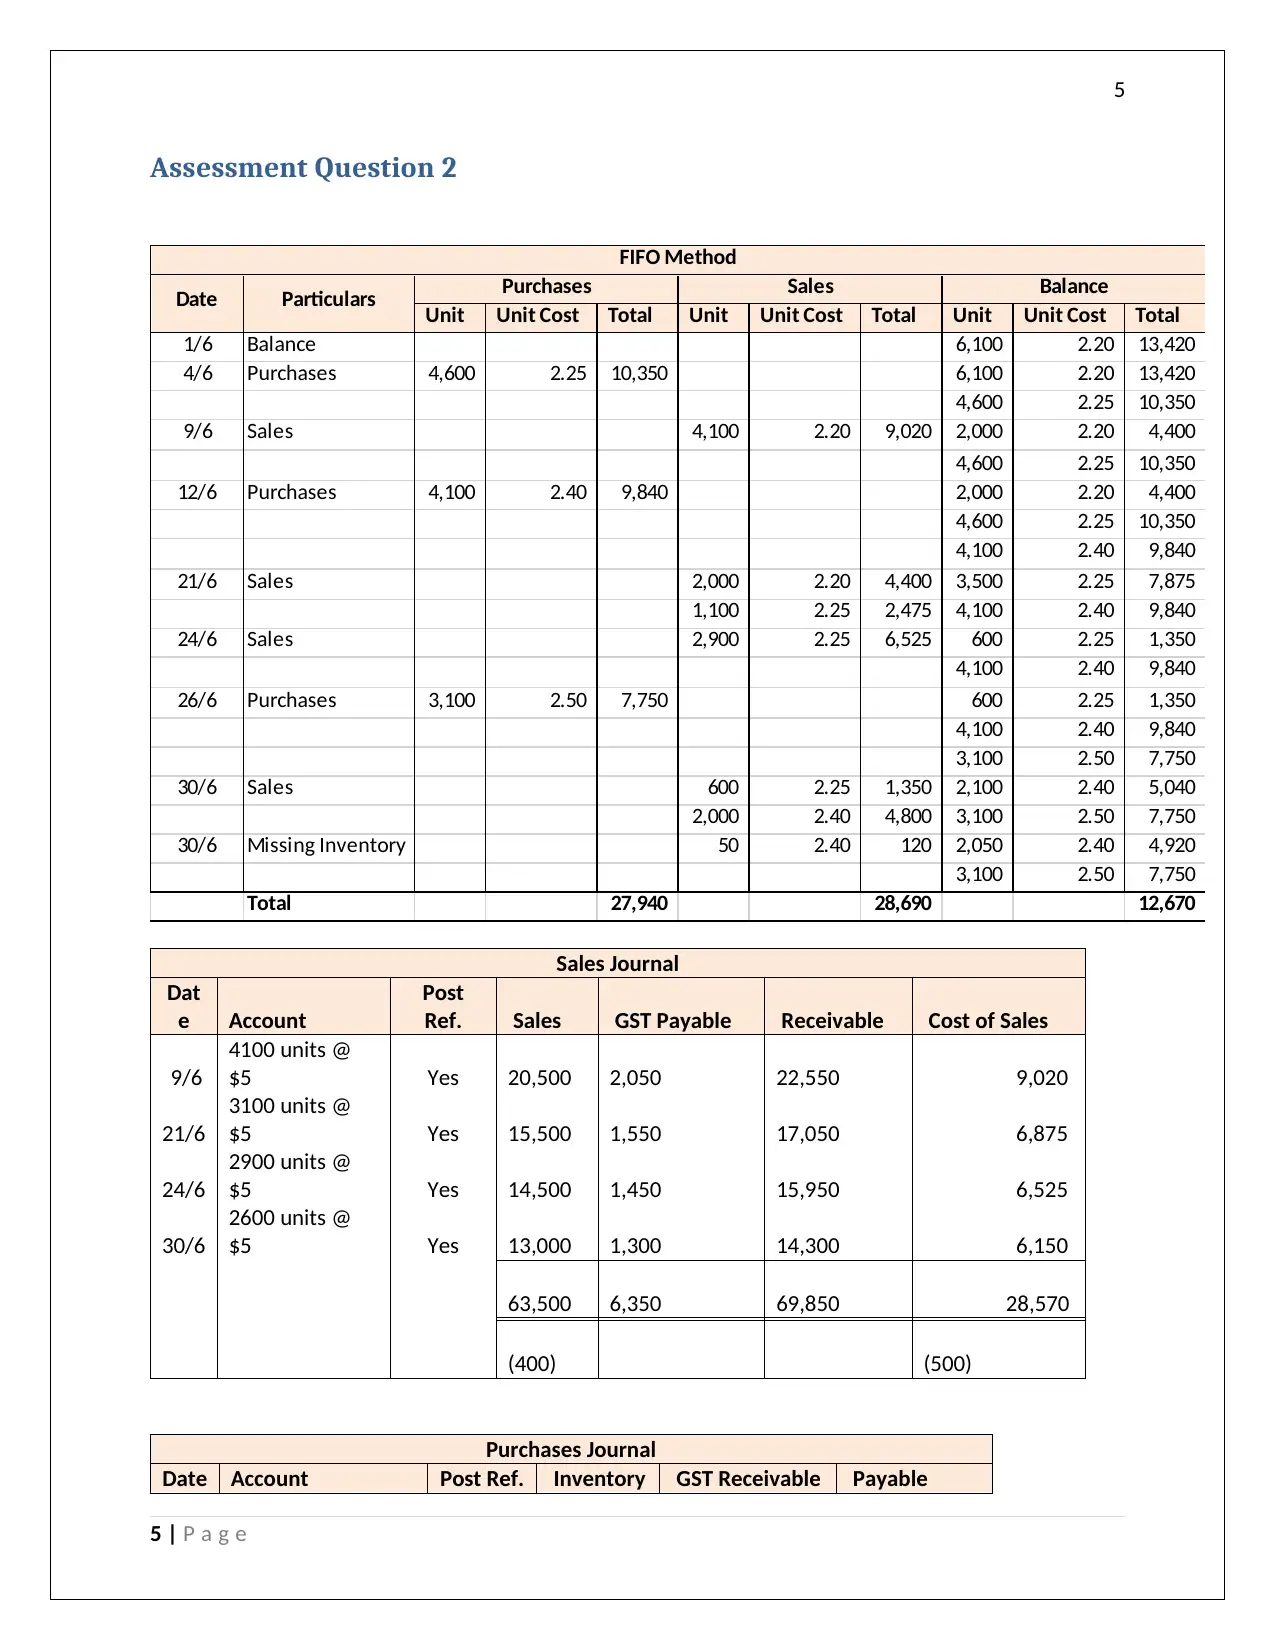
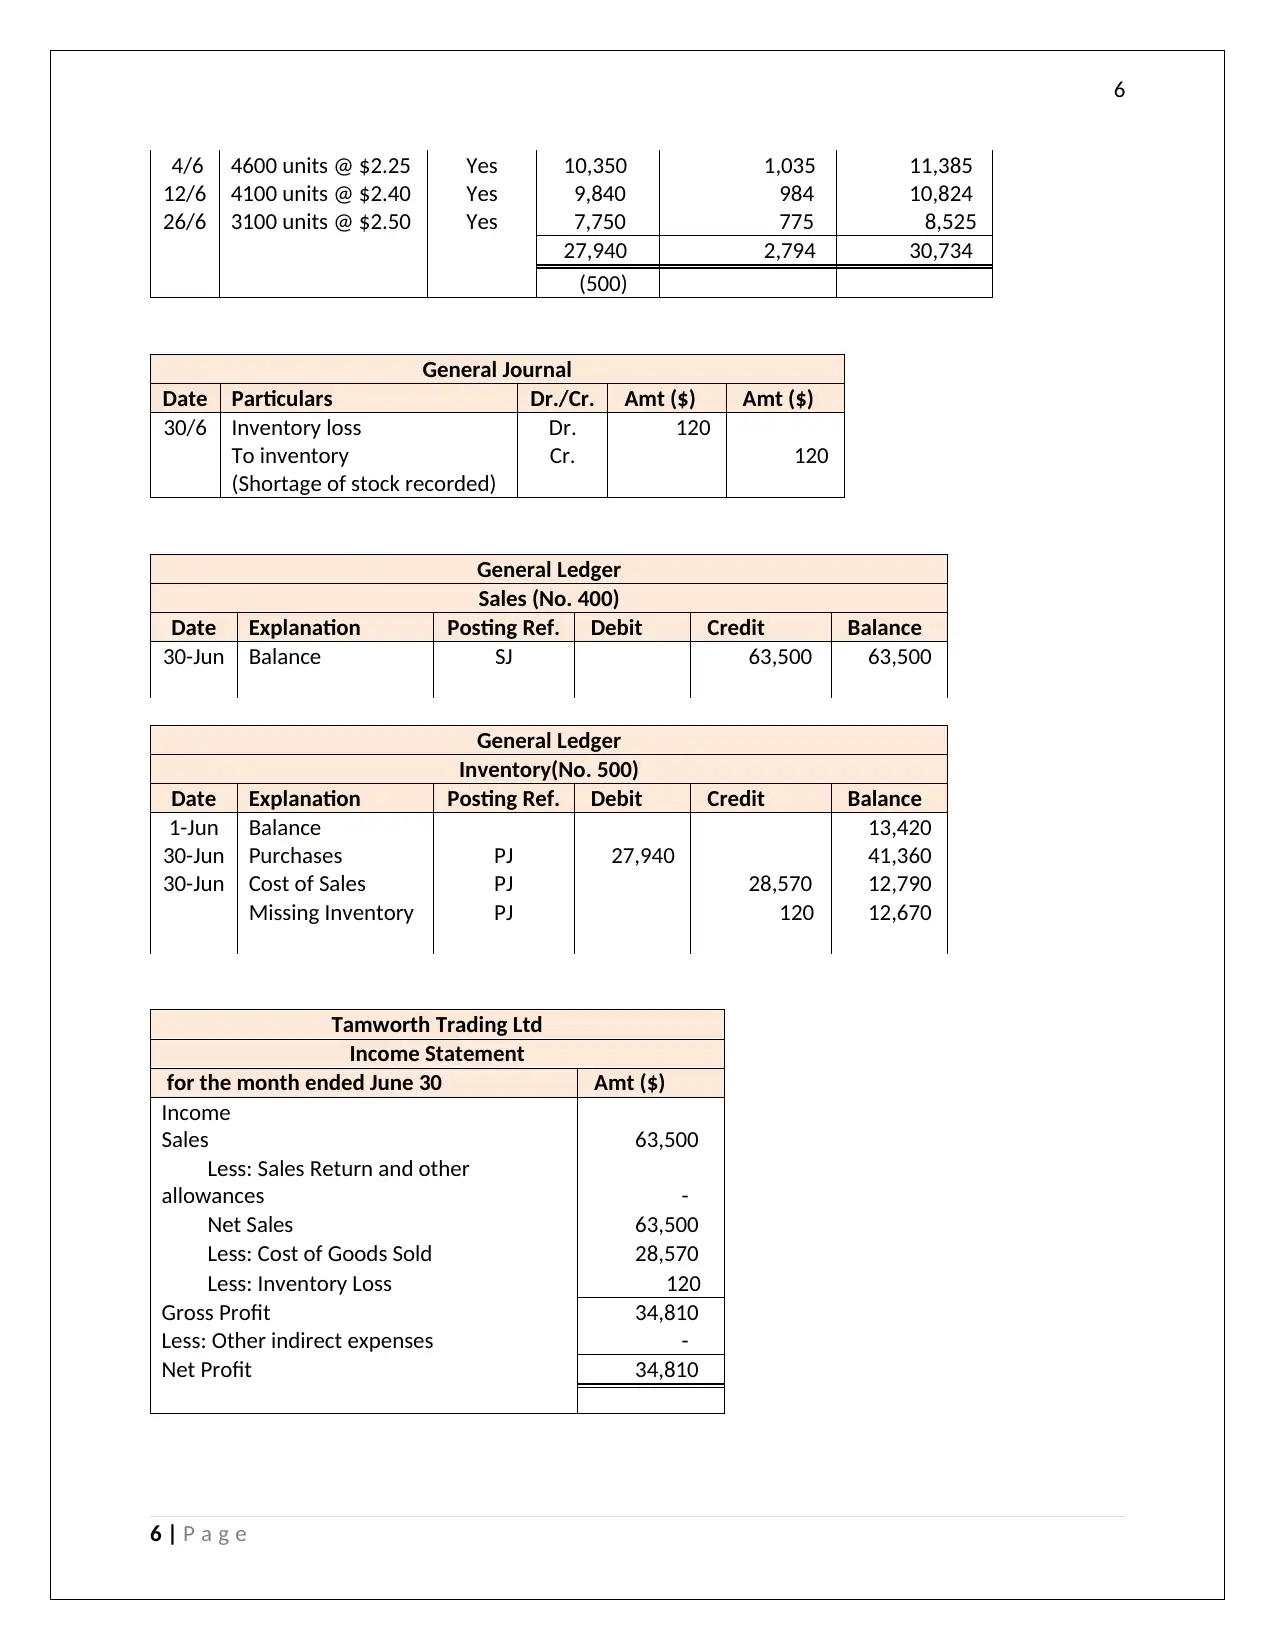
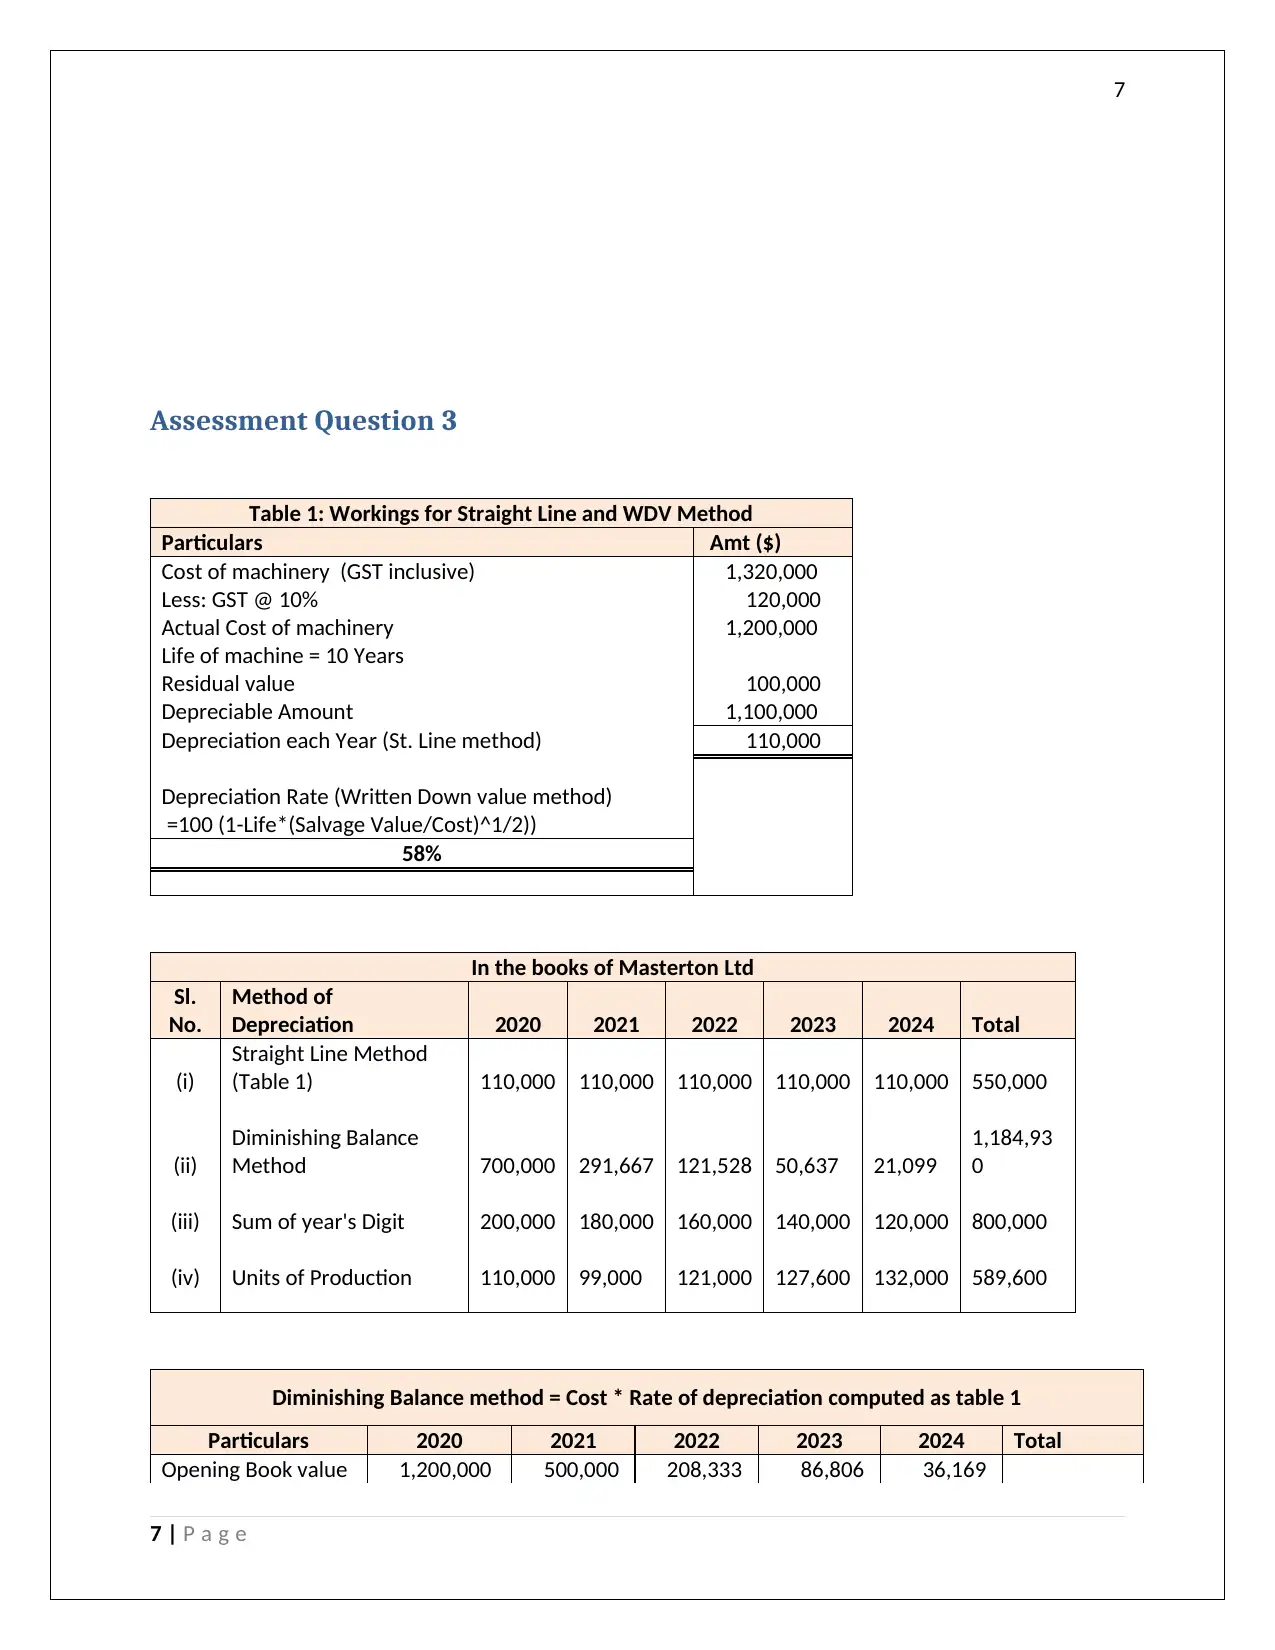
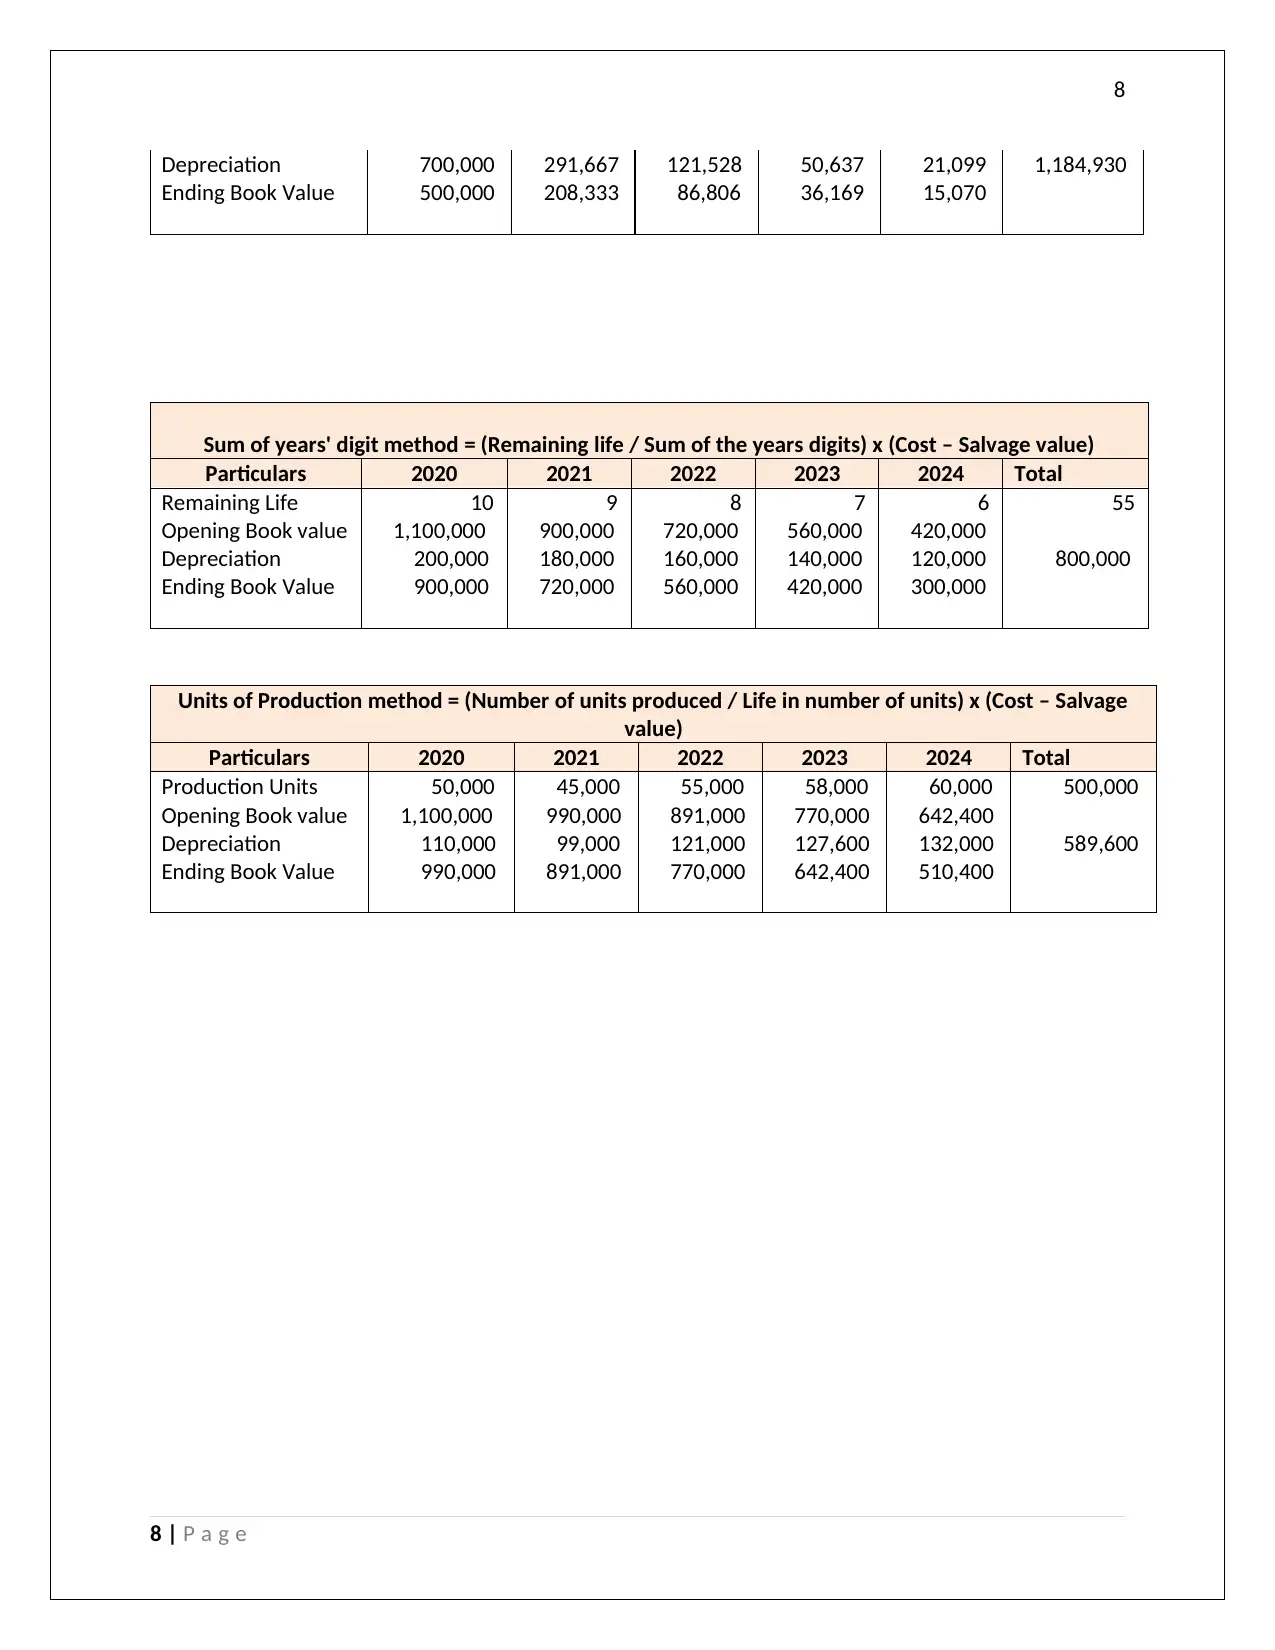
This document presents a comprehensive solution to an ACC102 assignment focusing on financial accounting principles. The assignment covers three key areas: journal entries related to machinery purchase, depreciation calculations, and revaluation; inventory valuation using the FIFO method, including purchases, sales, and cost of goods sold; and a comparison of depreciation methods, including straight-line, diminishing balance, sum-of-the-years' digits, and units of production. The solution provides detailed calculations, journal entries, and financial statements to illustrate the application of these accounting concepts. The document also includes supporting tables and references, providing a thorough understanding of the topics covered. The assignment is a valuable resource for students studying financial accounting and seeking to improve their understanding of depreciation, inventory management, and financial reporting.
Contribute Materials
Your contribution can guide someone’s learning journey. Share your
documents today.

Secure Best Marks with AI Grader
Need help grading? Try our AI Grader for instant feedback on your assignments.

1
By student name
Professor
University
Date: 25 April 2018.
1 | P a g e
By student name
Professor
University
Date: 25 April 2018.
1 | P a g e

2
Contents
Assessment Question 1...............................................................................................................................3
Assessment Question 2...............................................................................................................................5
Assessment Question 3...............................................................................................................................7
References...................................................................................................................................................9
2 | P a g e

3
Assessment Question 1
In the books of Nicolaidis Ltd
Journal Entries
Sl.
No. Date Particulars
Dr./
Cr. Amt ($) Amt ($)
(a) 2017 Machinery Dr. 700,000
1-Jan GST receivable Dr. 70,000
To Cash at bank Cr. 770,000
(Being machines purchased)
(b) 2022 Depreciation on Machinery Dr. 60,000
31-
Dec To Acccumulated Depreciation on Machinery Cr. 60,000
(Depreciation on trucks -
(700000-100000)/10
(c) 2023 Accumulated Depn on Machinery Dr. 360,000
Jan
Write back of Acc Depn - machinery -
revaluation Cr. 360,000
Machinery Dr. 160,000
To Gain on revaluation of machinery Cr. 160,000
(Revaluation of machinery being made)
31-
Dec Depreciation on Machinery Dr. 70,000
To Acccumulated Depreciation on Machinery Cr. 70,000
(Depreciation on trucks - (500000-80000)/6
(d) 2023 Cash at Bank Dr. 220,000
31-
Dec To GST Payable Cr. 200,000
TO Proceeds from Sale - Machinery Cr. 20,000
(Being amount received on sale of
3 | P a g e
Secure Best Marks with AI Grader
Need help grading? Try our AI Grader for instant feedback on your assignments.

4
machinery)
Carrying amount - Machinery Dr. 215,000
Accumulated Depreciation - Machinery Cr. 35,000
To Machinery A/C Cr. 250,000
e. In the given case, there would be no depreciation for the year ended 31st December 2028 on
the second machine as depreciation per annum as per straight line method would come out to
$35000 per annum and by the end of 2027, the machine would be fully depreciated (Das,
2017). In case the management of the company knew earlier that the machinery will be used
even beyond 2028, then there should have been a change or revision in the useful life of the
asset prior to 2028. Now that the carrying value of the machine has reached to residual value, it
is impossible to change further depreciation on the same (Dichev, 2017).
Value of one machine at beginning of 2023: $ 250000
Depreciation per year : $ 35000
31/12/2023: 250000-35000 = 215000
31/12/2024: 215000-35000 = 180000
31/12/2025: 180000-35000 = 145000
31/12/2026: 145000-35000 = 110000
31/12/2027: 110000-35000 = 75000
Therefore, left over depreciation to be charged for the year 2028 = 75000 – 50000 (residual
value) = $ 25000
4 | P a g e

5
Assessment Question 2
Unit Unit Cost Total Unit Unit Cost Total Unit Unit Cost Total
1/6 Balance 6,100 2.20 13,420
4/6 Purchases 4,600 2.25 10,350 6,100 2.20 13,420
4,600 2.25 10,350
9/6 Sales 4,100 2.20 9,020 2,000 2.20 4,400
4,600 2.25 10,350
12/6 Purchases 4,100 2.40 9,840 2,000 2.20 4,400
4,600 2.25 10,350
4,100 2.40 9,840
21/6 Sales 2,000 2.20 4,400 3,500 2.25 7,875
1,100 2.25 2,475 4,100 2.40 9,840
24/6 Sales 2,900 2.25 6,525 600 2.25 1,350
4,100 2.40 9,840
26/6 Purchases 3,100 2.50 7,750 600 2.25 1,350
4,100 2.40 9,840
3,100 2.50 7,750
30/6 Sales 600 2.25 1,350 2,100 2.40 5,040
2,000 2.40 4,800 3,100 2.50 7,750
30/6 Missing Inventory 50 2.40 120 2,050 2.40 4,920
3,100 2.50 7,750
Total 27,940 28,690 12,670
Purchases Sales Balance
ParticularsDate
FIFO Method
Sales Journal
Dat
e Account
Post
Ref. Sales GST Payable Receivable Cost of Sales
9/6
4100 units @
$5 Yes 20,500 2,050 22,550 9,020
21/6
3100 units @
$5 Yes 15,500 1,550 17,050 6,875
24/6
2900 units @
$5 Yes 14,500 1,450 15,950 6,525
30/6
2600 units @
$5 Yes 13,000 1,300 14,300 6,150
63,500 6,350 69,850 28,570
(400) (500)
Purchases Journal
Date Account Post Ref. Inventory GST Receivable Payable
5 | P a g e

6
4/6 4600 units @ $2.25 Yes 10,350 1,035 11,385
12/6 4100 units @ $2.40 Yes 9,840 984 10,824
26/6 3100 units @ $2.50 Yes 7,750 775 8,525
27,940 2,794 30,734
(500)
General Journal
Date Particulars Dr./Cr. Amt ($) Amt ($)
30/6 Inventory loss Dr. 120
To inventory Cr. 120
(Shortage of stock recorded)
General Ledger
Sales (No. 400)
Date Explanation Posting Ref. Debit Credit Balance
30-Jun Balance SJ 63,500 63,500
General Ledger
Inventory(No. 500)
Date Explanation Posting Ref. Debit Credit Balance
1-Jun Balance 13,420
30-Jun Purchases PJ 27,940 41,360
30-Jun Cost of Sales PJ 28,570 12,790
Missing Inventory PJ 120 12,670
Tamworth Trading Ltd
Income Statement
for the month ended June 30 Amt ($)
Income
Sales 63,500
Less: Sales Return and other
allowances -
Net Sales 63,500
Less: Cost of Goods Sold 28,570
Less: Inventory Loss 120
Gross Profit 34,810
Less: Other indirect expenses -
Net Profit 34,810
6 | P a g e
Paraphrase This Document
Need a fresh take? Get an instant paraphrase of this document with our AI Paraphraser

7
Assessment Question 3
Table 1: Workings for Straight Line and WDV Method
Particulars Amt ($)
Cost of machinery (GST inclusive) 1,320,000
Less: GST @ 10% 120,000
Actual Cost of machinery 1,200,000
Life of machine = 10 Years
Residual value 100,000
Depreciable Amount 1,100,000
Depreciation each Year (St. Line method) 110,000
Depreciation Rate (Written Down value method)
=100 (1-Life*(Salvage Value/Cost)^1/2))
58%
In the books of Masterton Ltd
Sl.
No.
Method of
Depreciation 2020 2021 2022 2023 2024 Total
(i)
Straight Line Method
(Table 1) 110,000 110,000 110,000 110,000 110,000 550,000
(ii)
Diminishing Balance
Method 700,000 291,667 121,528 50,637 21,099
1,184,93
0
(iii) Sum of year's Digit 200,000 180,000 160,000 140,000 120,000 800,000
(iv) Units of Production 110,000 99,000 121,000 127,600 132,000 589,600
Diminishing Balance method = Cost * Rate of depreciation computed as table 1
Particulars 2020 2021 2022 2023 2024 Total
Opening Book value 1,200,000 500,000 208,333 86,806 36,169
7 | P a g e

8
Depreciation 700,000 291,667 121,528 50,637 21,099 1,184,930
Ending Book Value 500,000 208,333 86,806 36,169 15,070
Sum of years' digit method = (Remaining life / Sum of the years digits) x (Cost – Salvage value)
Particulars 2020 2021 2022 2023 2024 Total
Remaining Life 10 9 8 7 6 55
Opening Book value 1,100,000 900,000 720,000 560,000 420,000
Depreciation 200,000 180,000 160,000 140,000 120,000 800,000
Ending Book Value 900,000 720,000 560,000 420,000 300,000
Units of Production method = (Number of units produced / Life in number of units) x (Cost – Salvage
value)
Particulars 2020 2021 2022 2023 2024 Total
Production Units 50,000 45,000 55,000 58,000 60,000 500,000
Opening Book value 1,100,000 990,000 891,000 770,000 642,400
Depreciation 110,000 99,000 121,000 127,600 132,000 589,600
Ending Book Value 990,000 891,000 770,000 642,400 510,400
8 | P a g e

9
References
Das, P., 2017. Financing Pattern and Utilization of Fixed Assets - A Study. Asian Journal of Social Science
Studies, 2(2), pp. 10-17.
Dichev, I., 2017. On the conceptual foundations of financial reporting. Accounting and Business
Research, 47(6), pp. 617-632.
9 | P a g e
References
Das, P., 2017. Financing Pattern and Utilization of Fixed Assets - A Study. Asian Journal of Social Science
Studies, 2(2), pp. 10-17.
Dichev, I., 2017. On the conceptual foundations of financial reporting. Accounting and Business
Research, 47(6), pp. 617-632.
9 | P a g e
1 out of 10

Your All-in-One AI-Powered Toolkit for Academic Success.
+13062052269
info@desklib.com
Available 24*7 on WhatsApp / Email
Unlock your academic potential
© 2024 | Zucol Services PVT LTD | All rights reserved.