University Name: ITECH1400 Fundamentals of Programming ATO Case Study
VerifiedAdded on 2022/08/21
|11
|1412
|13
Homework Assignment
AI Summary
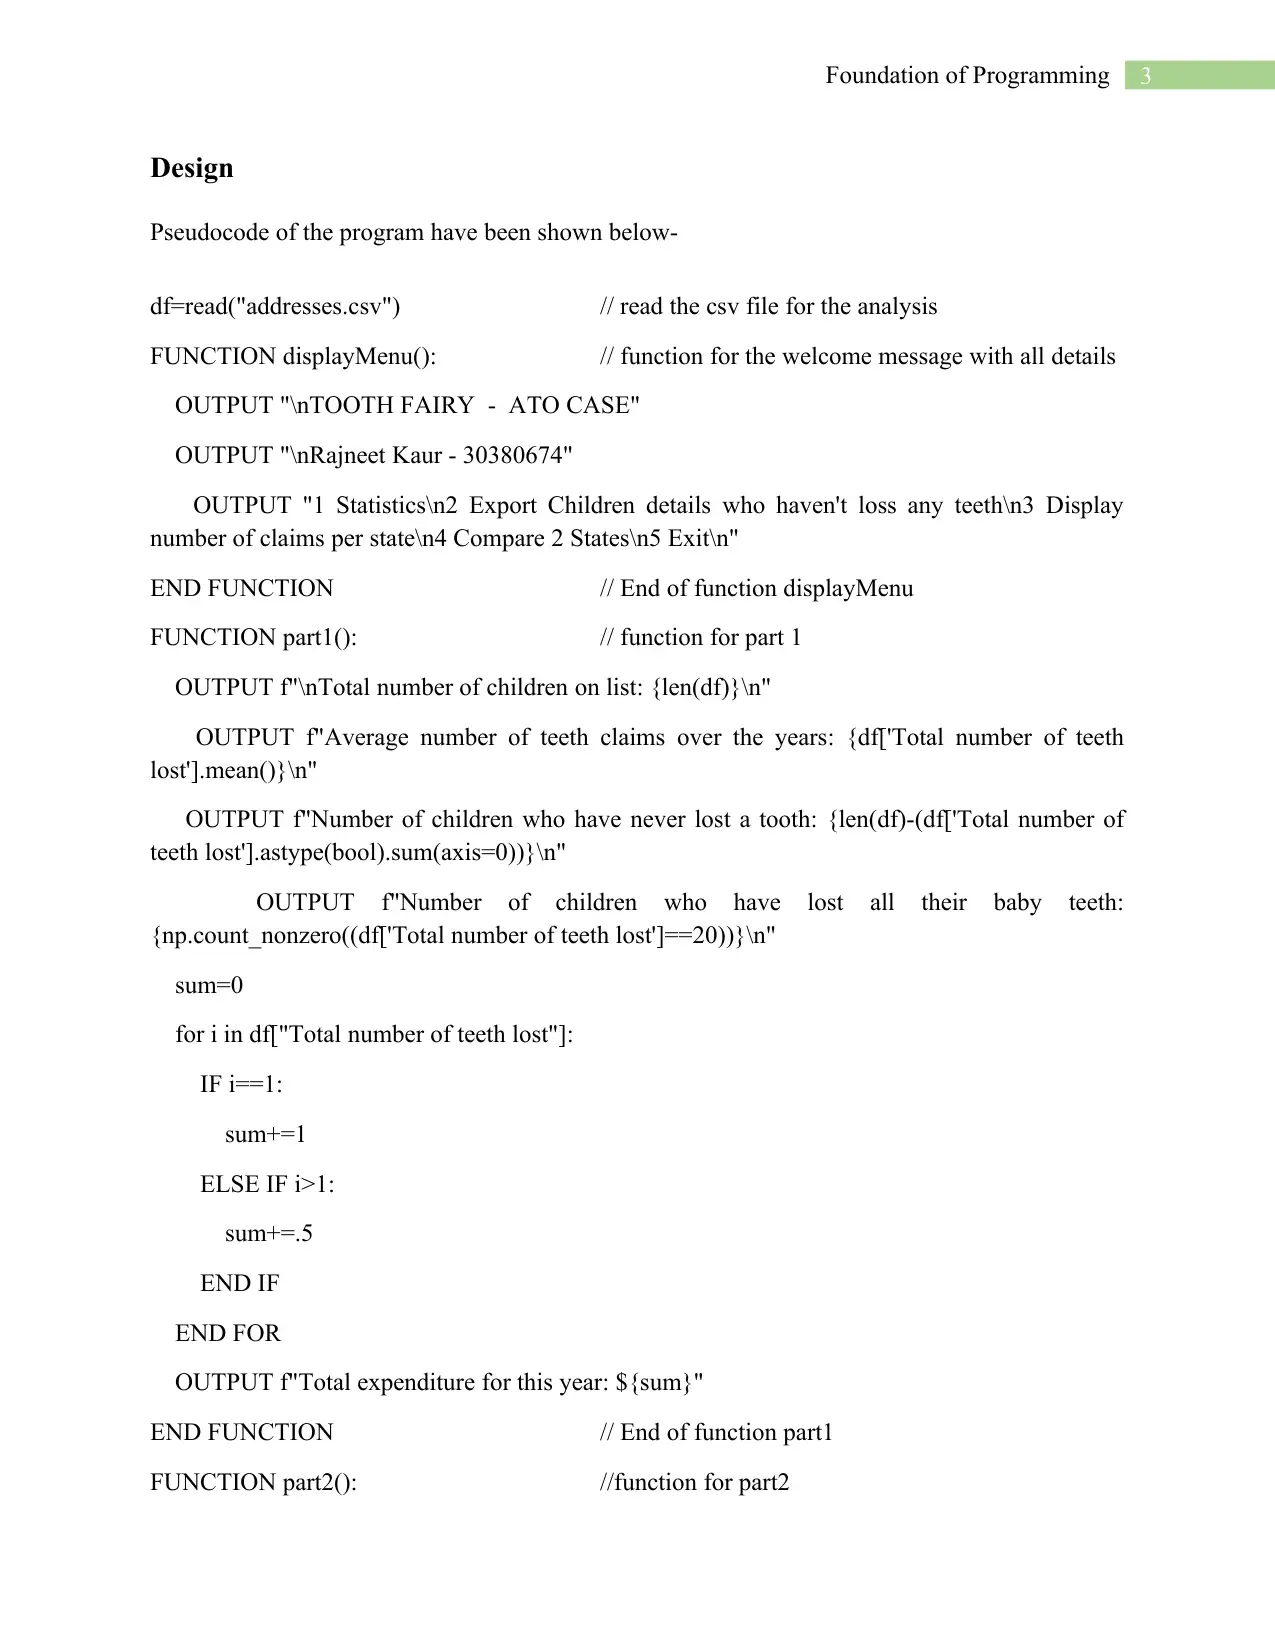
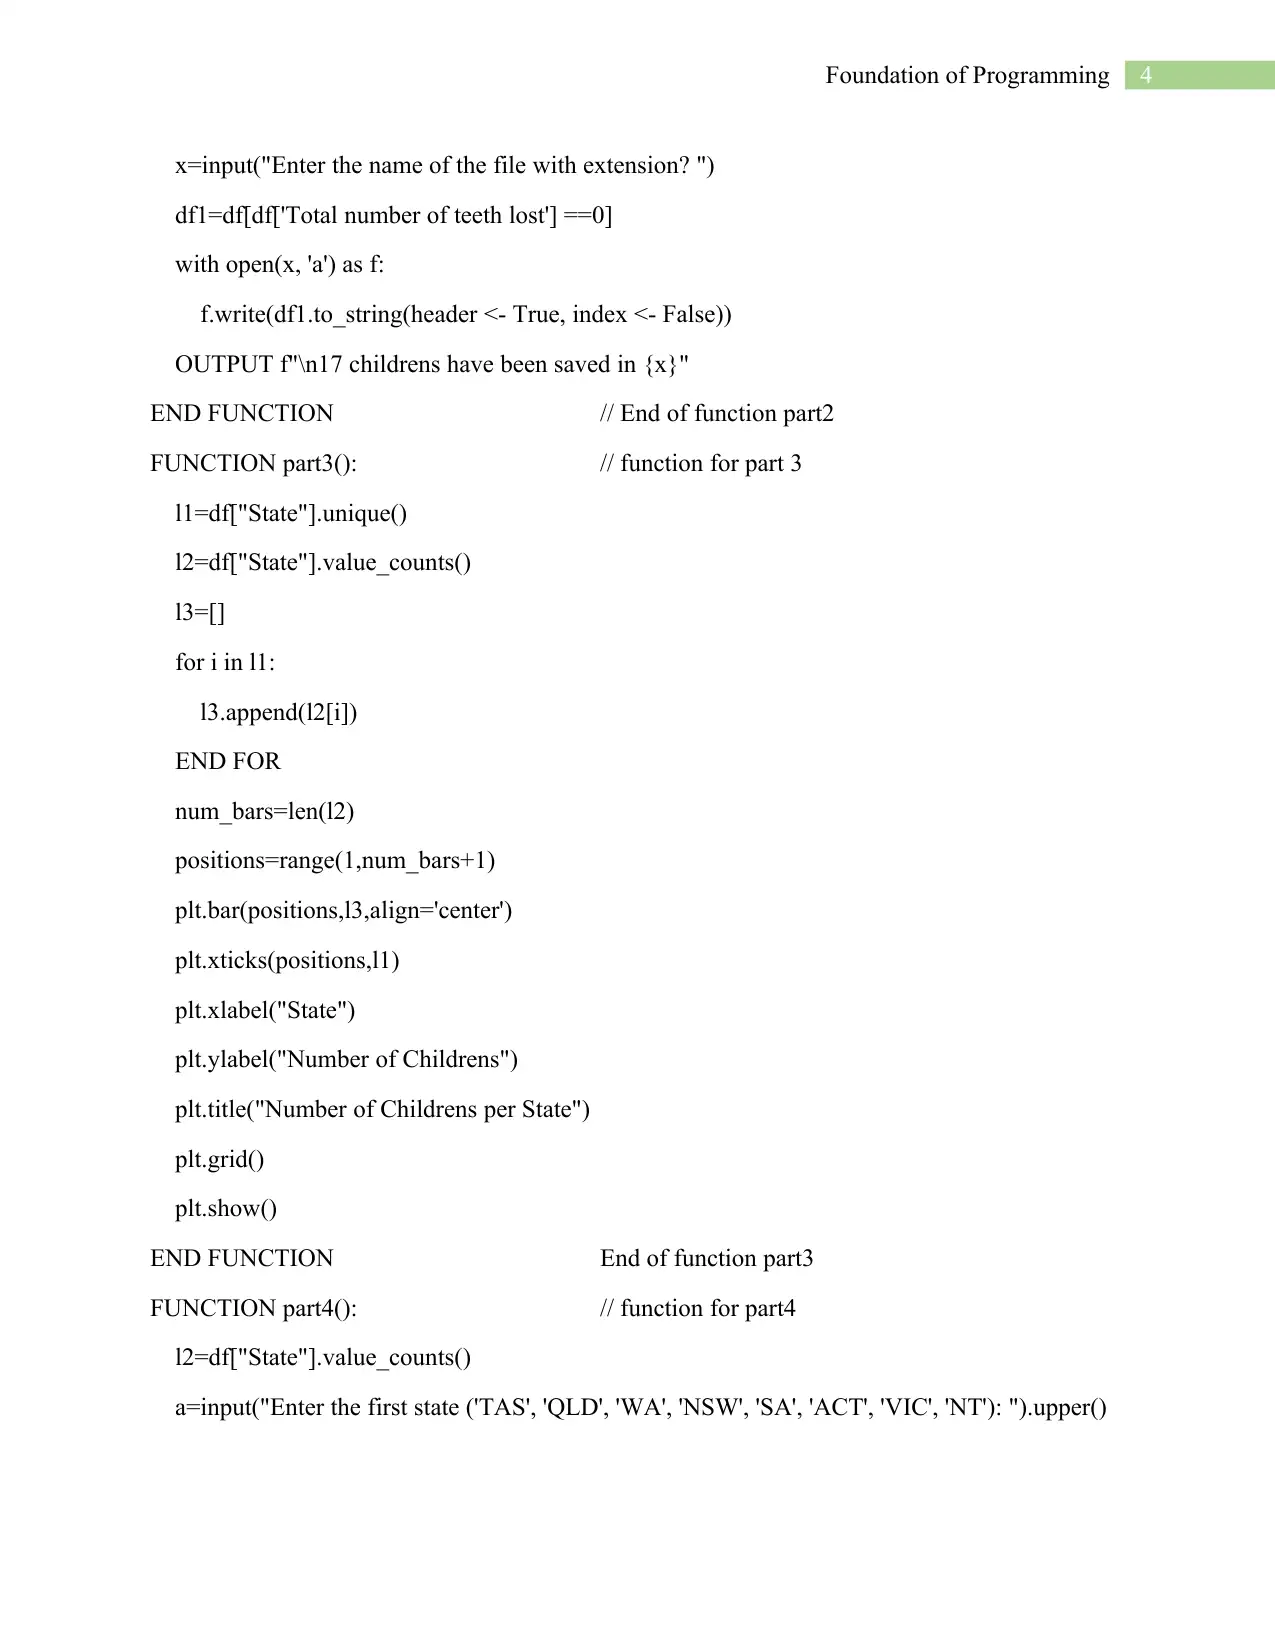
This document presents a complete solution to a programming assignment focused on analyzing data from the Australian Tax Office (ATO) related to the Tooth Fairy. The assignment involves designing and implementing a Python program to process data from a CSV file, providing statistical analysis, generating reports, and creating visualizations. The solution includes pseudocode, detailed descriptions of the algorithm, test cases, and an activity flowchart to illustrate the program's logic. The program offers a menu-driven interface with options for statistical analysis, data export, and graphical representations of the data. The document demonstrates the application of programming constructs, data manipulation, and data visualization techniques within the context of a practical problem. The solution also includes test cases to ensure the program's correctness and reliability.

Running head: FOUNDATION OF PROGRAMMING
Foundation of Programming
Students name:
Student ID:
University Name:
Foundation of Programming
Students name:
Student ID:
University Name:
Paraphrase This Document
Need a fresh take? Get an instant paraphrase of this document with our AI Paraphraser

2Foundation of Programming
Table of Contents
Design..............................................................................................................................................3
Test Cases........................................................................................................................................7
Activity Flowchart...........................................................................................................................8
Bibliography....................................................................................................................................9
Appendix 1.....................................................................................................................................10

3Foundation of Programming
Design
Pseudocode of the program have been shown below-
df=read("addresses.csv") // read the csv file for the analysis
FUNCTION displayMenu(): // function for the welcome message with all details
OUTPUT "\nTOOTH FAIRY - ATO CASE"
OUTPUT "\nRajneet Kaur - 30380674"
OUTPUT "1 Statistics\n2 Export Children details who haven't loss any teeth\n3 Display
number of claims per state\n4 Compare 2 States\n5 Exit\n"
END FUNCTION // End of function displayMenu
FUNCTION part1(): // function for part 1
OUTPUT f"\nTotal number of children on list: {len(df)}\n"
OUTPUT f"Average number of teeth claims over the years: {df['Total number of teeth
lost'].mean()}\n"
OUTPUT f"Number of children who have never lost a tooth: {len(df)-(df['Total number of
teeth lost'].astype(bool).sum(axis=0))}\n"
OUTPUT f"Number of children who have lost all their baby teeth:
{np.count_nonzero((df['Total number of teeth lost']==20))}\n"
sum=0
for i in df["Total number of teeth lost"]:
IF i==1:
sum+=1
ELSE IF i>1:
sum+=.5
END IF
END FOR
OUTPUT f"Total expenditure for this year: ${sum}"
END FUNCTION // End of function part1
FUNCTION part2(): //function for part2
⊘ This is a preview!⊘
Do you want full access?
Subscribe today to unlock all pages.

Trusted by 1+ million students worldwide

4Foundation of Programming
x=input("Enter the name of the file with extension? ")
df1=df[df['Total number of teeth lost'] ==0]
with open(x, 'a') as f:
f.write(df1.to_string(header <- True, index <- False))
OUTPUT f"\n17 childrens have been saved in {x}"
END FUNCTION // End of function part2
FUNCTION part3(): // function for part 3
l1=df["State"].unique()
l2=df["State"].value_counts()
l3=[]
for i in l1:
l3.append(l2[i])
END FOR
num_bars=len(l2)
positions=range(1,num_bars+1)
plt.bar(positions,l3,align='center')
plt.xticks(positions,l1)
plt.xlabel("State")
plt.ylabel("Number of Childrens")
plt.title("Number of Childrens per State")
plt.grid()
plt.show()
END FUNCTION End of function part3
FUNCTION part4(): // function for part4
l2=df["State"].value_counts()
a=input("Enter the first state ('TAS', 'QLD', 'WA', 'NSW', 'SA', 'ACT', 'VIC', 'NT'): ").upper()
Paraphrase This Document
Need a fresh take? Get an instant paraphrase of this document with our AI Paraphraser

5Foundation of Programming
b=input("Enter the second state ('TAS', 'QLD', 'WA', 'NSW', 'SA', 'ACT', 'VIC', 'NT'):
").upper()
m=df.loc[(df['State']==a)]["Total number of teeth lost"].sum()
n=df.loc[(df['State']==b)]["Total number of teeth lost"].sum()
X,Y=[],[]
X.append(a)
X.append(b)
Y.append(m/l2[a])
Y.append(n/l2[b])
num_bars=len(Y)
positions=range(1,num_bars+1)
plt.bar(positions,Y,align='center')
plt.xticks(positions,X)
plt.xlabel("State")
plt.ylabel("Average number of Teeth")
plt.title("Average number of Teeth Loss acorss 2 States")
plt.grid()
plt.show()
END FUNCTION // End of function part4
while True: // while loop for continuation of input
displayMenu()
choice=int(input("Enter your choice [1-5] "))
IF choice==1:
part1()
ELSEIF choice==2:
part2()
ELSEIF choice==3:

6Foundation of Programming
part3()
ELSEIF choice==4:
part4()
ELSEIF choice==5:
OUTPUT "\nThank You for using TOOTH FAIRY - ATO CASE"
break
ELSE:
OUTPUT "\nInvalid Selection, Please select from [1-5]"
Continue
End while // End of while loop
The above pseudocode describe the functionality of the program.
Description of the algorithm-
The first stage of the program is to import the required libraries that will be used for
mathematical calculation and graphical representation of the data. The next step is to read the
dataset which contains all the information.
The displayMenu function have been implemented to display the welcome message with
proper details and there are 5 choices for user input where-
1. Statistics of the dataset with appropriate requirement.
2. Export Children details who haven't loss any teeth.
3. Display number of claims per state
4. Compare 2 States
5. Exit.
⊘ This is a preview!⊘
Do you want full access?
Subscribe today to unlock all pages.

Trusted by 1+ million students worldwide

7Foundation of Programming
The statistic function calculates and displays 5 different question from the requirements
which are based on finding calculations which is done on the part1 function. Then the part2
function exports a file which contains information based on some conditions. Part3 function
shows a graph which contains different state with number of children’s per state with proper
labelling. Then in part4 function a graph will be generated for the number of states with respect
to the Average number of Teeth for individual states and at the end EXIT option will be used for
closing the program or to break from the kernel. If the user provide a wrong input then a warning
message will be displayed and the process will loop to the beginning of the program.
Test Cases
Test Case Conditions
Serial Number Actions Expected Output Obtained Output
1 File with proper extension
and able to run on spyder.
The python file have
extension .py and will open
in spyder software.
The python file has .py
extension and is runnable
in spyder.
2 Proper welcome message is
displayed upon running.
All the welcome messages
with proper choices need to
be shown
Appropriate welcome
message with proper user
choices implemented.
3 Appropriate file need to
loaded for analysis
addresses.csv file need to be
loaded for the analysis
purpose.
addresses.csv file have
been imported for further
analysis.
4 Appropriate output Exact outputs need to be
deliver by each function
Correct outcomes have
been achieved by every
Paraphrase This Document
Need a fresh take? Get an instant paraphrase of this document with our AI Paraphraser

8Foundation of Programming
function in the program.
5 Graphs with proper
understanding
Proper graphs with clear
understanding need to be
shown for different
questions.
Appropriate graphs with
proper understanding
have been implemented
for different questions.
Table 1: Test cases of the program
Activity Flowchart
Figure 1: Activity flowchart of the program
Figure 1 represents the flowchart of the program, different branches of the program has been
shown with detail information.

9Foundation of Programming
Bibliography
Ari, N., & Ustazhanov, M. (2014, September). Matplotlib in python. In 2014 11th International
Conference on Electronics, Computer and Computation (ICECCO) (pp. 1-6). IEEE.
Ascher, D., Dubois, P. F., Hinsen, K., Hugunin, J., & Oliphant, T. (2001). Numerical python.
McKinney, W. (2015). Pandas, Python Data Analysis Library. see http://pandas. pydata. org.
Tosi, S. (2009). Matplotlib for Python developers. Packt Publishing Ltd.
Vaingast, S. (2014). Beginning Python visualization: crafting visual transformation scripts.
Apress.
Van Rossum, G. (2007, June). Python Programming Language. In USENIX annual technical
conference (Vol. 41, p. 36).
⊘ This is a preview!⊘
Do you want full access?
Subscribe today to unlock all pages.

Trusted by 1+ million students worldwide

10Foundation of Programming
Appendix 1
Appendix 1
Paraphrase This Document
Need a fresh take? Get an instant paraphrase of this document with our AI Paraphraser

11Foundation of Programming
1 out of 11

Your All-in-One AI-Powered Toolkit for Academic Success.
+13062052269
info@desklib.com
Available 24*7 on WhatsApp / Email
Unlock your academic potential
Copyright © 2020–2025 A2Z Services. All Rights Reserved. Developed and managed by ZUCOL.