University of Tasmania KLA346: Fungal Infections in Grapevine
VerifiedAdded on 2022/09/18
|19
|5174
|24
Report
AI Summary
This report presents an analysis of fungal infections affecting grapevines, primarily focusing on Botrytis Bunch Rot (BBR) and Powdery Mildew (PM) in the Craigow vineyard located in Tasmania. The study encompasses field assessments of disease incidence and severity in Riesling, Pinot noir, and Chardonnay varieties, along with an investigation of the effects of temperature on fungal growth and the resistance of Botrytis species to antifungal agents. The methodology includes field observations, data collection using iPads, and laboratory experiments involving spore germination and fungicide resistance screening. The results section provides detailed data on BBR and PM incidence, the impact of temperature on Botrytis cinerea spore germination, and the resistance of fungal isolates to boscalid. The report also includes an overview of the epidemiology of grapevine fungal pathogens and discusses the implications of these findings for grapevine management and disease control strategies. The report concludes with a summary of the key findings and their significance in the context of grapevine health and productivity, referencing relevant literature to support the analysis.
Running Head: Fungal infection 1
FUNGAL INFECTIONS IN GRAPEVINE
Name
Institutional Affiliation
FUNGAL INFECTIONS IN GRAPEVINE
Name
Institutional Affiliation
Paraphrase This Document
Need a fresh take? Get an instant paraphrase of this document with our AI Paraphraser
FUNGAL INFECTION 2
Table of Contents
Abstract.................................................................................................................................................3
Introduction...........................................................................................................................................3
Materials and Methods..........................................................................................................................4
Field Assessment of the fungal disease..............................................................................................4
Procedure 2.2.................................................................................................................................4
Effects of Temperature..................................................................................................................4
Procedure 2.3.................................................................................................................................5
Antifungal resistance.....................................................................................................................6
Procedure project 2.4.....................................................................................................................6
Screening for Fungicide resistance................................................................................................6
Results...................................................................................................................................................7
Project 2.2: Field Assessment............................................................................................................7
Botrytis Bunch Rot (BBR).............................................................................................................7
Powdery Mildew (PM)..................................................................................................................8
Risk Factors...................................................................................................................................9
Project 2.3 Effects of Temperature..................................................................................................10
Project 2.4: Antifungal Resistance...................................................................................................11
Discussion...........................................................................................................................................12
Conclusion...........................................................................................................................................15
References...........................................................................................................................................17
FUNGAL INFECTION 3
Abstract
Grapevines are grown in Tasmania mainly for winemaking. Grape farming faces
challenges from fungal infections such as Botrytis Bunch Rot (BBR)and Powdery Mildew
(PM) that are caused by Botrytis cinerea and Erysiphe necator respectively. These diseases
can destroy whole vineyards thus resulting in significant losses to the grape farmers. In this
paper, we have reported projects carried out on grape vineyard at the Craigow vineyard. We
have also studied the resistance of some Botrytis species to antifungals and the effects of
temperature on the growth of the fungus.
Introduction
Grapevine diseases can be very devastating. Unfortunately, numerous grapevine
diseases thrive in almost any condition of planting. Fungi and bacteria are the major causes of
most grapevine diseases. Other diseases are caused by viruses. Birds and insects can transmit
bacteria or fungi from one vine to the other. Environmental factors can trigger the growth of
fungus that in turn wreaks havoc to grape vineyards. Grapevines are rarely grown in
temperate regions (Koch and Oehl, 2018). This is because grapes thrive well in climates with
low humidity and moisture (Gautam a al., 2013). A major management issue for grapevine
farming regions is the control of cryptogamic diseases. Powdery mildew (PM) for instance is
a major phytosanitary threat in the temperate regions (Bois et al., 2017). This is because
Erysiphe necator the fungus causing PM is temperature driven and is mostly induced by
rainfall (Bois et al., 2017). Temperate climate favors the spread of the fungal diseases.
The cool temperate climate causes the spread of fungal disease pathogens such as
Eutypa lata that cause Eutypa canker (EC), Botrytis cinerea that causes botrytis bunch rot
(BBR) and Erysiphe necator that cause Powdery mildew (PM). These culprit fungi belong to
the phylum Ascomycetes and spread through the air. All these fungi are prevalent in
Tasmanian grapevine yards. In Tasmania, grapevines are grown in most regions for wine
⊘ This is a preview!⊘
Do you want full access?
Subscribe today to unlock all pages.
Trusted by 1+ million students worldwide
FUNGAL INFECTION 4
production and the fungal diseases are prevalent in all grape vine growing regions. The
severity of the fungal diseases varies with management choices and weather. This report
presents the incidence of BBR and PM at the Craigow vineyard in the Coal River Valley of
Tasmania. In this report, we will also outline the epidemiology of grapevine fungal pathogens
using online resources.
Materials and Methods
Field Assessment of the fungal disease
The assessment of BBR and PM was done by visiting the Craigow vineyard that is
located in Cambridge. The incidence, severity, and impacts of the diseases on the yield was
done on three grapevine varieties. The varieties studied were Riesling, Pinot noir and the
Chardonnay. The materials used were ipads that were used to collect data and take photos and
hand lenses.
Procedure 2.2
Each pair of students were allocated a part of one row of chardonnay and Riesling.
Every third vine of the row was assessed and until a total of 12 vines were recorded. From
each vine, 5 grape bunches were assessed and the percentage of disease estimated.
The percentage estimate of the disease was recorded as follows. Under 5% infection
estimates were recorded in single units (1-5 %). Estimates between 5% and 20% was
recorded in units of 5% (10%, 15% and 20%. Percentage estimates above 20% was recorded
in units of 10% (30%, 40% to 100%).
The percentages were recorded on a score sheet in the ipad and referenced against
photos. The data was then compiled and analyzed.
Effects of Temperature.
The effects of temperature on the germination of Botrytis cinerea spores was
determined.
Paraphrase This Document
Need a fresh take? Get an instant paraphrase of this document with our AI Paraphraser
FUNGAL INFECTION 5
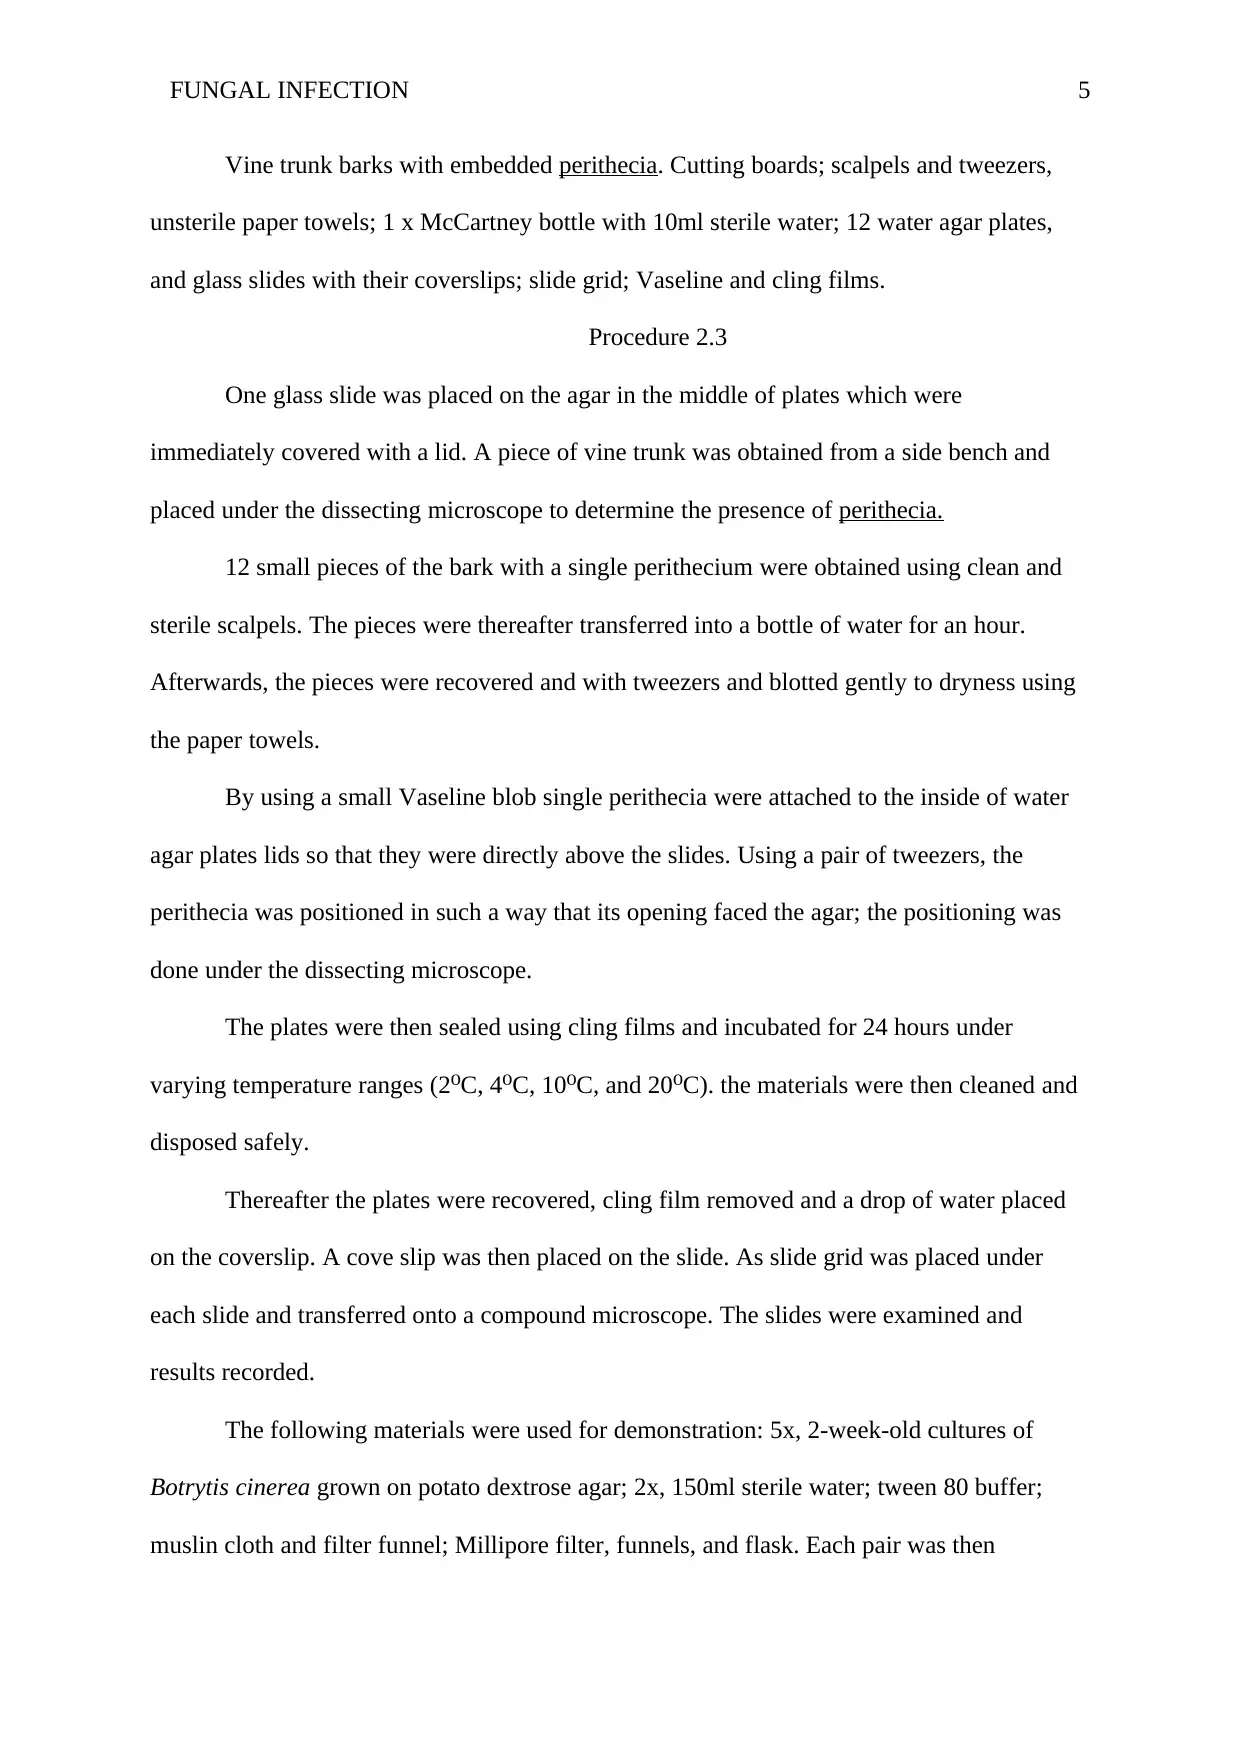
Vine trunk barks with embedded perithecia. Cutting boards; scalpels and tweezers,
unsterile paper towels; 1 x McCartney bottle with 10ml sterile water; 12 water agar plates,
and glass slides with their coverslips; slide grid; Vaseline and cling films.
Procedure 2.3
One glass slide was placed on the agar in the middle of plates which were
immediately covered with a lid. A piece of vine trunk was obtained from a side bench and
placed under the dissecting microscope to determine the presence of perithecia.
12 small pieces of the bark with a single perithecium were obtained using clean and
sterile scalpels. The pieces were thereafter transferred into a bottle of water for an hour.
Afterwards, the pieces were recovered and with tweezers and blotted gently to dryness using
the paper towels.
By using a small Vaseline blob single perithecia were attached to the inside of water
agar plates lids so that they were directly above the slides. Using a pair of tweezers, the
perithecia was positioned in such a way that its opening faced the agar; the positioning was
done under the dissecting microscope.
The plates were then sealed using cling films and incubated for 24 hours under
varying temperature ranges (2 C, 4 C, 10 C, and 20 C). the materials were then cleaned and⁰ ⁰ ⁰ ⁰
disposed safely.
Thereafter the plates were recovered, cling film removed and a drop of water placed
on the coverslip. A cove slip was then placed on the slide. As slide grid was placed under
each slide and transferred onto a compound microscope. The slides were examined and
results recorded.
The following materials were used for demonstration: 5x, 2-week-old cultures of
Botrytis cinerea grown on potato dextrose agar; 2x, 150ml sterile water; tween 80 buffer;
muslin cloth and filter funnel; Millipore filter, funnels, and flask. Each pair was then
FUNGAL INFECTION 6
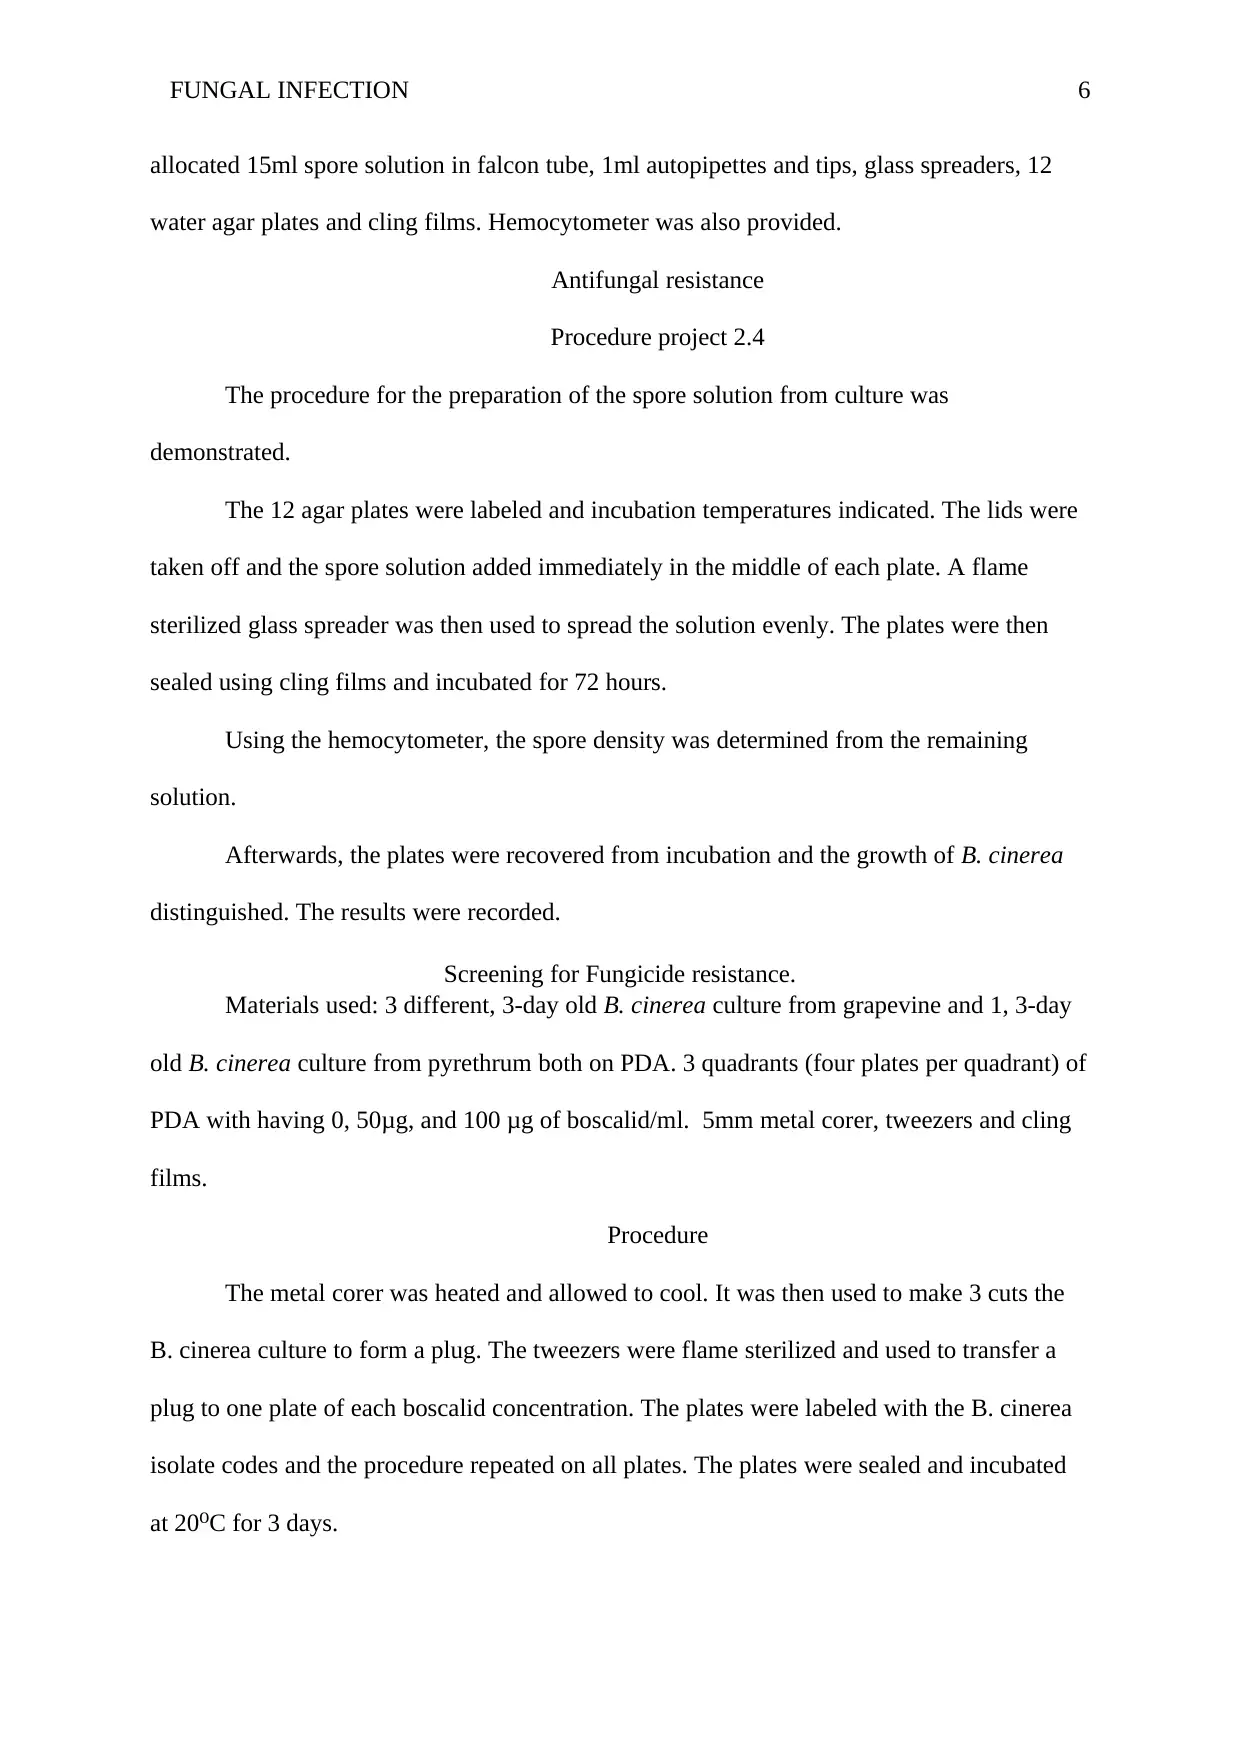
allocated 15ml spore solution in falcon tube, 1ml autopipettes and tips, glass spreaders, 12
water agar plates and cling films. Hemocytometer was also provided.
Antifungal resistance
Procedure project 2.4
The procedure for the preparation of the spore solution from culture was
demonstrated.
The 12 agar plates were labeled and incubation temperatures indicated. The lids were
taken off and the spore solution added immediately in the middle of each plate. A flame
sterilized glass spreader was then used to spread the solution evenly. The plates were then
sealed using cling films and incubated for 72 hours.
Using the hemocytometer, the spore density was determined from the remaining
solution.
Afterwards, the plates were recovered from incubation and the growth of B. cinerea
distinguished. The results were recorded.
Screening for Fungicide resistance.
Materials used: 3 different, 3-day old B. cinerea culture from grapevine and 1, 3-day
old B. cinerea culture from pyrethrum both on PDA. 3 quadrants (four plates per quadrant) of
PDA with having 0, 50μg, and 100 μg of boscalid/ml. 5mm metal corer, tweezers and cling
films.
Procedure
The metal corer was heated and allowed to cool. It was then used to make 3 cuts the
B. cinerea culture to form a plug. The tweezers were flame sterilized and used to transfer a
plug to one plate of each boscalid concentration. The plates were labeled with the B. cinerea
isolate codes and the procedure repeated on all plates. The plates were sealed and incubated
at 20 C for 3 days.⁰
⊘ This is a preview!⊘
Do you want full access?
Subscribe today to unlock all pages.
Trusted by 1+ million students worldwide
FUNGAL INFECTION 7
Thereafter the plates were retrieved and growth determined. The diameter of each
growth was then determined using a ruler in two perpendicular directions and results
recorded. The mean diameter was calculated. the growth of each isolate was also determined
relative to the controls. the results were then compiled.
Results
Project 2.2: Field Assessment
Survey data for row number four for Riesling grapevine variety. The results for field
assessment are for BBR and PM.
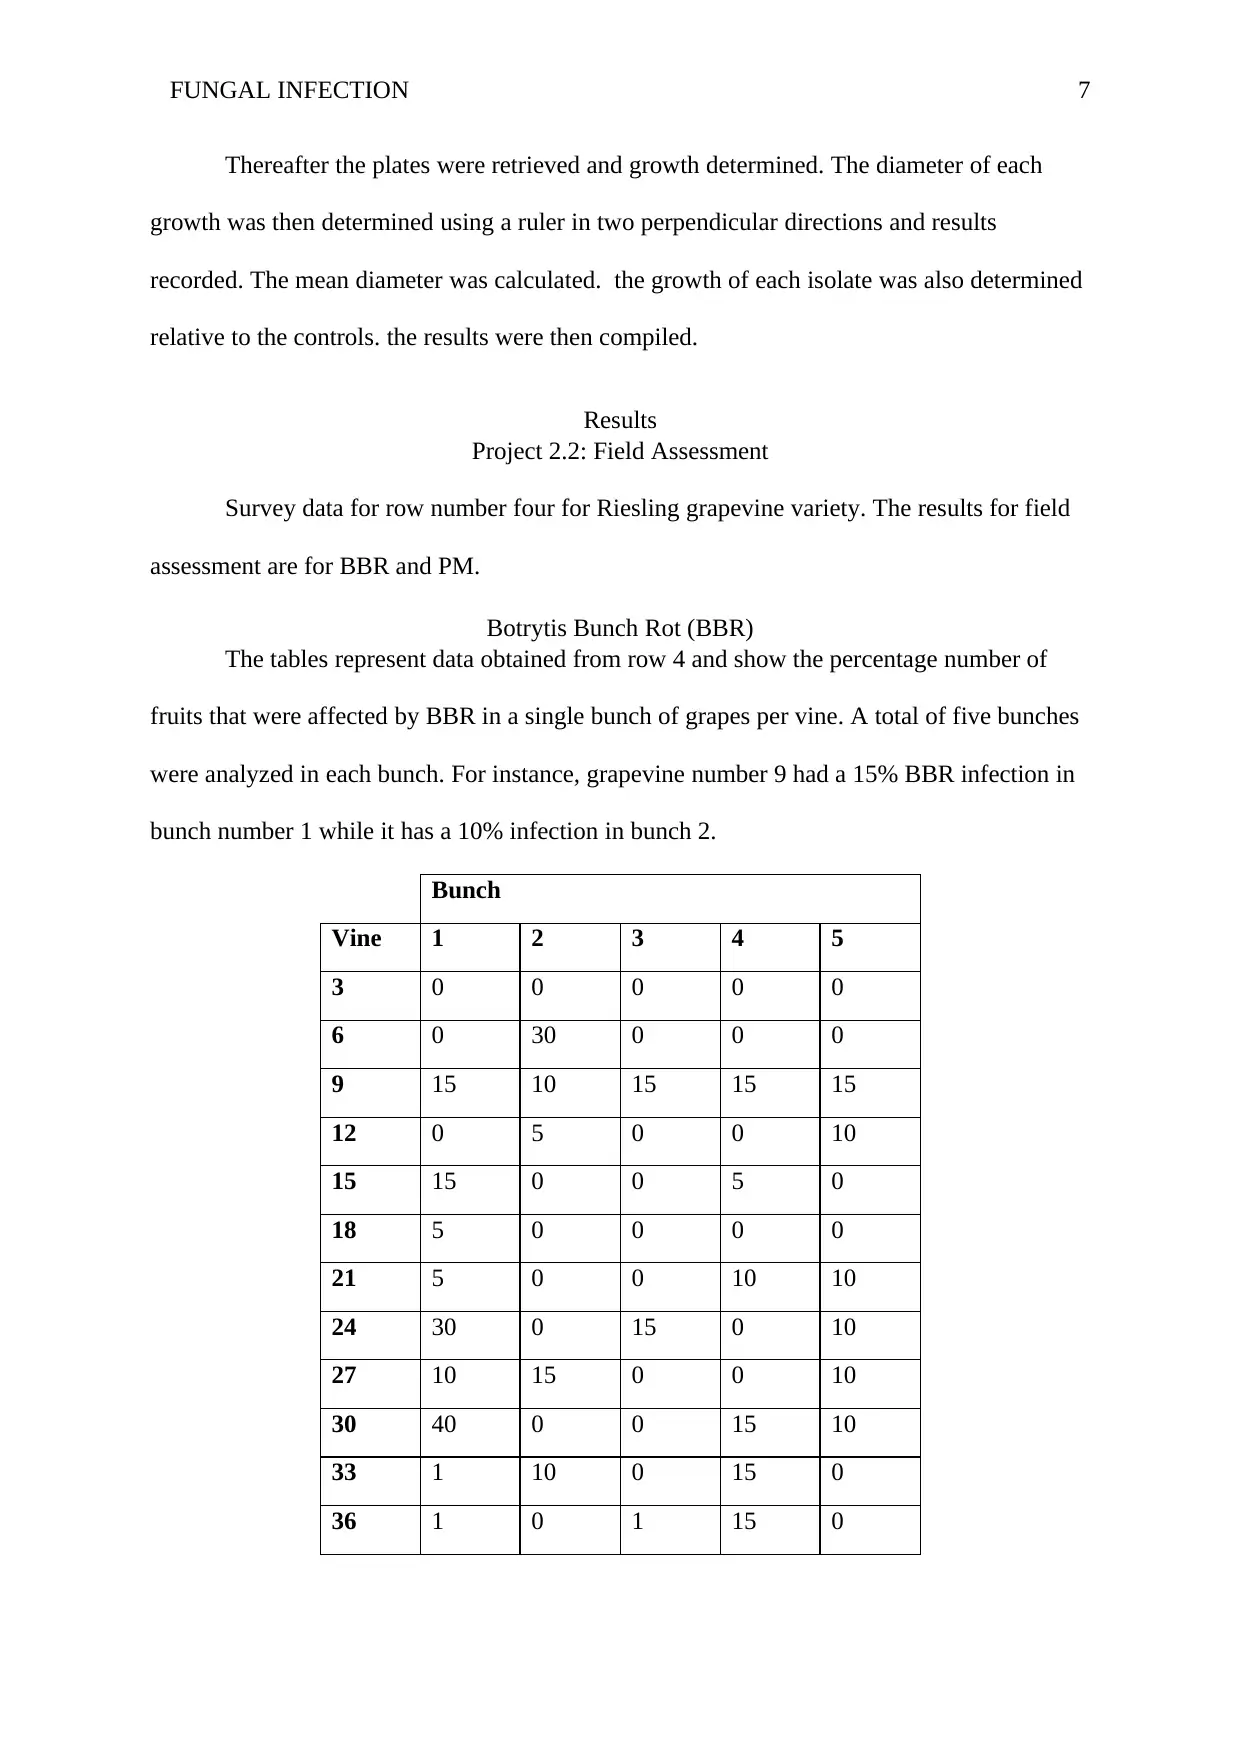
Botrytis Bunch Rot (BBR)
The tables represent data obtained from row 4 and show the percentage number of
fruits that were affected by BBR in a single bunch of grapes per vine. A total of five bunches
were analyzed in each bunch. For instance, grapevine number 9 had a 15% BBR infection in
bunch number 1 while it has a 10% infection in bunch 2.
Bunch
Vine 1 2 3 4 5
3 0 0 0 0 0
6 0 30 0 0 0
9 15 10 15 15 15
12 0 5 0 0 10
15 15 0 0 5 0
18 5 0 0 0 0
21 5 0 0 10 10
24 30 0 15 0 10
27 10 15 0 0 10
30 40 0 0 15 10
33 1 10 0 15 0
36 1 0 1 15 0
Thereafter the plates were retrieved and growth determined. The diameter of each
growth was then determined using a ruler in two perpendicular directions and results
recorded. The mean diameter was calculated. the growth of each isolate was also determined
relative to the controls. the results were then compiled.
Results
Project 2.2: Field Assessment
Survey data for row number four for Riesling grapevine variety. The results for field
assessment are for BBR and PM.
Botrytis Bunch Rot (BBR)
The tables represent data obtained from row 4 and show the percentage number of
fruits that were affected by BBR in a single bunch of grapes per vine. A total of five bunches
were analyzed in each bunch. For instance, grapevine number 9 had a 15% BBR infection in
bunch number 1 while it has a 10% infection in bunch 2.
Bunch
Vine 1 2 3 4 5
3 0 0 0 0 0
6 0 30 0 0 0
9 15 10 15 15 15
12 0 5 0 0 10
15 15 0 0 5 0
18 5 0 0 0 0
21 5 0 0 10 10
24 30 0 15 0 10
27 10 15 0 0 10
30 40 0 0 15 10
33 1 10 0 15 0
36 1 0 1 15 0
Paraphrase This Document
Need a fresh take? Get an instant paraphrase of this document with our AI Paraphraser
FUNGAL INFECTION 8
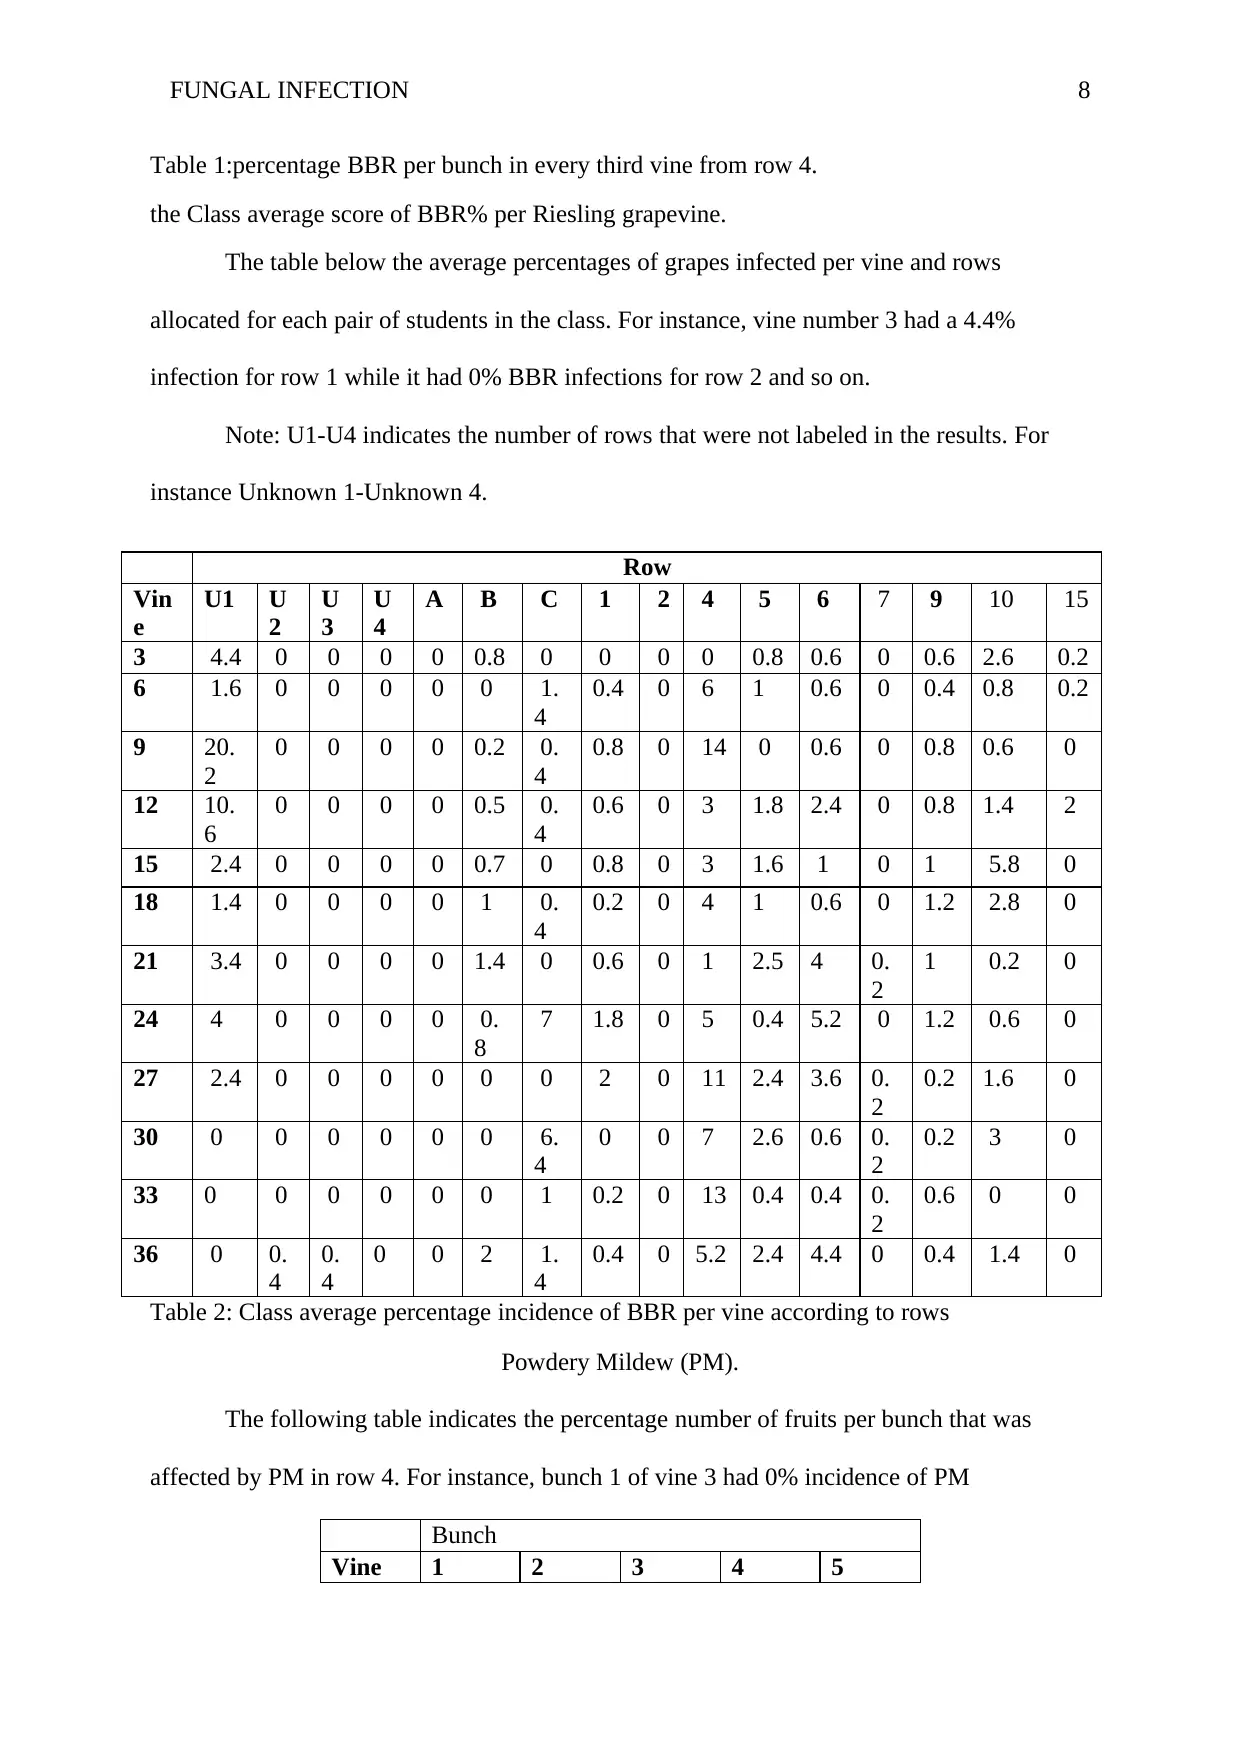
Table 1:percentage BBR per bunch in every third vine from row 4.
the Class average score of BBR% per Riesling grapevine.
The table below the average percentages of grapes infected per vine and rows
allocated for each pair of students in the class. For instance, vine number 3 had a 4.4%
infection for row 1 while it had 0% BBR infections for row 2 and so on.
Note: U1-U4 indicates the number of rows that were not labeled in the results. For
instance Unknown 1-Unknown 4.
Row
Vin
e
U1 U
2
U
3
U
4
A B C 1 2 4 5 6 7 9 10 15
3 4.4 0 0 0 0 0.8 0 0 0 0 0.8 0.6 0 0.6 2.6 0.2
6 1.6 0 0 0 0 0 1.
4
0.4 0 6 1 0.6 0 0.4 0.8 0.2
9 20.
2
0 0 0 0 0.2 0.
4
0.8 0 14 0 0.6 0 0.8 0.6 0
12 10.
6
0 0 0 0 0.5 0.
4
0.6 0 3 1.8 2.4 0 0.8 1.4 2
15 2.4 0 0 0 0 0.7 0 0.8 0 3 1.6 1 0 1 5.8 0
18 1.4 0 0 0 0 1 0.
4
0.2 0 4 1 0.6 0 1.2 2.8 0
21 3.4 0 0 0 0 1.4 0 0.6 0 1 2.5 4 0.
2
1 0.2 0
24 4 0 0 0 0 0.
8
7 1.8 0 5 0.4 5.2 0 1.2 0.6 0
27 2.4 0 0 0 0 0 0 2 0 11 2.4 3.6 0.
2
0.2 1.6 0
30 0 0 0 0 0 0 6.
4
0 0 7 2.6 0.6 0.
2
0.2 3 0
33 0 0 0 0 0 0 1 0.2 0 13 0.4 0.4 0.
2
0.6 0 0
36 0 0.
4
0.
4
0 0 2 1.
4
0.4 0 5.2 2.4 4.4 0 0.4 1.4 0
Table 2: Class average percentage incidence of BBR per vine according to rows
Powdery Mildew (PM).
The following table indicates the percentage number of fruits per bunch that was
affected by PM in row 4. For instance, bunch 1 of vine 3 had 0% incidence of PM
Bunch
Vine 1 2 3 4 5
FUNGAL INFECTION 9
3 0 0 0 0 0
6 0 0 0 0 0
9 0 0 0 0 0
12 0 0 0 0 0
15 0 0 0 0 0
18 0 0 0 0 0
21 0 0 0 0 0
24 0 0 0 0 0
27 0 0 0 0 0
30 0 0 0 0 0
33 0 0 0 0 0
36 0 0 0 0 0
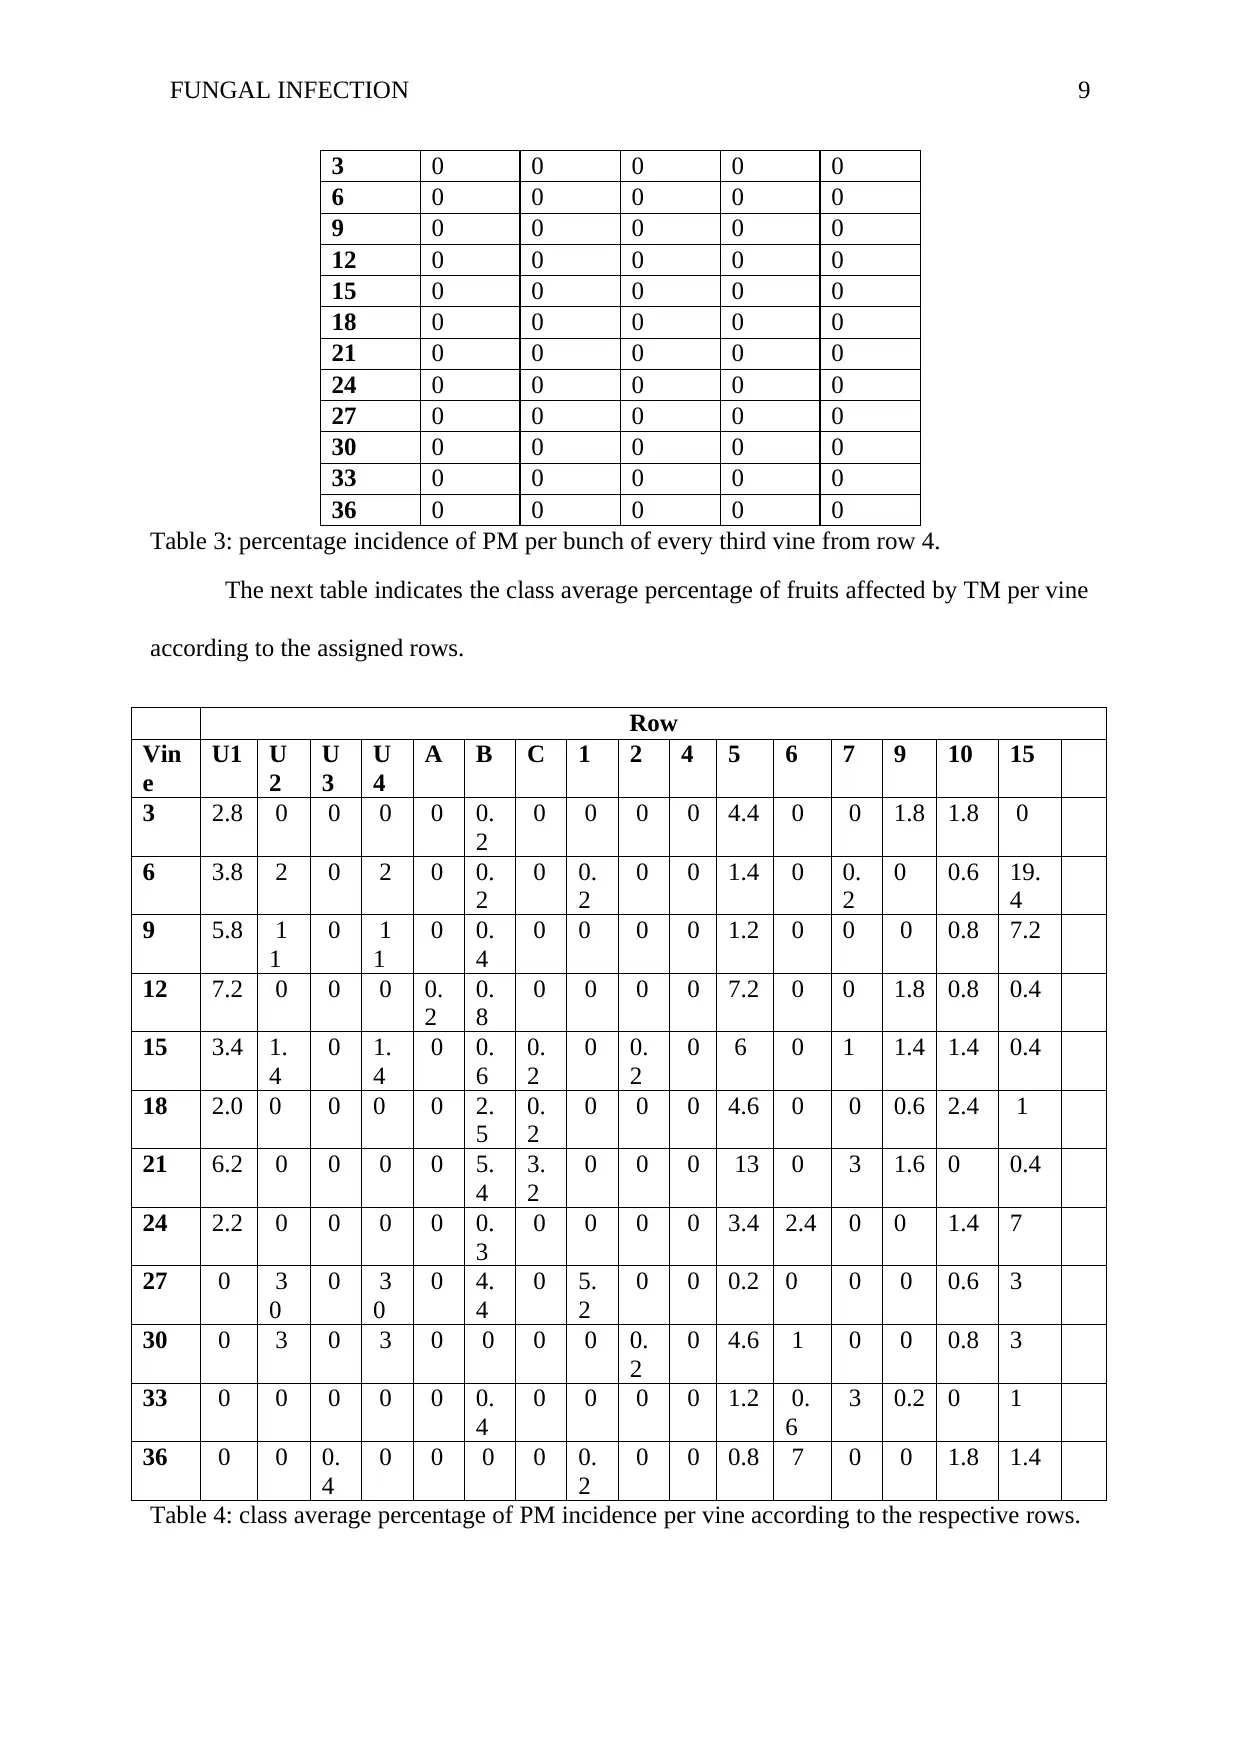
Table 3: percentage incidence of PM per bunch of every third vine from row 4.
The next table indicates the class average percentage of fruits affected by TM per vine
according to the assigned rows.
Row
Vin
e
U1 U
2
U
3
U
4
A B C 1 2 4 5 6 7 9 10 15
3 2.8 0 0 0 0 0.
2
0 0 0 0 4.4 0 0 1.8 1.8 0
6 3.8 2 0 2 0 0.
2
0 0.
2
0 0 1.4 0 0.
2
0 0.6 19.
4
9 5.8 1
1
0 1
1
0 0.
4
0 0 0 0 1.2 0 0 0 0.8 7.2
12 7.2 0 0 0 0.
2
0.
8
0 0 0 0 7.2 0 0 1.8 0.8 0.4
15 3.4 1.
4
0 1.
4
0 0.
6
0.
2
0 0.
2
0 6 0 1 1.4 1.4 0.4
18 2.0 0 0 0 0 2.
5
0.
2
0 0 0 4.6 0 0 0.6 2.4 1
21 6.2 0 0 0 0 5.
4
3.
2
0 0 0 13 0 3 1.6 0 0.4
24 2.2 0 0 0 0 0.
3
0 0 0 0 3.4 2.4 0 0 1.4 7
27 0 3
0
0 3
0
0 4.
4
0 5.
2
0 0 0.2 0 0 0 0.6 3
30 0 3 0 3 0 0 0 0 0.
2
0 4.6 1 0 0 0.8 3
33 0 0 0 0 0 0.
4
0 0 0 0 1.2 0.
6
3 0.2 0 1
36 0 0 0.
4
0 0 0 0 0.
2
0 0 0.8 7 0 0 1.8 1.4
Table 4: class average percentage of PM incidence per vine according to the respective rows.
3 0 0 0 0 0
6 0 0 0 0 0
9 0 0 0 0 0
12 0 0 0 0 0
15 0 0 0 0 0
18 0 0 0 0 0
21 0 0 0 0 0
24 0 0 0 0 0
27 0 0 0 0 0
30 0 0 0 0 0
33 0 0 0 0 0
36 0 0 0 0 0
Table 3: percentage incidence of PM per bunch of every third vine from row 4.
The next table indicates the class average percentage of fruits affected by TM per vine
according to the assigned rows.
Row
Vin
e
U1 U
2
U
3
U
4
A B C 1 2 4 5 6 7 9 10 15
3 2.8 0 0 0 0 0.
2
0 0 0 0 4.4 0 0 1.8 1.8 0
6 3.8 2 0 2 0 0.
2
0 0.
2
0 0 1.4 0 0.
2
0 0.6 19.
4
9 5.8 1
1
0 1
1
0 0.
4
0 0 0 0 1.2 0 0 0 0.8 7.2
12 7.2 0 0 0 0.
2
0.
8
0 0 0 0 7.2 0 0 1.8 0.8 0.4
15 3.4 1.
4
0 1.
4
0 0.
6
0.
2
0 0.
2
0 6 0 1 1.4 1.4 0.4
18 2.0 0 0 0 0 2.
5
0.
2
0 0 0 4.6 0 0 0.6 2.4 1
21 6.2 0 0 0 0 5.
4
3.
2
0 0 0 13 0 3 1.6 0 0.4
24 2.2 0 0 0 0 0.
3
0 0 0 0 3.4 2.4 0 0 1.4 7
27 0 3
0
0 3
0
0 4.
4
0 5.
2
0 0 0.2 0 0 0 0.6 3
30 0 3 0 3 0 0 0 0 0.
2
0 4.6 1 0 0 0.8 3
33 0 0 0 0 0 0.
4
0 0 0 0 1.2 0.
6
3 0.2 0 1
36 0 0 0.
4
0 0 0 0 0.
2
0 0 0.8 7 0 0 1.8 1.4
Table 4: class average percentage of PM incidence per vine according to the respective rows.
⊘ This is a preview!⊘
Do you want full access?
Subscribe today to unlock all pages.
Trusted by 1+ million students worldwide
FUNGAL INFECTION 10
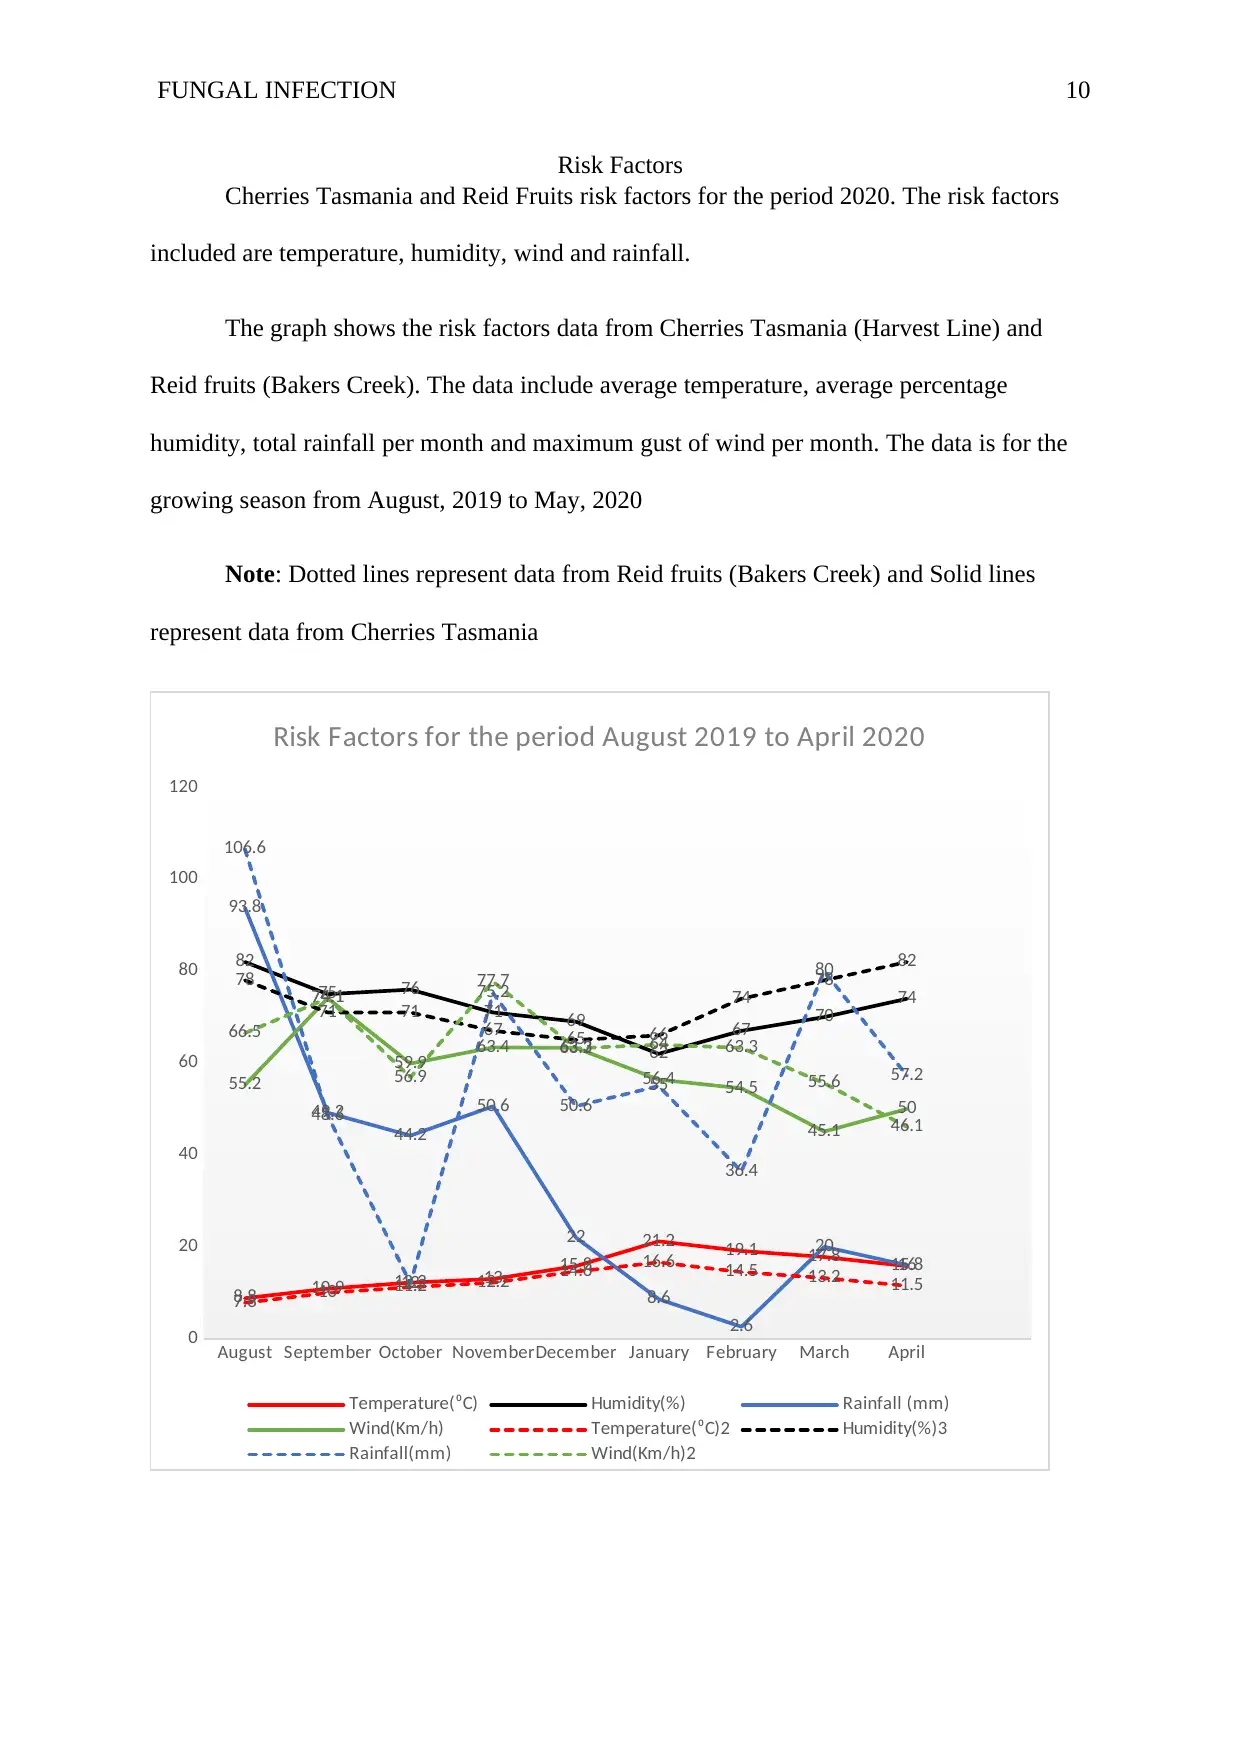
Risk Factors
Cherries Tasmania and Reid Fruits risk factors for the period 2020. The risk factors
included are temperature, humidity, wind and rainfall.
The graph shows the risk factors data from Cherries Tasmania (Harvest Line) and
Reid fruits (Bakers Creek). The data include average temperature, average percentage
humidity, total rainfall per month and maximum gust of wind per month. The data is for the
growing season from August, 2019 to May, 2020
Note: Dotted lines represent data from Reid fruits (Bakers Creek) and Solid lines
represent data from Cherries Tasmania
August September October NovemberDecember January February March April
0
20
40
60
80
100
120
8.8 10.9 12.2 13 15.8
21.2 19.1 17.8 15.8
82
75 76
71 69
62
67 70 74
93.8
49.2
44.2
50.6
22
8.6
2.6
20 16
55.2
74.1
59.9 63.4 63.3
56.4 54.5
45.1
50
7.8 10 11.2 12.2 14.6 16.6 14.5 13.2 11.5
78
71 71 67 65 66
74 78 82
106.6
48.6
12
75.2
50.6
55
36.4
80
57.2
66.5
74.1
56.9
77.7
63.2 64 63.3
55.6
46.1
Risk Factors for the period August 2019 to April 2020
Temperature(⁰C) Humidity(%) Rainfall (mm)
Wind(Km/h) Temperature(⁰C)2 Humidity(%)3
Rainfall(mm) Wind(Km/h)2
Paraphrase This Document
Need a fresh take? Get an instant paraphrase of this document with our AI Paraphraser
FUNGAL INFECTION 11
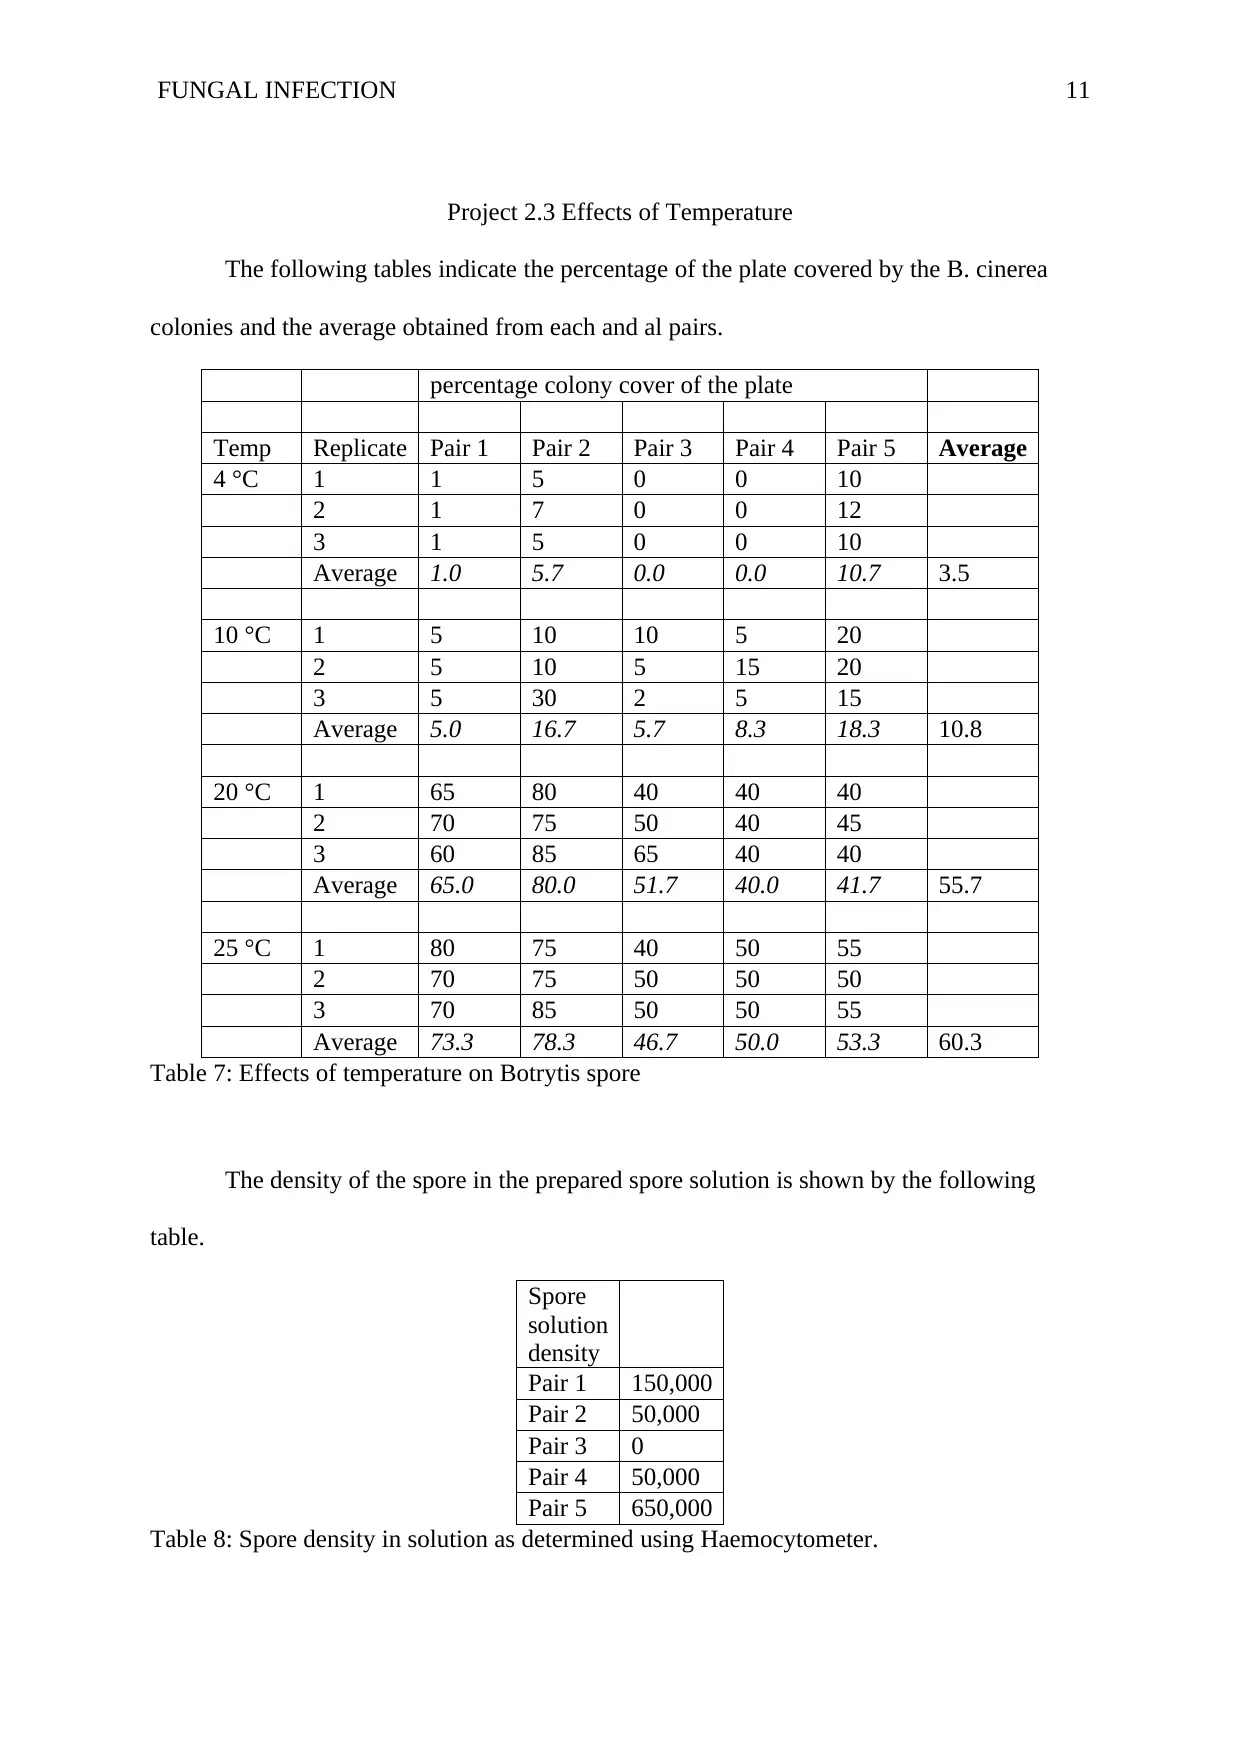
Project 2.3 Effects of Temperature
The following tables indicate the percentage of the plate covered by the B. cinerea
colonies and the average obtained from each and al pairs.
percentage colony cover of the plate
Temp Replicate Pair 1 Pair 2 Pair 3 Pair 4 Pair 5 Average
4 °C 1 1 5 0 0 10
2 1 7 0 0 12
3 1 5 0 0 10
Average 1.0 5.7 0.0 0.0 10.7 3.5
10 °C 1 5 10 10 5 20
2 5 10 5 15 20
3 5 30 2 5 15
Average 5.0 16.7 5.7 8.3 18.3 10.8
20 °C 1 65 80 40 40 40
2 70 75 50 40 45
3 60 85 65 40 40
Average 65.0 80.0 51.7 40.0 41.7 55.7
25 °C 1 80 75 40 50 55
2 70 75 50 50 50
3 70 85 50 50 55
Average 73.3 78.3 46.7 50.0 53.3 60.3
Table 7: Effects of temperature on Botrytis spore
The density of the spore in the prepared spore solution is shown by the following
table.
Spore
solution
density
Pair 1 150,000
Pair 2 50,000
Pair 3 0
Pair 4 50,000
Pair 5 650,000
Table 8: Spore density in solution as determined using Haemocytometer.
FUNGAL INFECTION 12
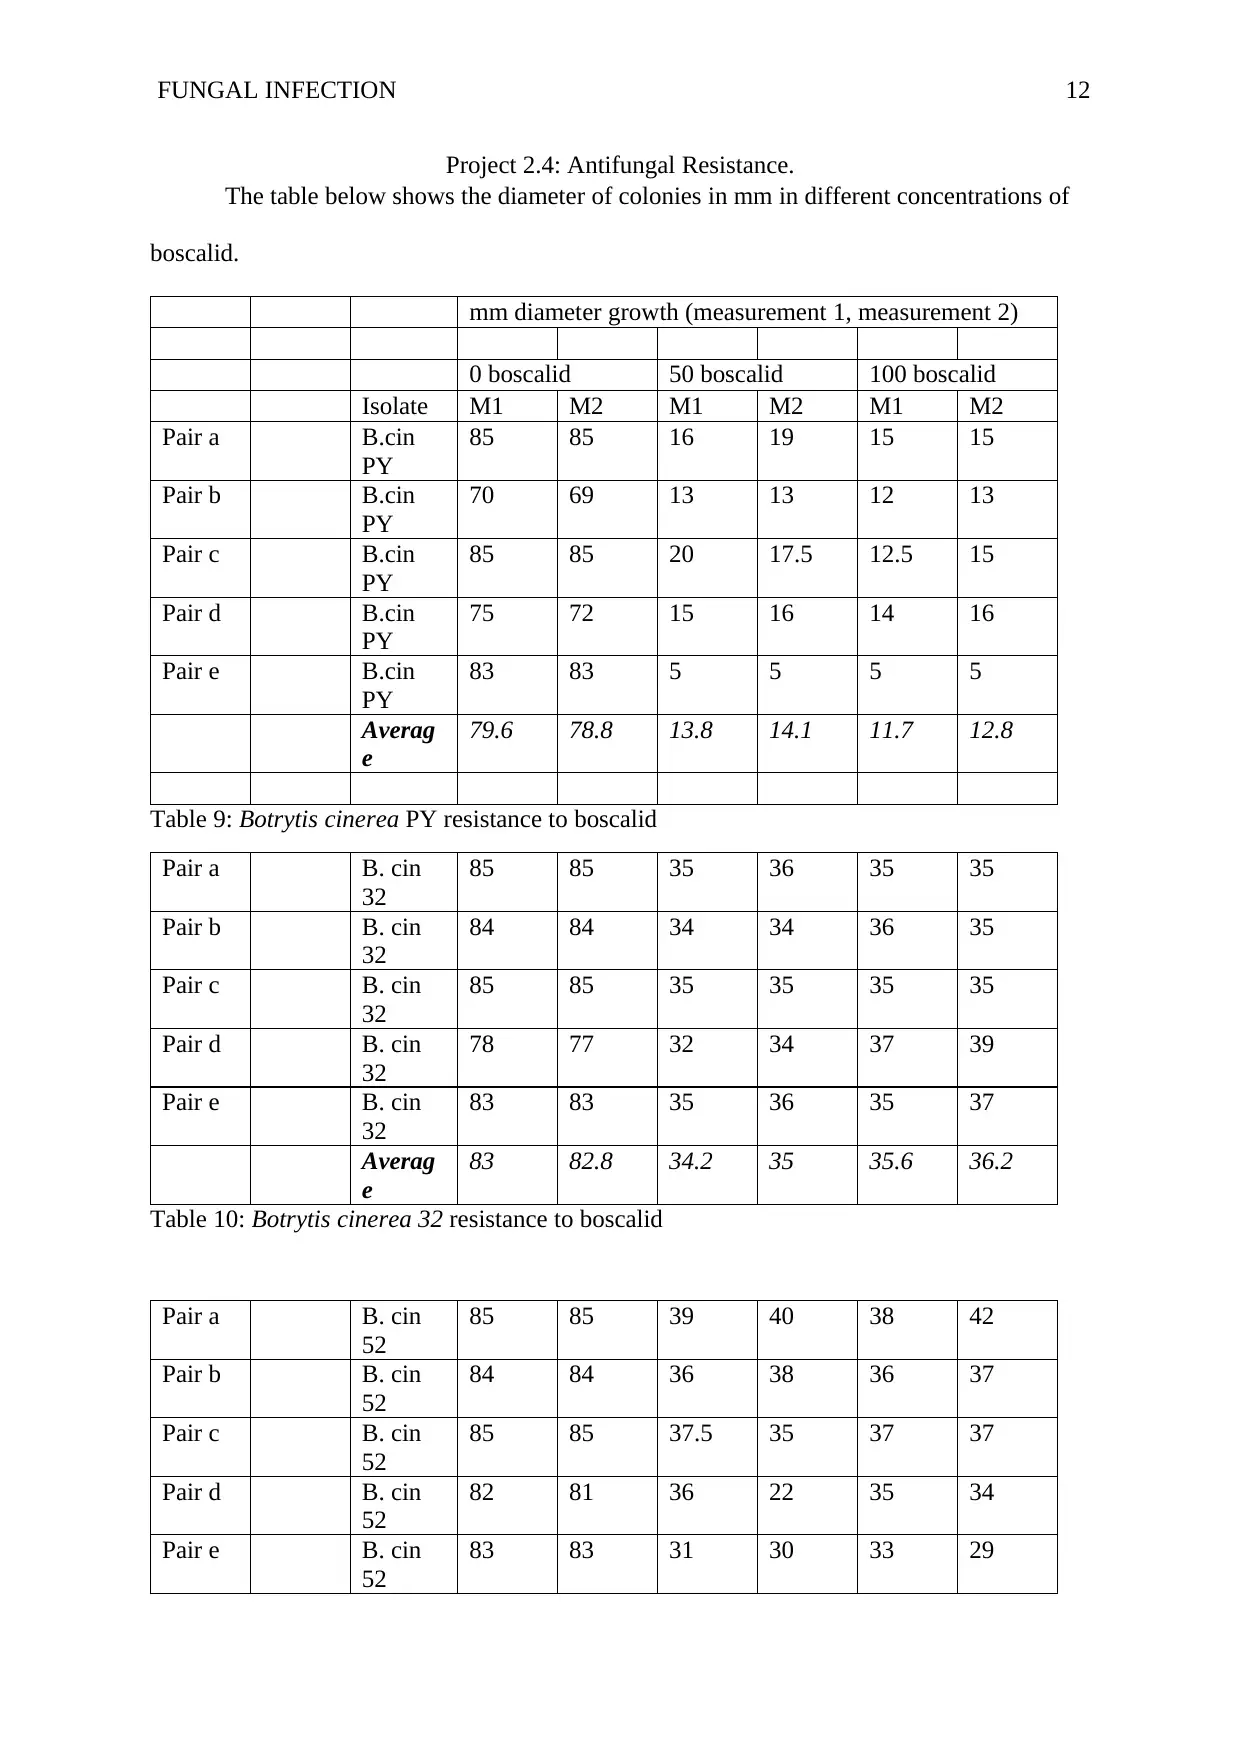
Project 2.4: Antifungal Resistance.
The table below shows the diameter of colonies in mm in different concentrations of
boscalid.
mm diameter growth (measurement 1, measurement 2)
0 boscalid 50 boscalid 100 boscalid
Isolate M1 M2 M1 M2 M1 M2
Pair a B.cin
PY
85 85 16 19 15 15
Pair b B.cin
PY
70 69 13 13 12 13
Pair c B.cin
PY
85 85 20 17.5 12.5 15
Pair d B.cin
PY
75 72 15 16 14 16
Pair e B.cin
PY
83 83 5 5 5 5
Averag
e
79.6 78.8 13.8 14.1 11.7 12.8
Table 9: Botrytis cinerea PY resistance to boscalid
Pair a B. cin
32
85 85 35 36 35 35
Pair b B. cin
32
84 84 34 34 36 35
Pair c B. cin
32
85 85 35 35 35 35
Pair d B. cin
32
78 77 32 34 37 39
Pair e B. cin
32
83 83 35 36 35 37
Averag
e
83 82.8 34.2 35 35.6 36.2
Table 10: Botrytis cinerea 32 resistance to boscalid
Pair a B. cin
52
85 85 39 40 38 42
Pair b B. cin
52
84 84 36 38 36 37
Pair c B. cin
52
85 85 37.5 35 37 37
Pair d B. cin
52
82 81 36 22 35 34
Pair e B. cin
52
83 83 31 30 33 29
⊘ This is a preview!⊘
Do you want full access?
Subscribe today to unlock all pages.
Trusted by 1+ million students worldwide
1 out of 19
Your All-in-One AI-Powered Toolkit for Academic Success.
+13062052269
info@desklib.com
Available 24*7 on WhatsApp / Email
![[object Object]](/_next/static/media/star-bottom.7253800d.svg)
Unlock your academic potential
Copyright © 2020–2026 A2Z Services. All Rights Reserved. Developed and managed by ZUCOL.