Fynapa System: Object Modelling and Analysis Report - ITC 508

Verified

Added on  2022/08/23

|17
|2937
|26
Report
AI Summary
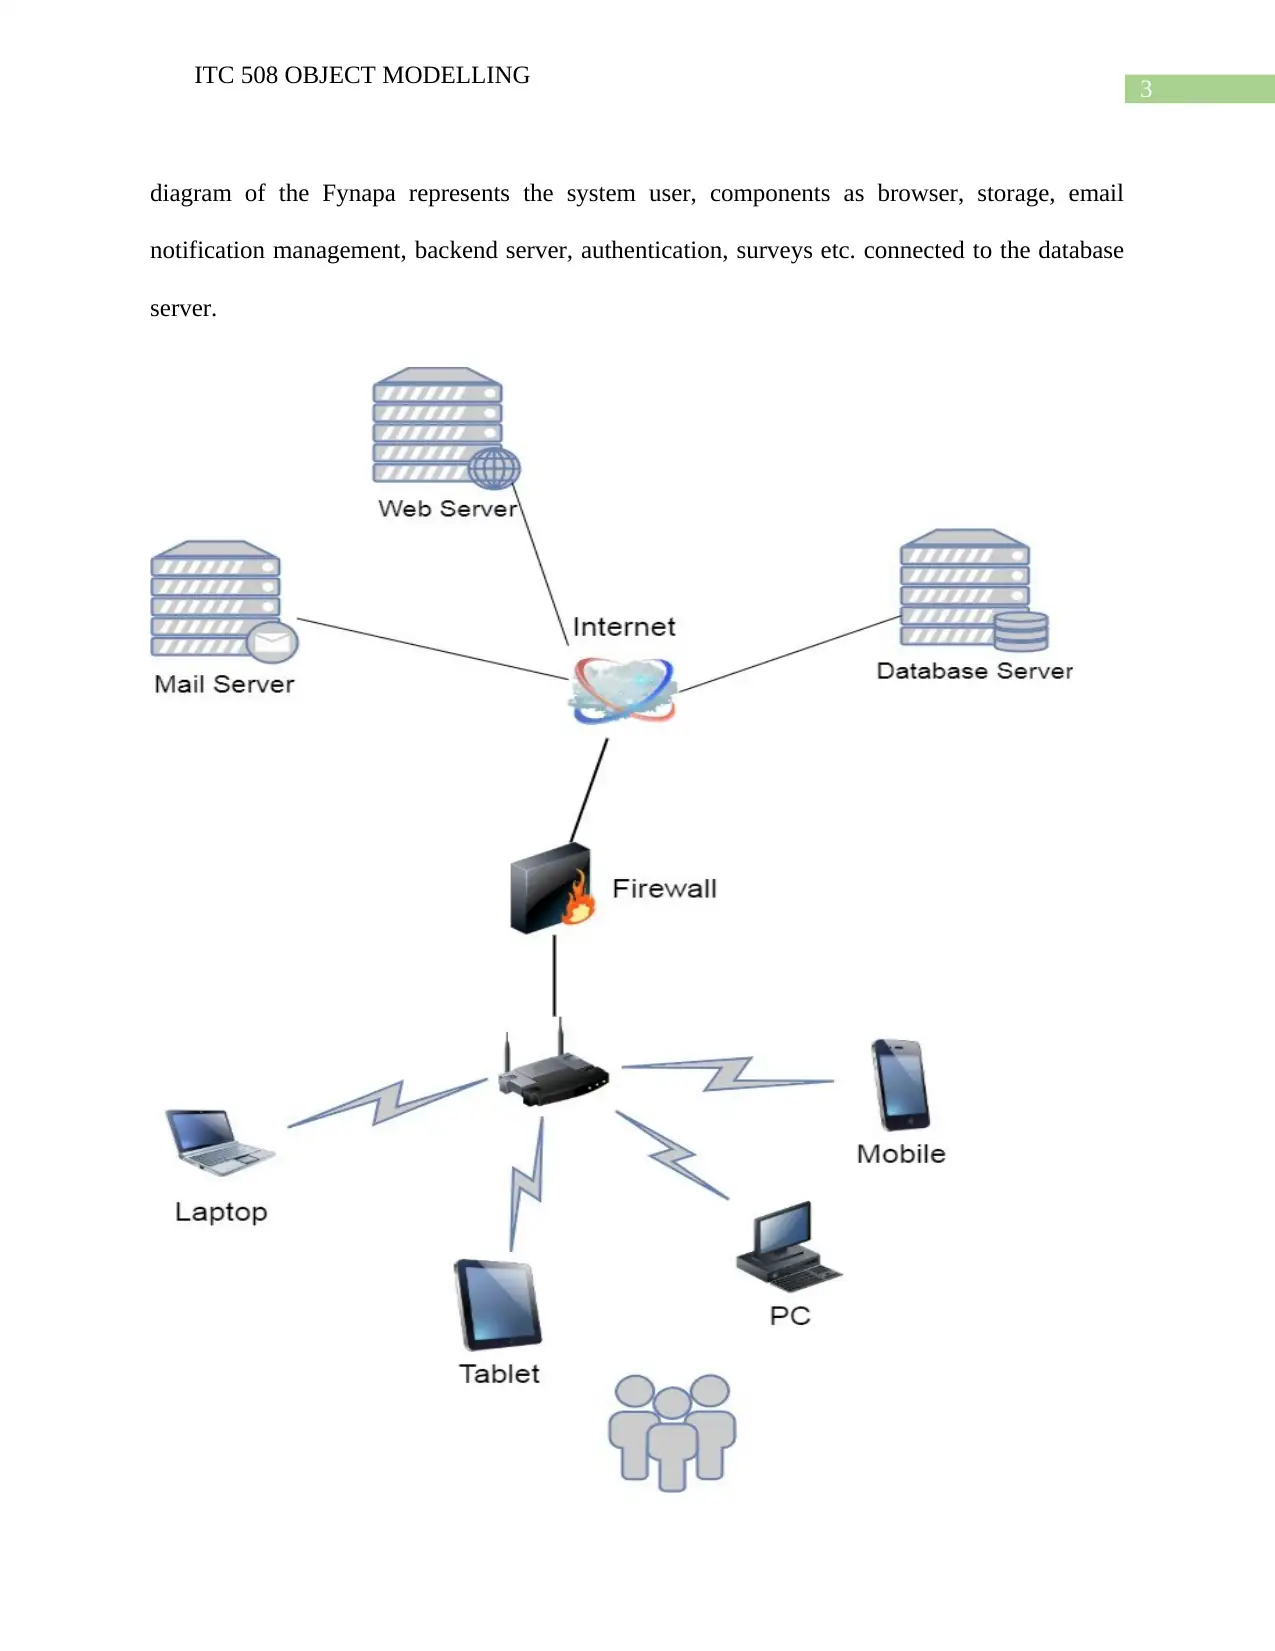
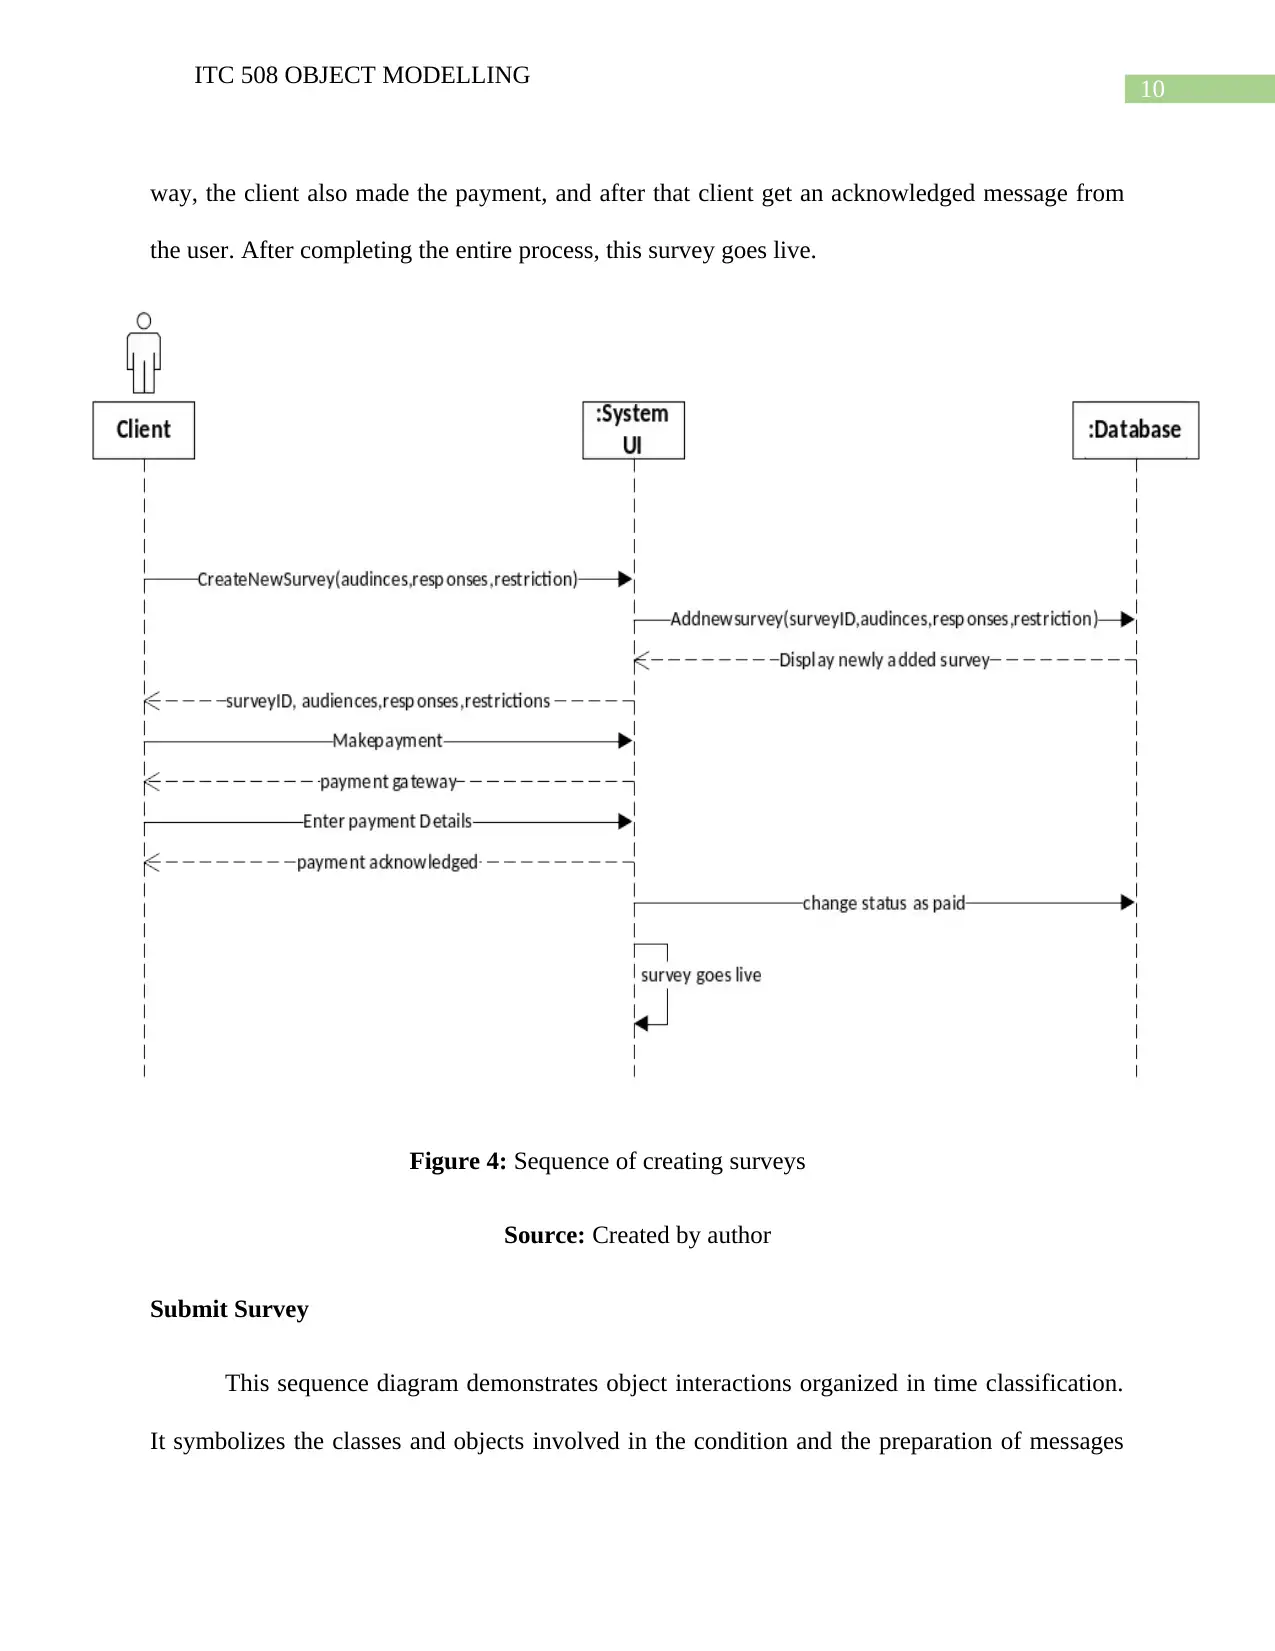
This report provides a comprehensive analysis of the Fynapa system using object modelling techniques. It begins with an overview of the system architecture, detailing important hardware and software components like database and web servers. The report then explores principles of good UI design, emphasizing usability, consistency, clarity, invisibility, and user-friendliness. Mockup diagrams illustrate key web interface elements. Use case realization is achieved through the identification and selection of use cases, specifically 'create survey' and 'submit survey.' Interaction diagrams, including sequence and communication diagrams, are developed to visualize object interactions and message exchanges within these use cases. The sequence diagrams illustrate the step-by-step processes for creating and submitting surveys, while the communication diagrams depict the interactions between clients, system interfaces, and databases. References to relevant academic sources are also included.
tabler-icon-diamond-filled.svg

Contribute Materials

Your contribution can guide someone’s learning journey. Share your documents today.
Document Page
ITC 508 OBJECT MODELLING
OBJECT MODELLING AND ANALYSIS
Name of the Student
Name of the University
Author Notes
tabler-icon-diamond-filled.svg

Secure Best Marks with AI Grader

Need help grading? Try our AI Grader for instant feedback on your assignments.
Document Page
1
ITC 508 OBJECT MODELLING
Table of Contents
System Architecture.........................................................................................................................2
Important hardware and software components............................................................................2
Architecture Diagram..................................................................................................................2
Principles of good UI design...........................................................................................................3
Story Boards (Mockup)...............................................................................................................5
Use case realization.........................................................................................................................8
Use case identification and Selection..........................................................................................8
Interaction Diagram.........................................................................................................................9
Sequence Diagram.......................................................................................................................9
Communication Diagram...........................................................................................................12
References......................................................................................................................................15
Document Page
2
ITC 508 OBJECT MODELLING
System Architecture
Important hardware and software components
The important hardware and software requirements for the architecture of system
depends on the type of the user interface. The architecture diagram for the system is also shown
in figure 1. Different hardware and software components are discussed below:
i. Database server: The term database server can be referred to the hardware and software
both. Both components construct the database used for the system. Here the system
database server is the composition of the server and database storage (Angrish et al.,
2017). All the information retrieved and stored is located in the database storage of the
system.
ii. Web server: Web server is a dedicated software stored in the computer Hardware for the
web browser. It processes the HTTP through the server to the browser. The web server
provides the connectivity of the World Wide Web to the browser and the database server.
iii. Web Brower: Web browser is software component of a system architecture which
processes the HTTP and web pages to run on the browser (Connolly, 2015). The UI is
visible on the web browser as web application for the Fynapa Company.
Architecture Diagram
An architecture diagram of the system represents the architectural design of the system
consisting of different objects, process, network components and users. The architectural
diagram of the Fynapa Company is based on the web system and the components are based on
the requirement for forming web forms interface (Drozdova et al., 2016). The architecture
Document Page
3
ITC 508 OBJECT MODELLING
diagram of the Fynapa represents the system user, components as browser, storage, email
notification management, backend server, authentication, surveys etc. connected to the database
server.
tabler-icon-diamond-filled.svg

Secure Best Marks with AI Grader

Need help grading? Try our AI Grader for instant feedback on your assignments.
Document Page
4
ITC 508 OBJECT MODELLING
Figure 1: Architecture diagram of Fynapa System
Source: Created by author
Principles of good UI design
A good user interface design can depend on the functionality of the system. The Fynapa
Company provides marketing research with the help of the surveys. The functionality of the
system is to provide access to the clients to create there customized surveys which gets filled by
the panelist in the system (Shneiderman et al., 2016). The surveys will be available on the
websites hence the design will be basically as web forms. A web form consists of several types
of inputs and buttons. The inputs method can be vary from text box, radio button, combo box,
rich text b, integer etc. to achieve a high quality user interface the main principle should be user
centric. However the principles of achieving a good UI design are discussed below:
Usability: The UI should meet all the usability requirements of the users in order to
satisfy customers for services. It means that the all the requirements should be fulfilled by
the system and should be available to the user (Quesenbery, 2014). The usability is the
main aim of any organization.
Consistency: Thu UI design should be consistent even if there new tasks are coming in
the system created by the user. The design binds the user to focus on the features of the
website (Roldán-Álvarez et al., 2016). The design should direct to the functionalities
without wasting any time.
Clarity: clarity is the main feature of the interface where the system and its function
should be recognizable by the user. There should not be any confusion regarding
understanding the functions or findings the features by the user. If the user understand the
Document Page
5
ITC 508 OBJECT MODELLING
interaction at the first time of interaction, then the design possesses the high clarity of
details (Al-Qeisi et al., 2014). Clear screens and info graphics are better than the messy
images floating around the web frame.
Invisibility: It is the popular belief in the system design is that the invisibility is the
important aspects of the interaction inn terms of making visible only the functionalities so
the user can focus on the aim without distracting from the interface components
(Gustafson, 2015).
Friendly: The design should be user friendly and responsive in nature. If a user does not
understand the interaction fully at the first time then the UI system should be easily
learned by the user. This represents the friendliness of the interface design.
There are multiple several other important aspects of having good UI design. However
the mockup diagrams of the two most important identified use cases, create survey and submit
survey are shown in figure 2 and 3.
Story Boards (Mockup)
A story board in a mockup design is set of info graphics, that provides the total
illustrations of what is happening in the scenario. The two selected use cases have been
considered for making the below mock up diagrams explaining the web interface of the website.
Story board consist the user interface of the creating surveys by the client and the filling surveys
by the panelists of the system.
Document Page
6
ITC 508 OBJECT MODELLING
Figure 2: Interface Design
Source: Created by author
tabler-icon-diamond-filled.svg

Paraphrase This Document

Need a fresh take? Get an instant paraphrase of this document with our AI Paraphraser
Document Page
7
ITC 508 OBJECT MODELLING
Figure 3: Interface design
Source: Created by author
Document Page
8
ITC 508 OBJECT MODELLING
Use case realization
The use case realization for the Fynapa Company has been done with the help of
identification and selection of suitable use case and developing the sequence and communion
diagram for it.
Use case identification and Selection
Survey creation use case
In this diagram are describing the survey creation form. Initially, the client tries to log in
to their account and put their username name and password correctly (de Sousa et al., 2017).
After completing the successful login, the user enters for a survey from creation. The client
creates the study, and they choose their desired number of responses. The client also tries to set a
targeted audience and participant restriction. When the client establishes the survey from then,
they focus on choosing the categories of questions and setting expiry dates (Fauzan et al., 2019).
When the client completes the study, then they make payment to the panelist. After finishing the
successful payment, this survey goes live, and the panelist receives the notification on the new
survey.
Survey participation use case
This use case is describing the job of the panelist in survey participation. At first, the
panelist receives the email notification after finishing the survey form. When the panelist
receives information, then they put a survey topic in the way (Kini, A., Hegde, G., & Vittal,
2017). The panelist opens the survey link and continues it till the link expiry. The link is open,
and the panelist fills it as per the instruction. When the filling is complete successfully, they
Document Page
9
ITC 508 OBJECT MODELLING
submit it. The panelist may complete this survey in one sitting or take a long time. After the
successful completion, the panelist may receive the reward.
The two important use case are selected considering the main functionality of the system
which are the creating and submitting surveys. On the basis of these use cases and with the help
of use case diagram sequence and communication diagram is developed and discussed below.
Interaction Diagram
Interaction diagrams are the part of the Unified Modeling Language. Sequence and
communication diagrams are the most widely used interaction diagram in System engineering.
Sequence Diagram
Create survey
This sequence diagram displays object interactions prepared in time categorization. It
represents the classes and objects involved in the situation and the arrangement of messages
exchanged between the objects desired to carry out the functionality of the scenario. This
sequence diagram depends on the system user interface, client, and database. Initially, the client
sends the credentials and login details to system UI (Campean & Yildirim, 2017). The user
interface send this detail to the database and check this credential details is correct or not. When
the database matched these login details, then they send the message, it is accurate. After that,
the user can allow entering the system. The client creates the survey and addresses these in the
database through the UI. The client set the audience and also set the restriction and expected
responses. The database store the survey facts and also save new survey details (Donnari et al.,
2019). The user interface collects the data and acknowledges the user for payment. In the same
tabler-icon-diamond-filled.svg

Secure Best Marks with AI Grader

Need help grading? Try our AI Grader for instant feedback on your assignments.
Document Page
10
ITC 508 OBJECT MODELLING
way, the client also made the payment, and after that client get an acknowledged message from
the user. After completing the entire process, this survey goes live.
Figure 4: Sequence of creating surveys
Source: Created by author
Submit Survey
This sequence diagram demonstrates object interactions organized in time classification.
It symbolizes the classes and objects involved in the condition and the preparation of messages
Document Page
11
ITC 508 OBJECT MODELLING
replaced between the objects desired to carry out the functionality of the scenario. This sequence
diagram depends on the system panelist, system UI, and database. Initially, the client sends the
credentials and login details to system UI. Primarily, and the panelist sends the credentials and
login details to system UI. The user interface send this detail to the database and check this
credential details is correct or not. The panelist gets an acknowledgment message from the
system UI in the time of authentication. This survey notification is dividing into two types, like
incomplete and complete (Longo, Nicoletti & Padovano, 2017). Every profile is screening by
system UI, and it validates this profile is complete or incomplete. Suppose the surveyor is not
fulfilling all data; then, these survey forms are incomplete. Then the database changes the profile
data and saves it updated data (Webb, 2017). After answering all questions, this survey is
complete, and the database collect this new survey data. After the survey submission, the
panelist receiving a reward faculty says database not required extra work is there from the
system UI, and the database also save this reward details.
Document Page
12
ITC 508 OBJECT MODELLING
Figure 5: Sequence diagram of submitting surveys
Source: Created by author
Communication Diagram
Create Survey
This communication diagram is an addition of object illustration that displays the objects
along with the messages that travel from one to other. This communication diagram are
describing about the connection between client, system interface and database (Zhang et al.,
2017). At first client enter the credential and logged in. The database match this credential is
correct or not, if correct then the user allow to open the survey from. The client create survey and
put the survey details according to the question. When the survey is complete then they add new
survey in a same way. After finishing the survey the client enter the payment details and
tabler-icon-diamond-filled.svg

Paraphrase This Document

Need a fresh take? Get an instant paraphrase of this document with our AI Paraphraser
Document Page
13
ITC 508 OBJECT MODELLING
complete the payment. When the payment is complete the client get an acknowledgement
message and then this survey is live.
Figure 6: communication diagram of creating surveys
Source: Created by author
Submit Survey
This communication diagram is an addition of object design that presents the objects
along with the messages that travel from one to another. This communication diagram are
relating about the link between panelist, system interface and database. At first the client sends
the authorizations ID and login details to system UI. Mostly, and the panelist sends the
credentials and login facts to system UI. The user interface send this detail to the database and
check this documentation details is exact or not (Schimka et al., 2017). The panelist gets an
acknowledgment message from the system UI in the time of authentication. Every survey profile
is screening by User Interface, and it authenticates this profile is complete or incomplete.
Document Page
14
ITC 508 OBJECT MODELLING
Suppose the surveyor is not answering all questions; then, these survey forms are incomplete.
Then the database modifies the profile data and saves it restructured data. After the complete
survey submission, the panelist getting a reward from the system UI, and the database also save
this reward facts.
Figure 7: communication diagram of submitting surveys
Source: Created by author
References
Al-Qeisi, K., Dennis, C., Alamanos, E., & Jayawardhena, C. (2014). Website design quality and
usage behavior: Unified Theory of Acceptance and Use of Technology. Journal of
Business Research, 67(11), 2282-2290.
Angrish, A., Starly, B., Lee, Y. S., & Cohen, P. H. (2017). A flexible data schema and system
architecture for the virtualization of manufacturing machines (VMM). Journal of
Manufacturing Systems, 45, 236-247.
Document Page
15
ITC 508 OBJECT MODELLING
Campean, I. F., & Yildirim, U. (2017). Enhanced sequence diagram for function modelling of
complex systems.
Connolly, R. (2015). Fundamentals of web development. Pearson Education.
de Sousa, T. C., Kelvin, L., Neto, C. D., & de Carvalho, C. G. N. (2017). A Formal Semantics
for Use Case Diagram Via Event-B. JSW, 12(3), 189-200.
Donnari, M., Pillepich, A., Nelson, D., Vogelsberger, M., Genel, S., Weinberger, R., ... &
Hernquist, L. (2019). The star formation activity of IllustrisTNG galaxies: main
sequence, UVJ diagram, quenched fractions, and systematics. Monthly Notices of the
Royal Astronomical Society, 485(4), 4817-4840.
Drozdova, M., Kardos, M., Kurillova, Z., & Bucko, B. (2016). Transformation in model driven
architecture. In Information Systems Architecture and Technology: Proceedings of 36th
International Conference on Information Systems Architecture and Technology–ISAT
2015–Part I (pp. 193-203). Springer, Cham.
Fauzan, R., Siahaan, D., Rochimah, S., & Triandini, E. (2019, July). Use Case Diagram
Similarity Measurement: A New Approach. In 2019 12th International Conference on
Information & Communication Technology and System (ICTS) (pp. 3-7). IEEE.
Gustafson, A. (2015). Adaptive web design: crafting rich experiences with progressive
enhancement. New Riders.
Kini, A., Hegde, G., & Vittal, A. J. (2017). Mapping of use cases to activity diagram for online
grocery management system.
tabler-icon-diamond-filled.svg

Secure Best Marks with AI Grader

Need help grading? Try our AI Grader for instant feedback on your assignments.
Document Page
16
ITC 508 OBJECT MODELLING
Longo, F., Nicoletti, L., & Padovano, A. (2017). Smart operators in industry 4.0: A human-
centered approach to enhance operators’ capabilities and competencies within the new
smart factory context. Computers & industrial engineering, 113, 144-159.
Quesenbery, W. (2014). The five dimensions of usability. In Content and complexity (pp. 93-
114). Routledge.
Roldán-Álvarez, D., Martín, E., García-Herranz, M., & Haya, P. A. (2016). Mind the gap:
Impact on learnability of user interface design of authoring tools for
teachers. International Journal of Human-Computer Studies, 94, 18-34.
Schimka, S., Gordievskaya, Y. D., Lomadze, N., Lehmann, M., von Klitzing, R., Rumyantsev,
A. M., ... & Santer, S. (2017). Communication: light driven remote control of microgels’
size in the presence of photosensitive surfactant: complete phase diagram. The Journal of
chemical physics, 147(3), 031101.
Shneiderman, B., Plaisant, C., Cohen, M., Jacobs, S., Elmqvist, N., & Diakopoulos, N.
(2016). Designing the user interface: strategies for effective human-computer interaction.
Pearson.
Webb, A. (2017). Project management for successful product innovation. Routledge.
Zhang, J., Chen, W., Gao, M., & Shen, G. (2017). K-means-clustering-based fiber nonlinearity
equalization techniques for 64-QAM coherent optical communication system. Optics
express, 25(22), 27570-27580.
chevron_up_icon
1 out of 17
circle_padding
hide_on_mobile
zoom_out_icon
logo.png

Your All-in-One AI-Powered Toolkit for Academic Success.

Available 24*7 on WhatsApp / Email

[object Object]