Comprehensive Financial and Economic Analysis of G4S Plc Performance
VerifiedAdded on  2023/04/21
|36
|6107
|293
Report
AI Summary
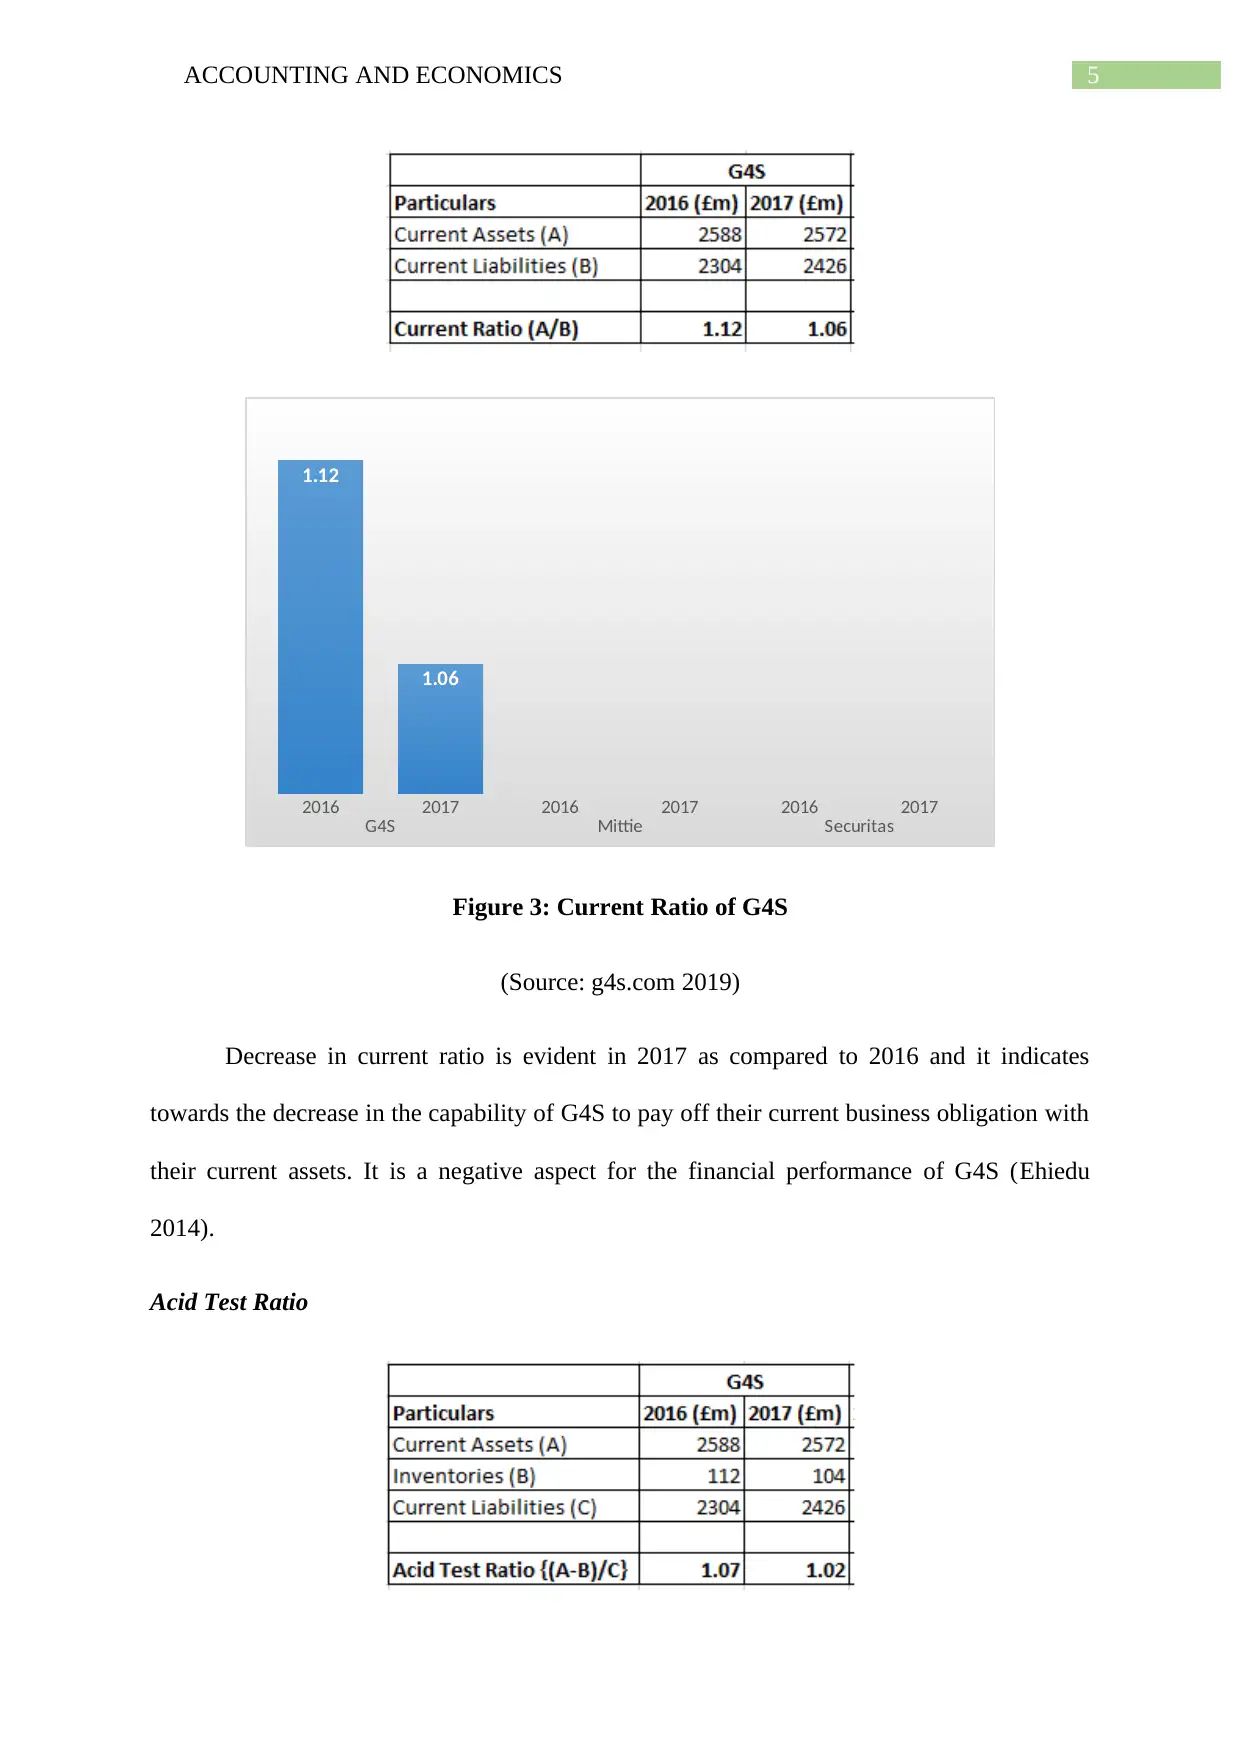
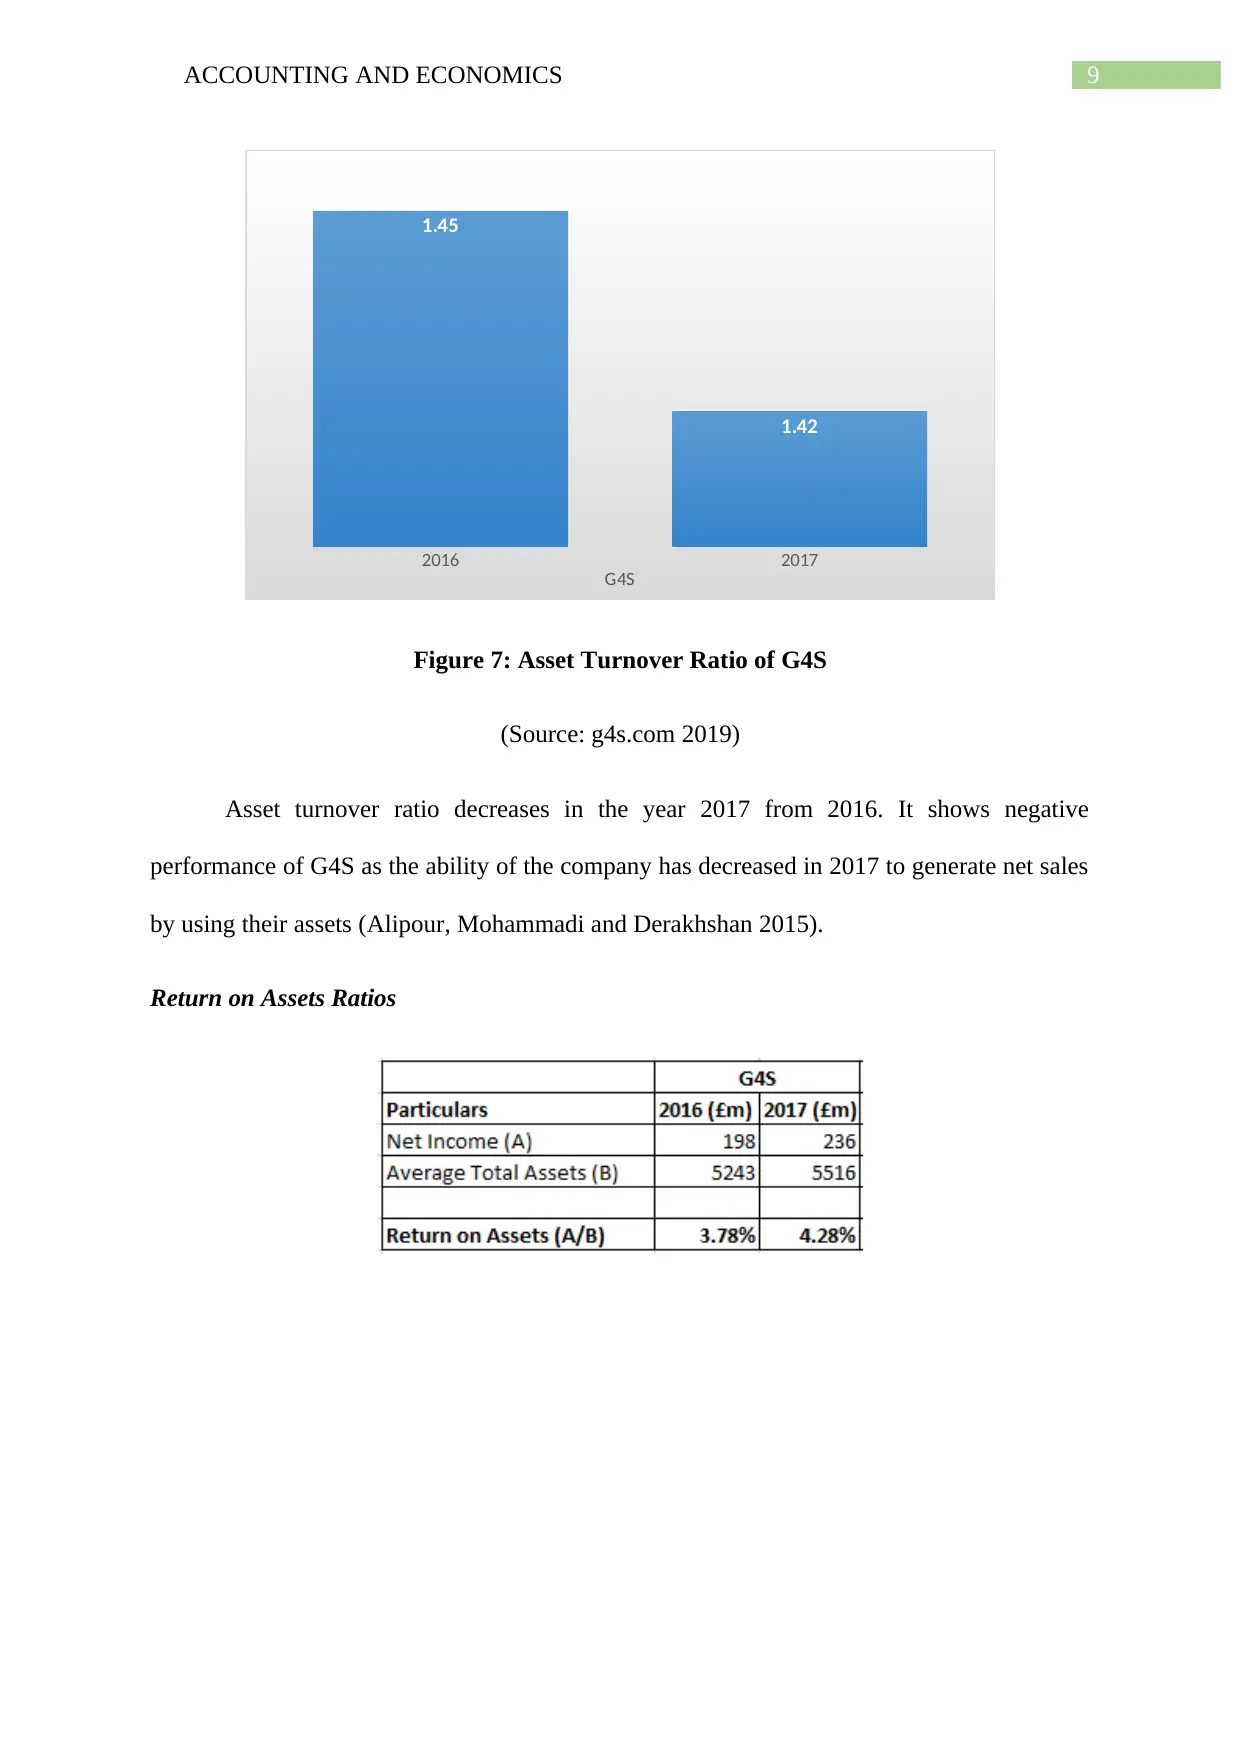
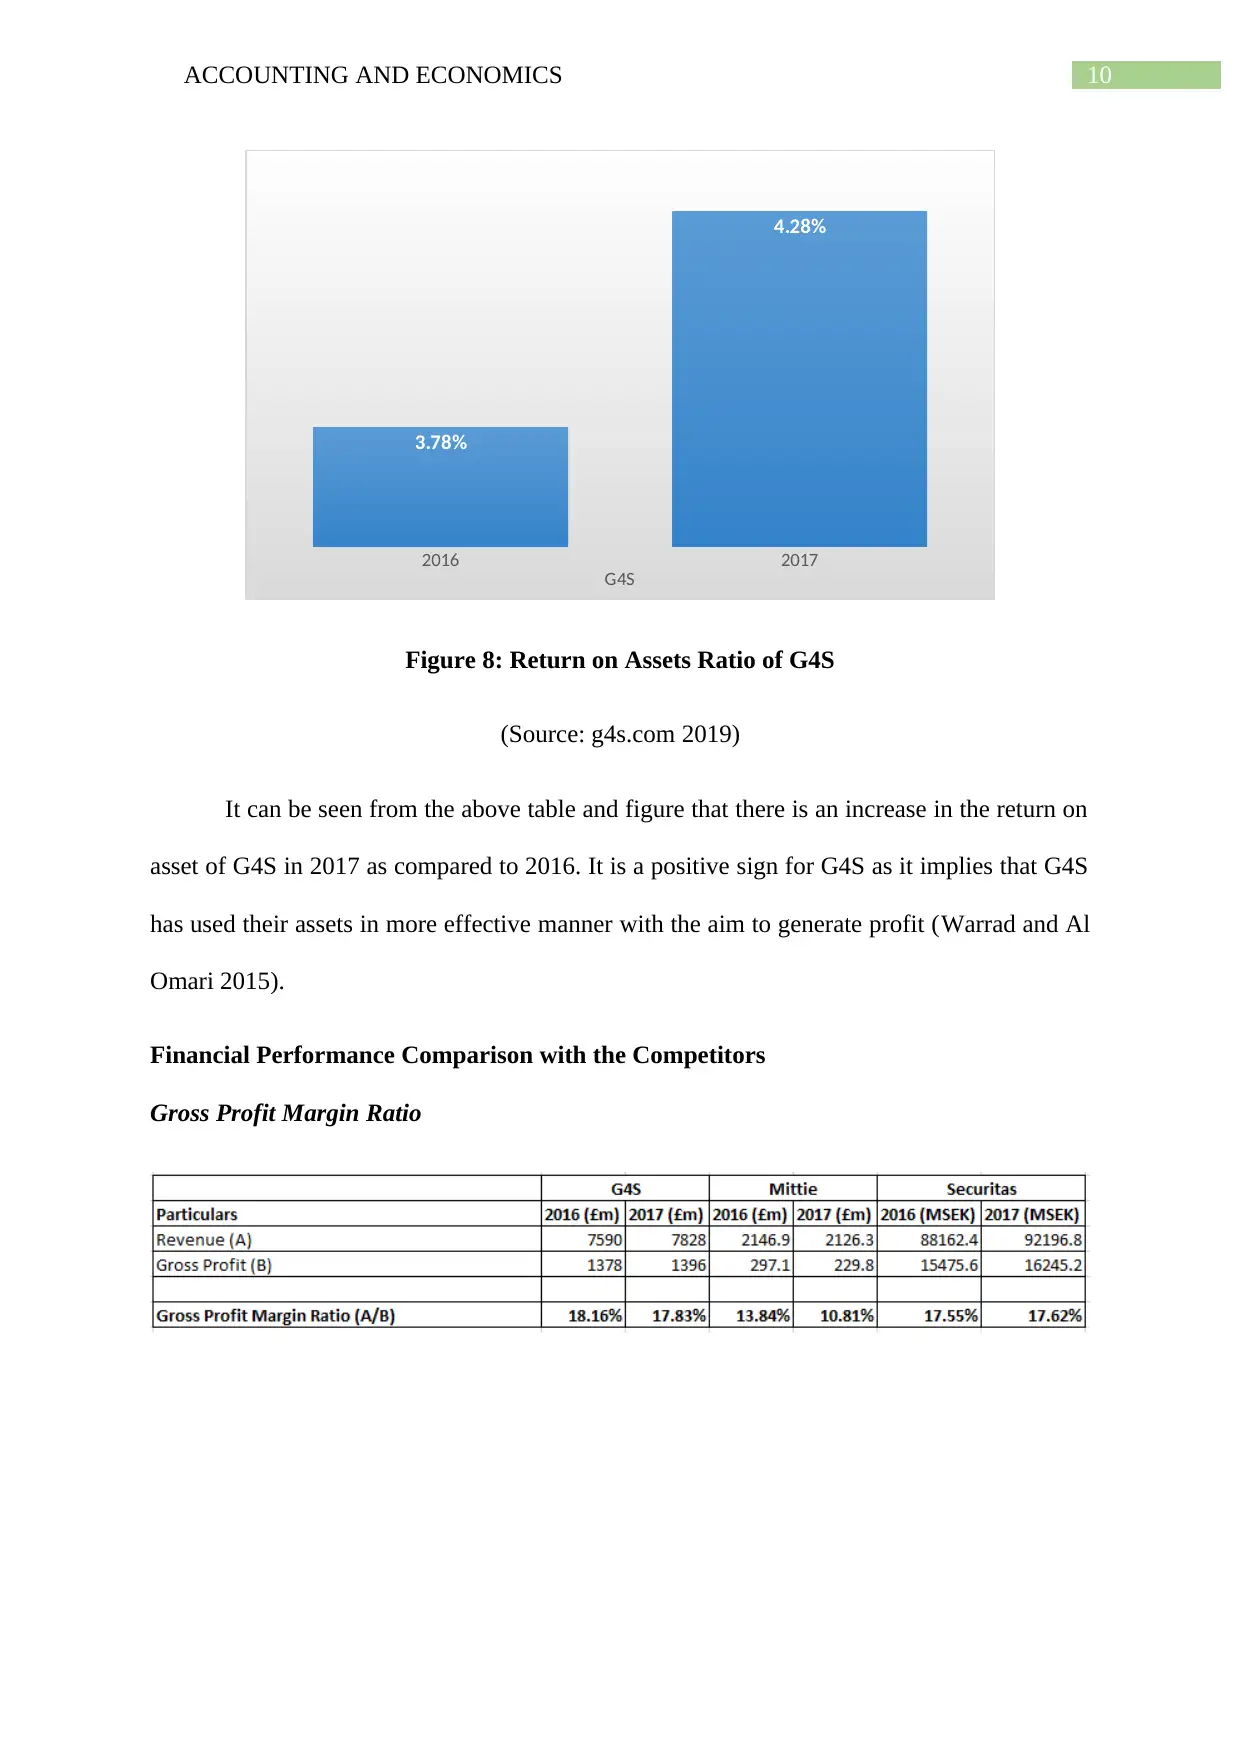
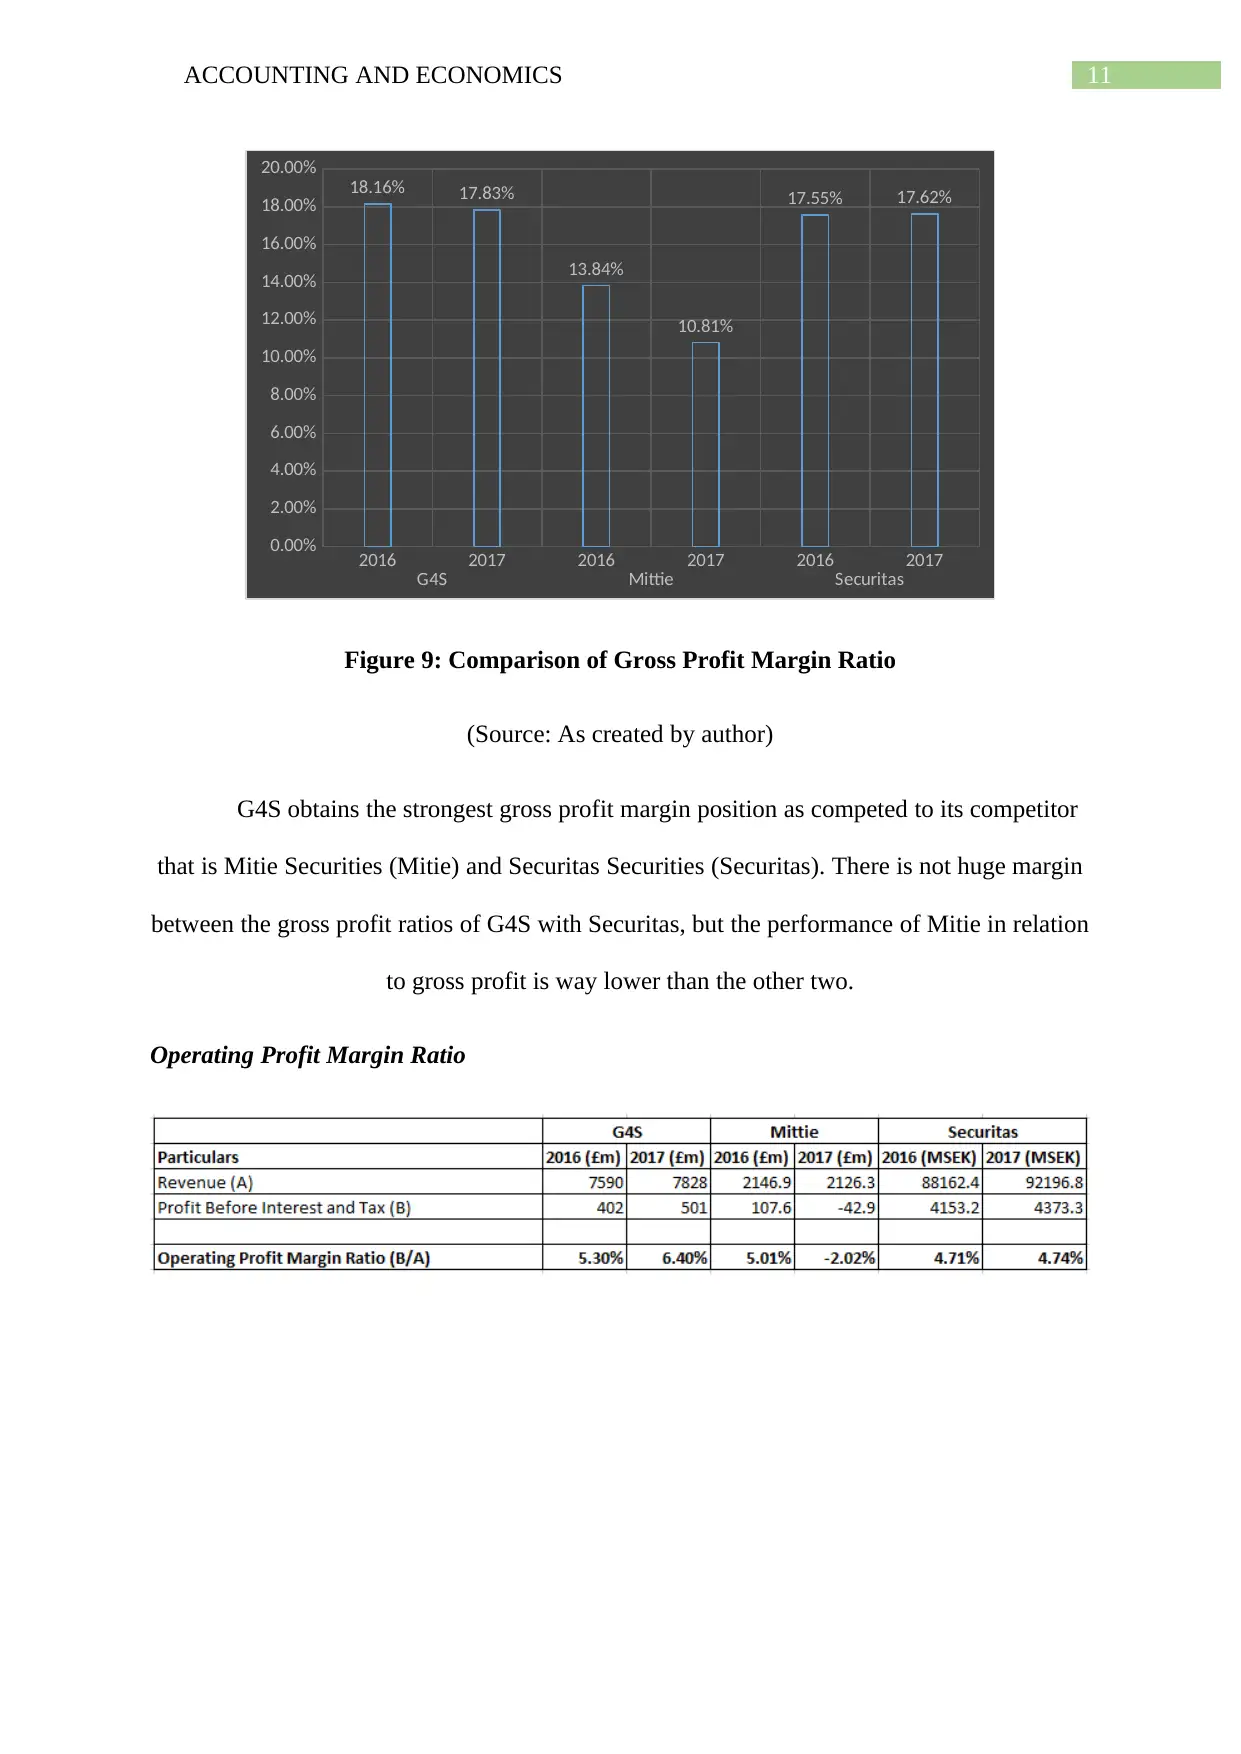
This report presents a comprehensive financial and economic analysis of G4S Plc, examining its performance through various financial ratios, including profitability, liquidity, gearing, and asset utilization. The analysis compares G4S's performance with its competitors, Mitie and Securitas, highlighting strengths, weaknesses, opportunities, and threats. The report also delves into market perception, stock price performance, and the macroeconomic environment, including factors like inflation, interest rates, and GDP growth. Furthermore, it assesses consumer demand, market structure, and competition within the security services industry, providing a detailed overview of G4S's financial health and strategic positioning. The report concludes with a summary of findings and recommendations for future business operations.

Running head: ACCOUNTING AND ECONOMICS
Accounting and Economics
Name of the Student
Name of the University
Author’s Note
Accounting and Economics
Name of the Student
Name of the University
Author’s Note
Paraphrase This Document
Need a fresh take? Get an instant paraphrase of this document with our AI Paraphraser

1ACCOUNTING AND ECONOMICS
Table of Contents
Executive Summary...................................................................................................................2
Part a: Financial Performance Analysis-....................................................................................3
Financial Performance Comparison with Previous Year.......................................................3
Financial Performance Comparison with the Competitors..................................................10
Financial Reporting..............................................................................................................18
Market Perception of the Company.....................................................................................19
Part b: Economic Analysis.......................................................................................................21
Macroeconomic Environment Analysis...............................................................................21
Current and Planned Operations..........................................................................................25
Microeconomic Environment Analysis................................................................................26
Consumer Demand for Products and Services.................................................................26
Market Structure...............................................................................................................27
Competition......................................................................................................................27
Part c: Conclusion....................................................................................................................29
References................................................................................................................................32

2ACCOUNTING AND ECONOMICS
Executive Summary
The analysis of the financial performance of G4S Plc. (G4S) shows that the overall
profitability of the company is good, but the company has lack of sufficient current assets to
pay off their current obligations. This findings also shows that the company uses more
amount of equity capital as compared to the debt capital and it increases the ability of the
company to pay off their interest expenses in efficient manner. Efficiency of the company can
be seen utilizing their assets for the making of sales and profits. The findings also shows that
the company needs to take into consideration the effects of the macroeconomic variables like
inflation rate, interest rate, GDP growth and others at the time of their business operations.
The following discussion shows the SWOT analysis of G4S:
Strengths Weaknesses
ï‚· Improved profitability, gearing
position and asset utilization
ï‚· Effective financial performance
ï‚· Lack of current assets to pay off the
obligations
ï‚· Inferior performance in certain areas
when compared to competitors
Opportunities Threats
ï‚· Increased demand of products is
creating more business opportunities
ï‚· International business expansion
ï‚· Presence of intense competition
ï‚· Negative impact of certain
macroeconomic factors like inflation
rate and interest rate
⊘ This is a preview!⊘
Do you want full access?
Subscribe today to unlock all pages.

Trusted by 1+ million students worldwide

3ACCOUNTING AND ECONOMICS
Part a: Financial Performance Analysis-
Financial Performance Comparison with Previous Year
The below discussion shows the analysis of major ratios of G4S for analysing their
financial performance.
Profitability Ratios
Gross Profit Margin Ratio
2016 2017 2016 2017 2016 2017
G4S Mittie Securitas
18.16%
17.83%
Figure 1: Gross Profit Margin Ratio of G4S
(Source: g4s.com 2019)
Paraphrase This Document
Need a fresh take? Get an instant paraphrase of this document with our AI Paraphraser

4ACCOUNTING AND ECONOMICS
There is a decrease in the gross profit ratio of G4S from the year 2016 to 2017. It
indicates towards the bad performance of the company in the current year (Delen, Kuzey and
Uyar 2013).
Operating Profit Margin Ratio
2016 2017 2016 2017 2016 2017
G4S Mittie Securitas
5.30%
6.40%
Figure 2: Operating Profit Margin Ratio of G4S
(Source: g4s.com 2019)
G4S has been able in increasing their operating profit margin in 2017 as compared to
2016. It is a good aspect for the company as it shows the efficiency of the company in
managing their operating expenses relating to the sales (Heikal, Khaddafi and Ummah 2014).
Liquidity Ratios
Current Ratio

5ACCOUNTING AND ECONOMICS
2016 2017 2016 2017 2016 2017
G4S Mittie Securitas
1.12
1.06
Figure 3: Current Ratio of G4S
(Source: g4s.com 2019)
Decrease in current ratio is evident in 2017 as compared to 2016 and it indicates
towards the decrease in the capability of G4S to pay off their current business obligation with
their current assets. It is a negative aspect for the financial performance of G4S (Ehiedu
2014).
Acid Test Ratio
⊘ This is a preview!⊘
Do you want full access?
Subscribe today to unlock all pages.

Trusted by 1+ million students worldwide

6ACCOUNTING AND ECONOMICS
2016 2017 2016 2017 2016 2017
G4S Mittie Securitas
1.07
1.02
Figure 4: Acid Test Ratio of G4S
(Source: g4s.com 2019)
The acid test ratio of G4S decreases in 2017 as compared to 2016. It is not good for
G4S as it indicates towards the decreased ability of the firm to pay off their current liabilities
with their quick assets (Priya and Nimalathasan 2013).
Gearing Ratios
Gearing Ratio
Paraphrase This Document
Need a fresh take? Get an instant paraphrase of this document with our AI Paraphraser

7ACCOUNTING AND ECONOMICS
2016 2017
G4S
0.67
0.64
Figure 5: Gearing Ratio of G4S
(Source: g4s.com 2019)
Gearing ratio of G4S decreases in 2017 from 2016. It indicates that G4S has increased
the use of debt capital in the recent year for fulfilling the capital requirement. It makes the
business highly leveraged and risky due to huge interest payment (Omar et al. 2014).
Interest Cover Ratio

8ACCOUNTING AND ECONOMICS
2016 2017
G4S
2.89
3.82
Figure 6: Interest Cover Ratio of G4S
(Source: g4s.com 2019)
As per the above table and figure, there is an increase in the interest cover ratio of
G4S in 2017 as compared to 2016. This is a good sign for the company as it indicates towards
the increased capacity of the company to make the required interest payments (Ibiamke and
Ateboh-Briggs 2014).
Asset Utilization Ratios
Asset Turnover Ratio
⊘ This is a preview!⊘
Do you want full access?
Subscribe today to unlock all pages.

Trusted by 1+ million students worldwide

9ACCOUNTING AND ECONOMICS
2016 2017
G4S
1.45
1.42
Figure 7: Asset Turnover Ratio of G4S
(Source: g4s.com 2019)
Asset turnover ratio decreases in the year 2017 from 2016. It shows negative
performance of G4S as the ability of the company has decreased in 2017 to generate net sales
by using their assets (Alipour, Mohammadi and Derakhshan 2015).
Return on Assets Ratios
Paraphrase This Document
Need a fresh take? Get an instant paraphrase of this document with our AI Paraphraser

10ACCOUNTING AND ECONOMICS
2016 2017
G4S
3.78%
4.28%
Figure 8: Return on Assets Ratio of G4S
(Source: g4s.com 2019)
It can be seen from the above table and figure that there is an increase in the return on
asset of G4S in 2017 as compared to 2016. It is a positive sign for G4S as it implies that G4S
has used their assets in more effective manner with the aim to generate profit (Warrad and Al
Omari 2015).
Financial Performance Comparison with the Competitors
Gross Profit Margin Ratio

11ACCOUNTING AND ECONOMICS
2016 2017 2016 2017 2016 2017
G4S Mittie Securitas
0.00%
2.00%
4.00%
6.00%
8.00%
10.00%
12.00%
14.00%
16.00%
18.00%
20.00%
18.16% 17.83%
13.84%
10.81%
17.55% 17.62%
Figure 9: Comparison of Gross Profit Margin Ratio
(Source: As created by author)
G4S obtains the strongest gross profit margin position as competed to its competitor
that is Mitie Securities (Mitie) and Securitas Securities (Securitas). There is not huge margin
between the gross profit ratios of G4S with Securitas, but the performance of Mitie in relation
to gross profit is way lower than the other two.
Operating Profit Margin Ratio
2016 2017 2016 2017 2016 2017
G4S Mittie Securitas
0.00%
2.00%
4.00%
6.00%
8.00%
10.00%
12.00%
14.00%
16.00%
18.00%
20.00%
18.16% 17.83%
13.84%
10.81%
17.55% 17.62%
Figure 9: Comparison of Gross Profit Margin Ratio
(Source: As created by author)
G4S obtains the strongest gross profit margin position as competed to its competitor
that is Mitie Securities (Mitie) and Securitas Securities (Securitas). There is not huge margin
between the gross profit ratios of G4S with Securitas, but the performance of Mitie in relation
to gross profit is way lower than the other two.
Operating Profit Margin Ratio
⊘ This is a preview!⊘
Do you want full access?
Subscribe today to unlock all pages.

Trusted by 1+ million students worldwide
1 out of 36
Related Documents
Your All-in-One AI-Powered Toolkit for Academic Success.
 +13062052269
info@desklib.com
Available 24*7 on WhatsApp / Email
Unlock your academic potential
Copyright © 2020–2025 A2Z Services. All Rights Reserved. Developed and managed by ZUCOL.


