Financial Performance and Position of G8 Education: Accounting Report
VerifiedAdded on 2022/08/26
|10
|1669
|19
Report
AI Summary
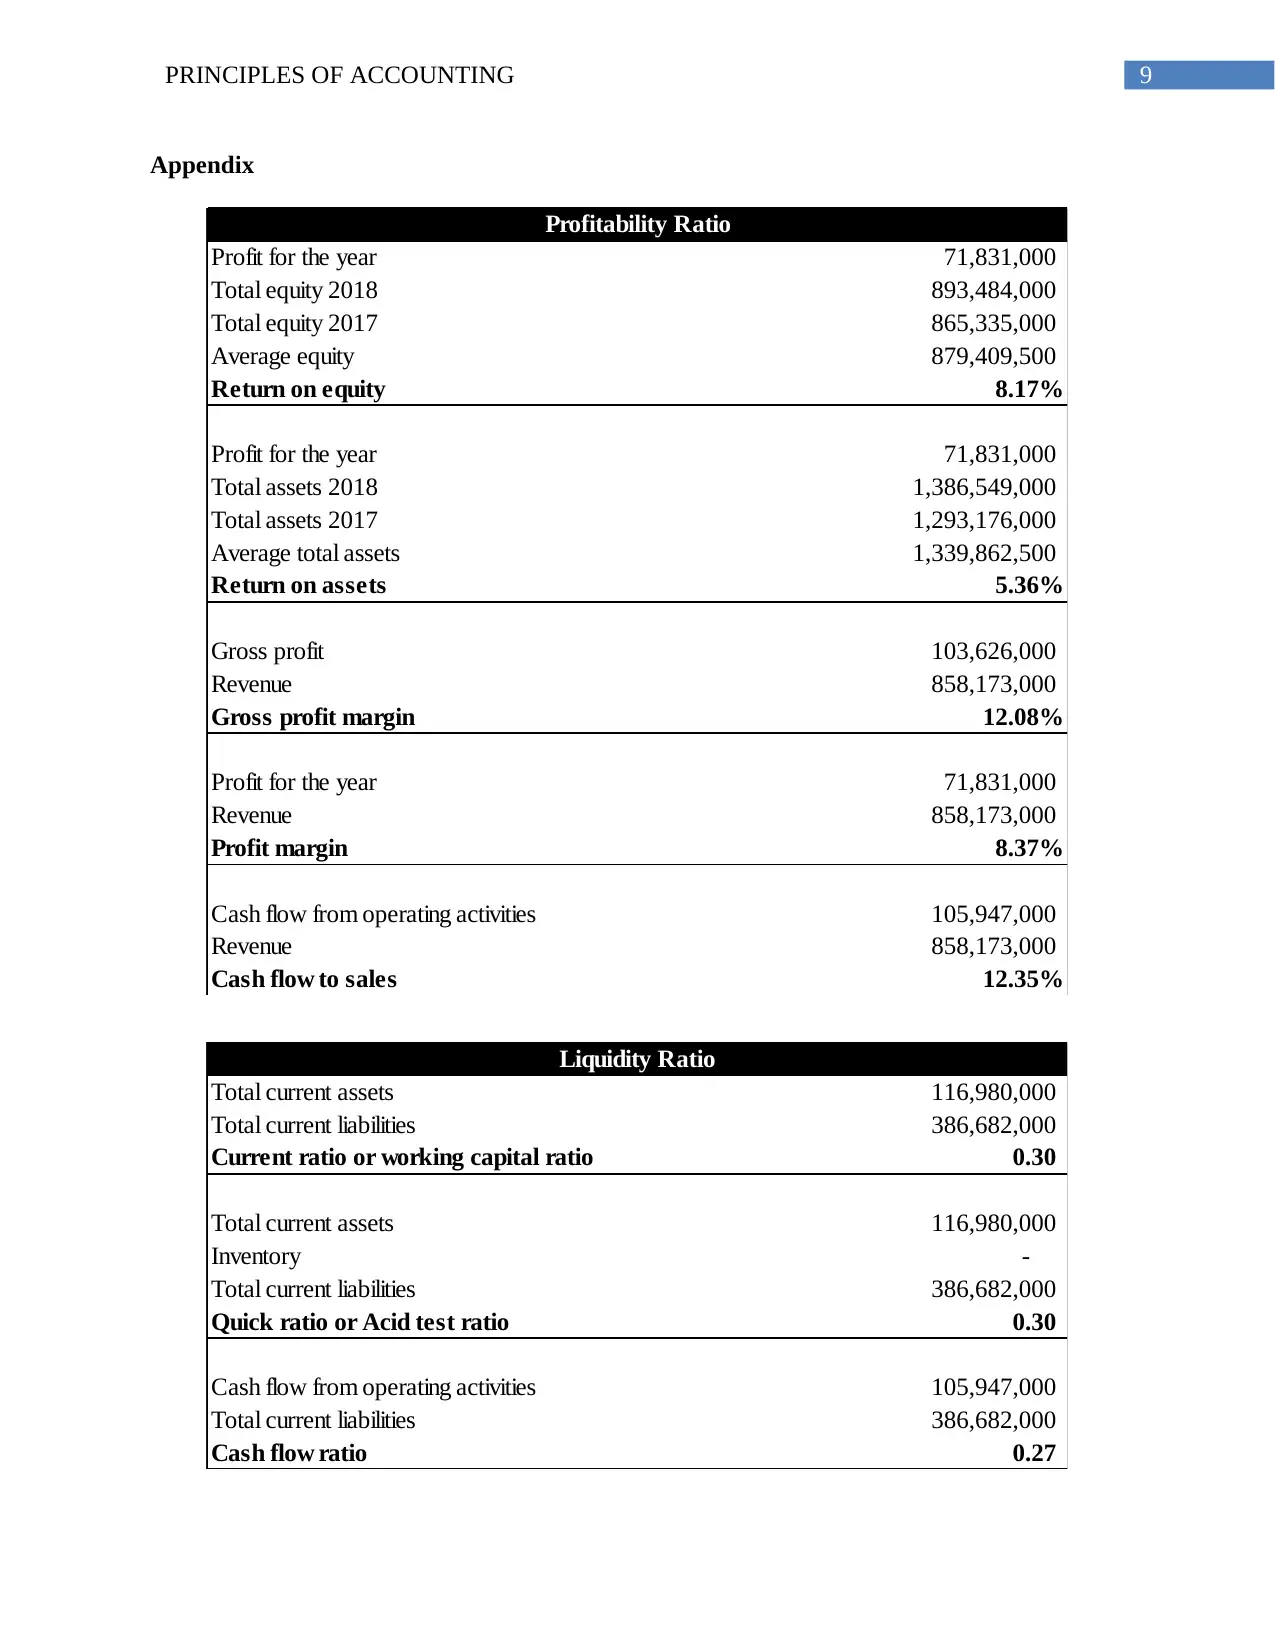
This report provides a financial analysis of G8 Education, focusing on its performance and position. It utilizes ratio analysis, specifically examining profitability and liquidity. Profitability ratios, including return on equity, return on assets, gross profit margin, profit margin, and cash flow to sales, are computed and analyzed to assess the company's operational efficiency and shareholder returns. Liquidity ratios, such as current ratio, quick ratio, and cash flow ratio, are used to evaluate the company's short-term solvency and ability to meet its obligations. The analysis reveals insights into G8 Education's strengths, weaknesses, and overall financial health, concluding with recommendations for improvement. The report highlights the company's sustainable growth and revenue increase, but also points out areas where enhanced financial management could improve profitability and liquidity, ultimately contributing to shareholder wealth maximization.
Contribute Materials
Your contribution can guide someone’s learning journey. Share your
documents today.

Running head: PRINCIPLES OF ACCOUNTING
Principles of Accounting
Name of the Student:
Name of the University:
Author’s Note:
Principles of Accounting
Name of the Student:
Name of the University:
Author’s Note:
Secure Best Marks with AI Grader
Need help grading? Try our AI Grader for instant feedback on your assignments.

1PRINCIPLES OF ACCOUNTING
Executive Summary:
This report is prepared to analyses the financial performance and financial position of the G8
Education. For the analysis of the financial performance and financial position, the ratio analysis
tool of financial statement analysis has been used focusing on the profitability and liquidity of
the company. Various profitability ratios have been computed and analyzed to interpret the
financial performance of the company and various liquidity ratios have been used to analyze and
interpret the financial position of the company. Lastly, the report concludes with outlining the
financial health, strength and weaknesses of the company and a fair recommendation for the
improvement in the financial performance of the company.

2PRINCIPLES OF ACCOUNTING
Table of Contents
Introduction......................................................................................................................................3
Brief overview to the company........................................................................................................3
Profitability ratios............................................................................................................................4
Liquidity ratios.................................................................................................................................6
Conclusion.......................................................................................................................................7
References and bibliography...........................................................................................................8
Appendix..........................................................................................................................................9

3PRINCIPLES OF ACCOUNTING
Introduction
Financial statements are prepared for the financial information users to provide them
meaningful information about the financial performance and financial position of the company.
It is not easy for all the information users to understand the financial performance and position of
the business from the financial statement without having proper knowledge. Therefore, various
financial statement analysis tools and techniques can be applied to analyses and interpreted the
information contained in the financial statement to help the stakeholders in their various decision
making process. In this report various profitability ratios and liquidity ratios have been used to
analyses and interpreted the financial performance and position of the G8 Education from the
annual report of the company (Williams and Dobelman 2017).
Brief overview to the company
G8 Education Limited is an ASX listed largest Australian child care company. Its main
operating activity is to provide educational services and high quality child care services. The
company is oriented towards a sustainable growth and improvement in the quality of their
educational and child care services.
The company is listed in the Australian Stock Exchange with a present market
capitalization of $911.15 million. The company has been performing very well for the last few
years and a sharp growth in their revenue can be observed along with a growth in the net income.
In the following part of this report the profitability and liquidity ratios can analyze and interpret
it in more detail (G8 Education Annual Report 2018).
Secure Best Marks with AI Grader
Need help grading? Try our AI Grader for instant feedback on your assignments.

4PRINCIPLES OF ACCOUNTING
Profitability ratios
Income statement of a company shows the operational performance that is why the
income statement is also known as the statement of operations. Using various income statement
information and balance sheet figures following ratios can be computed for the G8 Education
Limited to understand the profitability and financial performance of the company.
Profitability Ratio
Return on
equity
2018 Profit for the year-Page 53
Total equity 2018 and 2017-Page 54 8.17%
Return on
assets
2018 Profit for the year-Page 53
Total assets 2018 and 2017-Page 64 5.36%
Gross profit
margin
2018 Gross profit-Page 53
2018 Revenue-Page 53 12.08%
Profit
margin
2018 Profit for the year-Page 53
2018 Revenue-Page 53 8.37%
Cash flow to
sales
2018 Cash flow from operating
activities-Page 56
2018 Revenue-Page 53
12.35%
Return on equity is the measure of profitability based on the net profit available to the
equity holders and the average equity of a company. From the 2018 annual report of the
company, and applying the above formula the return on equity of the company can be computed
to 8.17%. It implies a significant profitability of the company which is helping the objective of
shareholders wealth maximization (G8 Education Annual Report 2018).
Return on assets is another important ratio of profitability, and it is also known as the
management efficiency ratio. It measures the profitability of the company against the average
total assets of the company. The company is having a return on assets of 5.36% which is
satisfactory but not showing a good mark. Hence, it can be commented that, the company need to
Profit available¿ owners ¿
Average equity × 100
Profit(Loss )
Average total assets ×100
Gross profit
Sales revenue × 100
Profit (Loss)
Sales revenue × 100
Cash flow ¿ operating activities ¿
Sales revenue ×100

5PRINCIPLES OF ACCOUNTING
utilize their assets more efficiently to maximize their profit and to achieve the overall objective
of the business.
Gross profit margin is the measure of gross profitability compared to the total turnover of
the company. The gross profit margin is computed, comparing the gross profit and the total
revenue of the company. It can be observed from the above analysis, that the G8 Education
Limited is having a gross profit margin of 12.08%. It implies they are having either aggressive
pricing strategy or their operations are very efficient in providing their services, but as the
company is a service providing company it could have been much better.
Net profit margin measures the net profitability of the business. The net profit margin is
computed by comparing the net profit after tax for the year with the total turnover for the year.
The G8 Education Limited is having a net profit margin of 8.37% for the year 2018. While the
gross profit margin was 12.08%, such a lower net profit margin implies that their operating
expenses or administrative expenses are consuming a huge part of their revenue. Hence, they
need to manage those expenses more efficiently and effectively to increase their net profit
margin towards achieving the overall business objectives (G8 Education Annual Report 2018).
While the net profit is a measure of profitability as per the accrual basis of accounting,
the cash flow from operating activities can be considered as the net cash income for a year.
Hence, the cash flow to sales ratio can be used for measuring the percentage of cash profit
generated in a particular financial year. It can be observed that the company is having a cash
flow to sales ratio of 12.35%. It implies, though they are having a significantly lower net profit
margin, the cash generation is well enough to pay off their expenses and finance costs (Robinson
2020).

6PRINCIPLES OF ACCOUNTING
Liquidity ratios
For understanding the financial position of a business organization, the liquidity and
solvency of the business must be analyzed and understood. Comparing the short term or current
assets and current liabilities, the liquidity or the short term solvency of the company can be
analyzed using the following liquidity ratios.
Liquidity Ratio
Current ratio
or working
capital ratio
2018 Total current assets-Page 54
2018 Total current liabilities-Page 54
0.3
0
Quick ratio
or Acid test
ratio
2018 Total current assets & Inventory-
Page 54
2018 Total current liabilities-Page 54
0.3
0
Cash flow
ratio
2018 Cash flow from operating
activities-Page 56
2018 Total current liabilities-Page 54
0.2
7
Current ratio compares the total current assets and total current liabilities of a company
and assesses the ability of the company to pay off all the current liability immediately with the
available current assets. The company is having a current ratio of 0.30:1 while the standard is
2:1. Hence, the company is having a poor solvency in terms of current ratio (G8 Education
Annual Report 2018).
Quick ratio or the acid test ratio is the measure of ability of the company to pay off
current liability with the readily convertible current assets. The company is having a quick ratio
of 0.30:1, while the standard is 1:1. Hence, the company is having liquidity crisis which they
need to consider and focus on.
Cash flow ratio insignificant for measuring the cash generating capacity as compared to
their current obligations. The company is having a cash flow ratio of 0.27:1. It implies that, their
Current assets
Current liabilities
Current assets−Inventory
Current liabilities
Net cash flow ¿ operating activities ¿
Current liabilities
Paraphrase This Document
Need a fresh take? Get an instant paraphrase of this document with our AI Paraphraser

7PRINCIPLES OF ACCOUNTING
cash generation in a year is not sufficient to pay off all of their current obligation (Wahlen,
Baginski and Bradshaw 2014).
Conclusion
From the above analysis and discussion it can be concluded that, the G8 Education
Limited is having an efficient financial and operational performance for the last few years and a
sustainable growth in their revenue can be observed but they are having a poor profitability. As
the company is having a lower net profit margin and a poor overall short term solvency, it can be
recommended that they focus on managing their resources more efficiently to increase the
profitability and liquidity of the company which can help them in achieving the objective of the
shareholders wealth maximization.

8PRINCIPLES OF ACCOUNTING
References and bibliography
DeFusco, R.A., McLeavey, D.W., Pinto, J.E., Runkle, D.E. and Anson, M.J., 2015. Quantitative
investment analysis. John Wiley & Sons.
G8 Education Annual Report 2018, 2018 [ebook] Australia: G8 Education Limited, p.122.
Available at:
http://www.annualreports.com/HostedData/AnnualReports/PDF/ASX_GEM_2018.pdf
[Accessed 15 Jan. 2020].
G8 Education, 2020. Home - G8 Education. [online] Available at: https://g8education.edu.au/
[Accessed 15 Jan. 2020].Buvaneswari, R. and Lakshmi, S., 2015. A study on financial statement
analysis of Sri Ram perfumes, Trichy. International Journal of Advanced Research in.
Robinson, T.R., 2020. International financial statement analysis. John Wiley & Sons.
Wahlen, J.M., Baginski, S.P. and Bradshaw, M., 2014. Financial reporting, financial statement
analysis and valuation. Nelson Education.
Weygandt, J.J., Kimmel, P.D. and Kieso, D.E., 2019. Financial accounting. Wiley.
Williams, E.E. and Dobelman, J.A., 2017. Financial statement analysis. World Scientific Book
Chapters, pp.109-169.

9PRINCIPLES OF ACCOUNTING
Appendix
Profit for the year 71,831,000
Total equity 2018 893,484,000
Total equity 2017 865,335,000
Average equity 879,409,500
Return on equity 8.17%
Profit for the year 71,831,000
Total assets 2018 1,386,549,000
Total assets 2017 1,293,176,000
Average total assets 1,339,862,500
Return on assets 5.36%
Gross profit 103,626,000
Revenue 858,173,000
Gross profit margin 12.08%
Profit for the year 71,831,000
Revenue 858,173,000
Profit margin 8.37%
Cash flow from operating activities 105,947,000
Revenue 858,173,000
Cash flow to sales 12.35%
Profitability Ratio
Total current assets 116,980,000
Total current liabilities 386,682,000
Current ratio or working capital ratio 0.30
Total current assets 116,980,000
Inventory -
Total current liabilities 386,682,000
Quick ratio or Acid test ratio 0.30
Cash flow from operating activities 105,947,000
Total current liabilities 386,682,000
Cash flow ratio 0.27
Liquidity Ratio
1 out of 10
Related Documents

Your All-in-One AI-Powered Toolkit for Academic Success.
+13062052269
info@desklib.com
Available 24*7 on WhatsApp / Email
Unlock your academic potential
© 2024 | Zucol Services PVT LTD | All rights reserved.