Comprehensive Budget Report and Financial Analysis for Gaia Ltd.
VerifiedAdded on 2023/06/05
|13
|2331
|331
Report
AI Summary
This report provides a comprehensive financial analysis of Gaia Ltd.'s budget. Part A focuses on the cash budget, examining cash inflows, outflows, and the resulting cash position. It includes an evaluation of financing sources like equity shares, debentures, and term loans. Part B delves into ratio calculations, comparing the company's performance over two years using liquidity, profitability, and working capital ratios, along with a discussion of the key performance indicators. Part C presents a flexible sales budget, exploring the impact of different sales volumes on profitability and identifying potential issues such as the effects of economies of scale on variable costs. The analysis highlights the importance of effective financial management and strategic decision-making for the company's success.
Budget report
Paraphrase This Document
Need a fresh take? Get an instant paraphrase of this document with our AI Paraphraser
Table of Contents
PART A.......................................................................................................................................................................................................3
Cash Budget.............................................................................................................................................................................................3
Examining the Cash Budget....................................................................................................................................................................4
Evaluation of Sources of Finance............................................................................................................................................................4
PART B.......................................................................................................................................................................................................5
Ratio Calculation.....................................................................................................................................................................................5
Comparing Performance of Both the Years.............................................................................................................................................9
Part C.........................................................................................................................................................................................................10
Flexible Sales Budget............................................................................................................................................................................10
Identification & Discussion of Issues....................................................................................................................................................11
REFERENCES............................................................................................................................................................................................1
PART A
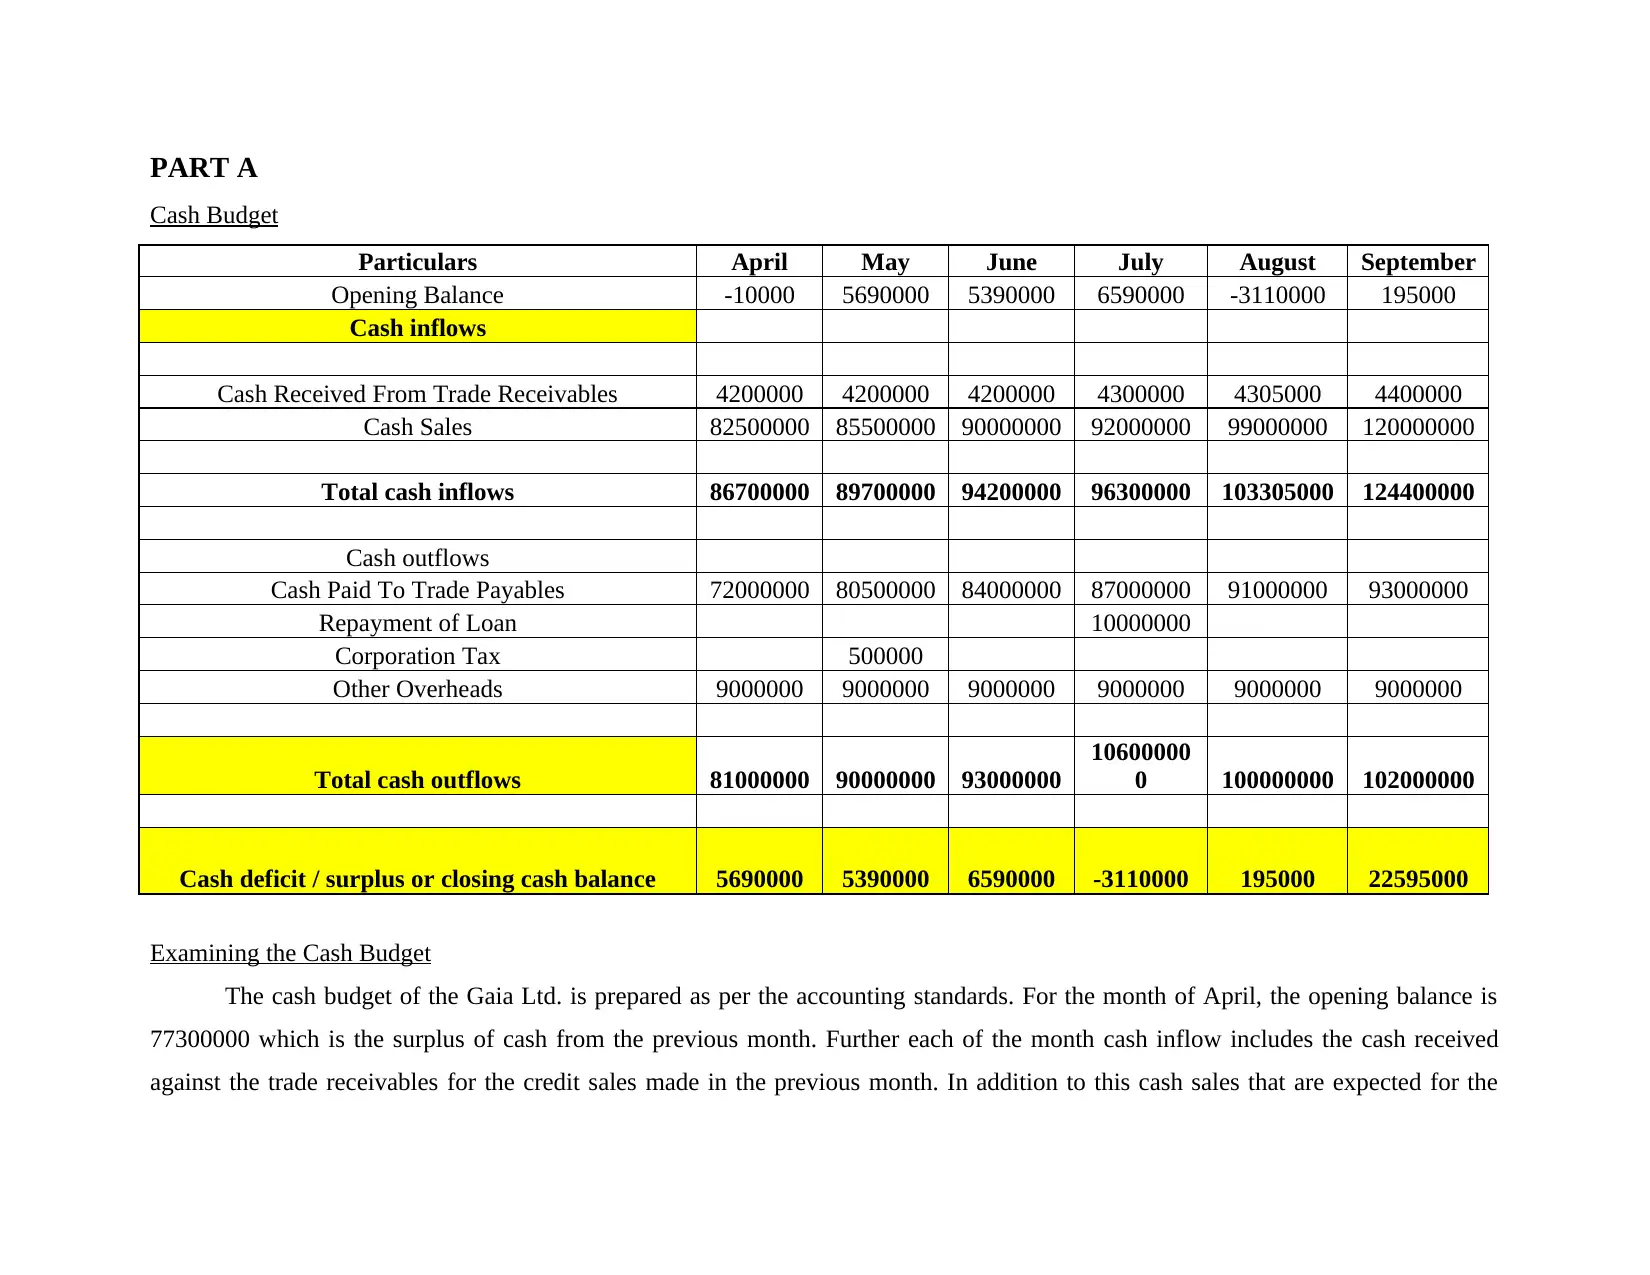
Cash Budget
Particulars April May June July August September
Opening Balance -10000 5690000 5390000 6590000 -3110000 195000
Cash inflows
Cash Received From Trade Receivables 4200000 4200000 4200000 4300000 4305000 4400000
Cash Sales 82500000 85500000 90000000 92000000 99000000 120000000
Total cash inflows 86700000 89700000 94200000 96300000 103305000 124400000
Cash outflows
Cash Paid To Trade Payables 72000000 80500000 84000000 87000000 91000000 93000000
Repayment of Loan 10000000
Corporation Tax 500000
Other Overheads 9000000 9000000 9000000 9000000 9000000 9000000
Total cash outflows 81000000 90000000 93000000
10600000
0 100000000 102000000
Cash deficit / surplus or closing cash balance 5690000 5390000 6590000 -3110000 195000 22595000
Examining the Cash Budget
The cash budget of the Gaia Ltd. is prepared as per the accounting standards. For the month of April, the opening balance is
77300000 which is the surplus of cash from the previous month. Further each of the month cash inflow includes the cash received
against the trade receivables for the credit sales made in the previous month. In addition to this cash sales that are expected for the
⊘ This is a preview!⊘
Do you want full access?
Subscribe today to unlock all pages.
Trusted by 1+ million students worldwide
month are also included to the cash inflows (Kurniawati, 2022). Further for the month of April, the firm expects to have a bank
overdraft of 10,000 pounds. The cash outflowing activities for the Gaia Ltd are expected to be making of payments to the creditors of
the firm from whom it purchases materials on credit. Such payments are made after a month, so any of the particular month contains
payments for the credit purchases that are done in the month previous to it. The month of July includes a repayment of loan of
10,000,000 pounds. Further, there is a payment of 500000 pounds against the head corporation tax, other overheads accounts to be
9,000,000 pounds every month. The firm is having enough positive cash flow for each of the months, it should make effective use of
such funds to earn more income.
Evaluation of Sources of Finance
Issue of Shares – Issuing of equity shares is known to be the main source for a firm to arrange the amount of funds that are
required by itself. Such shares are issued to the general public. Equity shareholders do not get any kind of preferential rights in
terms of repayment and receiving of dividend. The company have to give the equity shareholder their share from the
company’s residual income. There are various advantages that Gaia Ltd. can enjoy by using this source to raise funds. To
begin with the company will get funds that are of permanent in nature and hence it will not have any kind of liability in terms
of repayment. Furthermore, it will not create any obligation of the business enterprise in terms of paying the dividends. Lastly
the credit worthiness of the company will enhance. The limitations include cost of equity is the highest as compared with all
the sources of funds that are available to a company (Wadesango and et.al., 2019). The dividends that are paid to equity
shareholder are not tax deductible, and also the floatation expenses are high.
Debentures – The literal meaning of debentures is to take loan or borrow. Issuing of debentures by the company is like issuing
of unsecured loans. The company will have to pay the debentures holders fixed interest payments and repay the principal
amount in the event of repayment. The advantage is that this source is more effective than the issue of shares option. The
company will retain its ownership rights among its existing owner. Interest payments are tax deductible so it will be
Paraphrase This Document
Need a fresh take? Get an instant paraphrase of this document with our AI Paraphraser
advantageous for Gaia Ltd. The limitations are that the interest & principal payments become a burden for the company in the
years of low or no profits. There is huge amount of cash outflow during the repayments are made to the debentures’ holders.
Term Loans
PART B
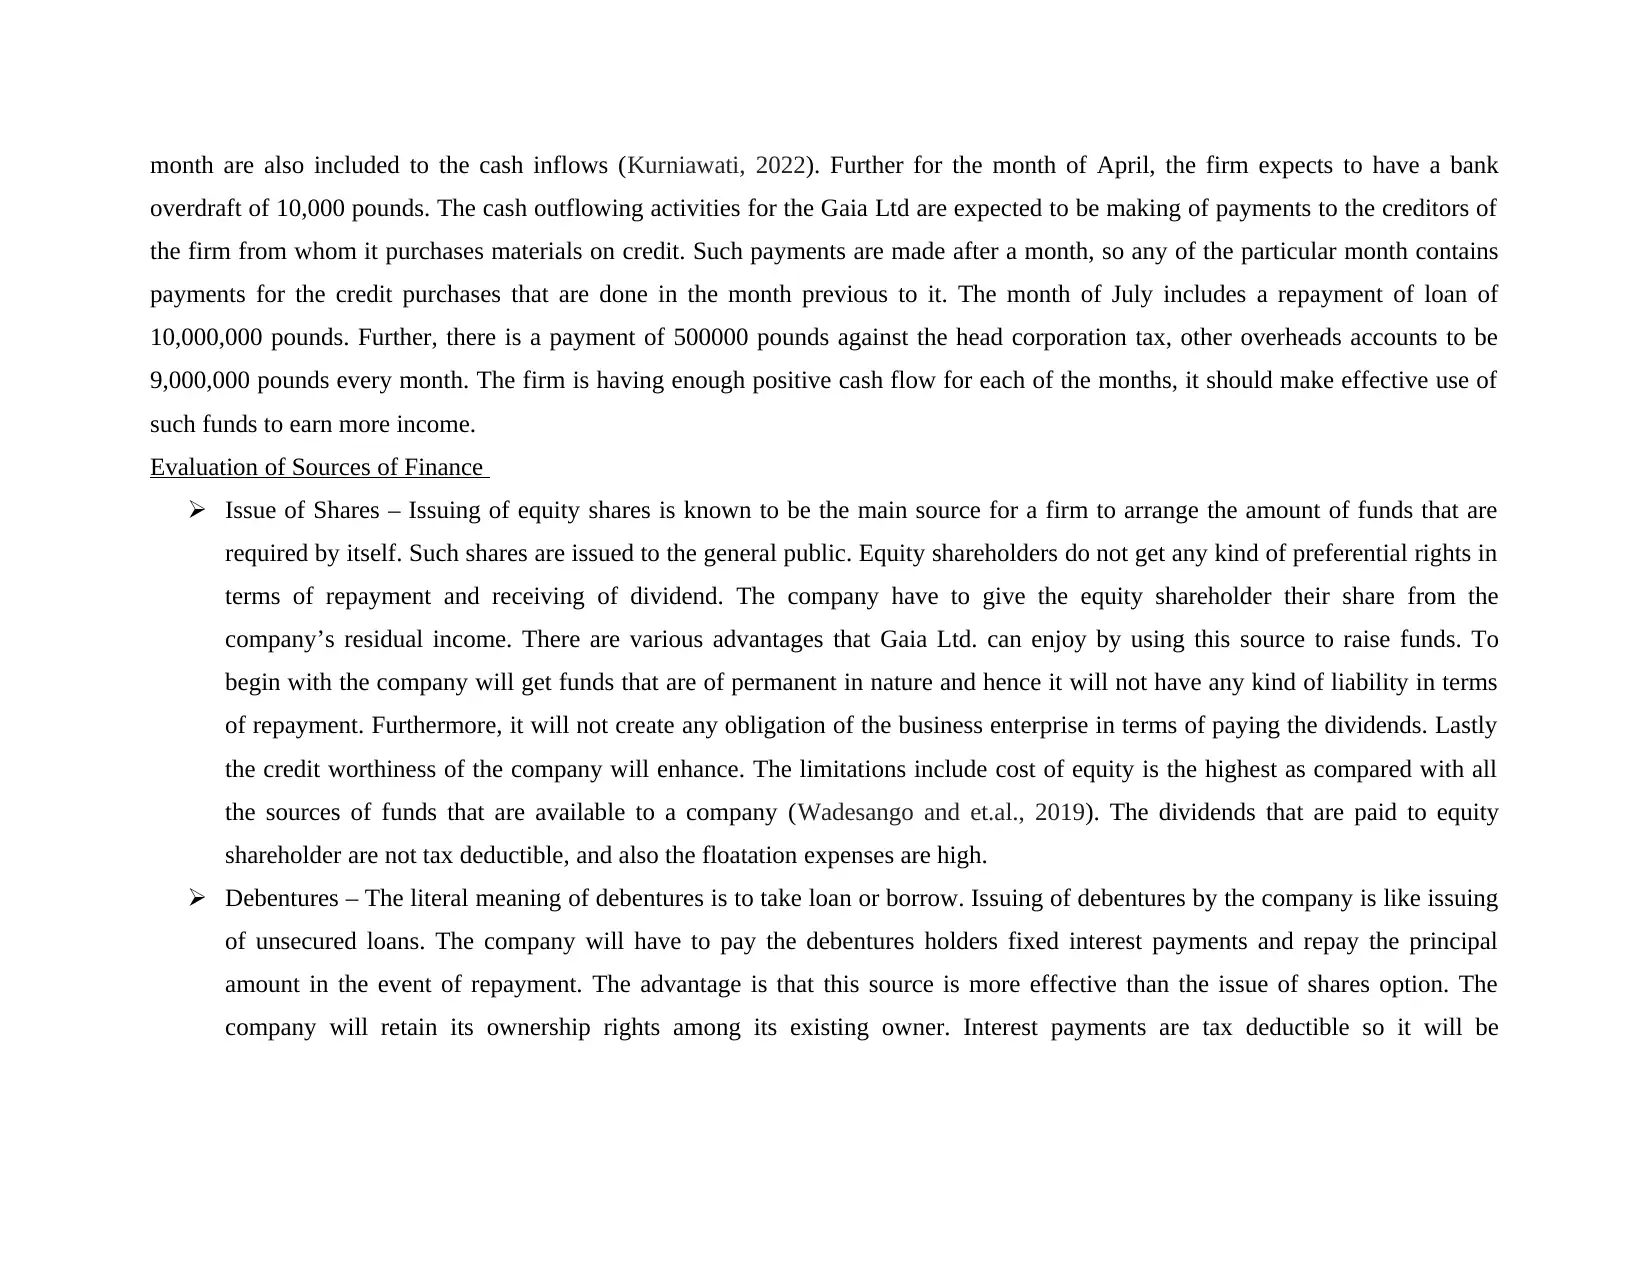
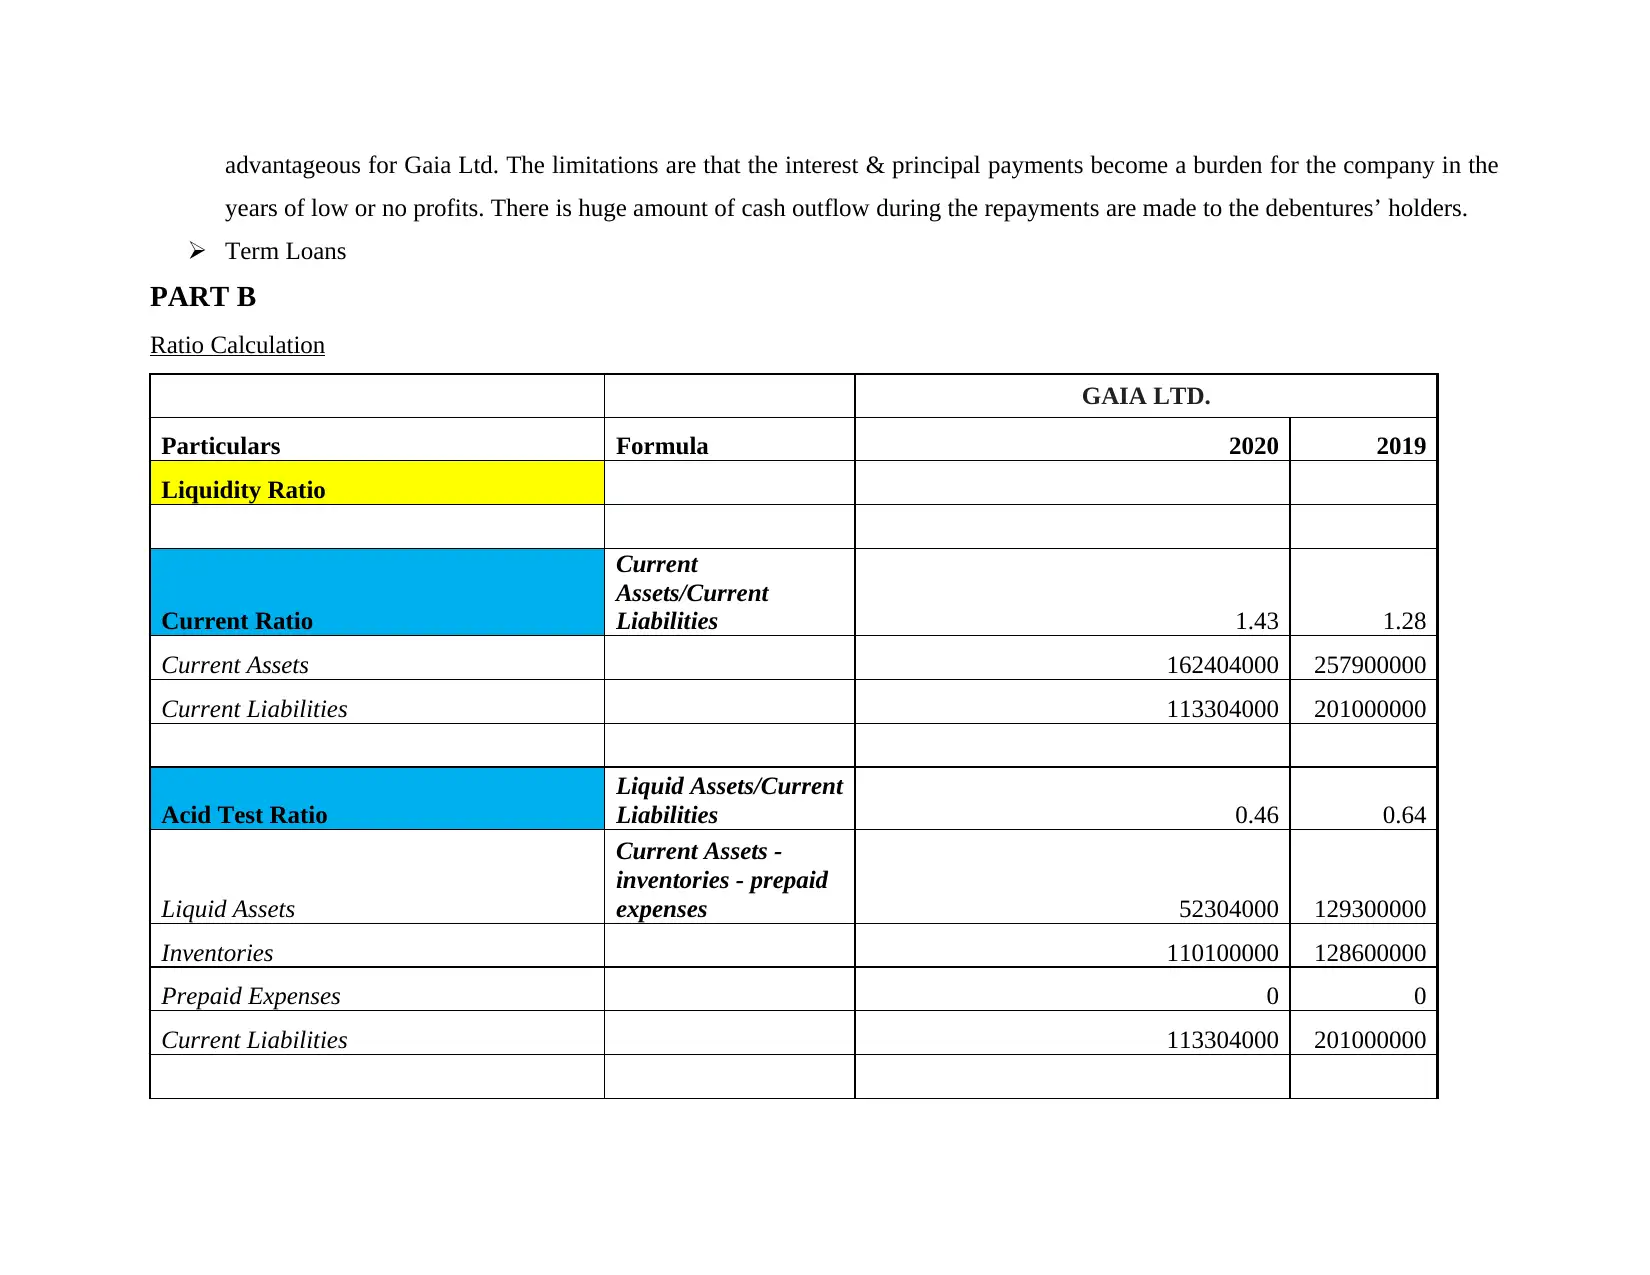
Ratio Calculation
GAIA LTD.
Particulars Formula 2020 2019
Liquidity Ratio
Current Ratio
Current
Assets/Current
Liabilities 1.43 1.28
Current Assets 162404000 257900000
Current Liabilities 113304000 201000000
Acid Test Ratio
Liquid Assets/Current
Liabilities 0.46 0.64
Liquid Assets
Current Assets -
inventories - prepaid
expenses 52304000 129300000
Inventories 110100000 128600000
Prepaid Expenses 0 0
Current Liabilities 113304000 201000000
years of low or no profits. There is huge amount of cash outflow during the repayments are made to the debentures’ holders.
Term Loans
PART B
Ratio Calculation
GAIA LTD.
Particulars Formula 2020 2019
Liquidity Ratio
Current Ratio
Current
Assets/Current
Liabilities 1.43 1.28
Current Assets 162404000 257900000
Current Liabilities 113304000 201000000
Acid Test Ratio
Liquid Assets/Current
Liabilities 0.46 0.64
Liquid Assets
Current Assets -
inventories - prepaid
expenses 52304000 129300000
Inventories 110100000 128600000
Prepaid Expenses 0 0
Current Liabilities 113304000 201000000
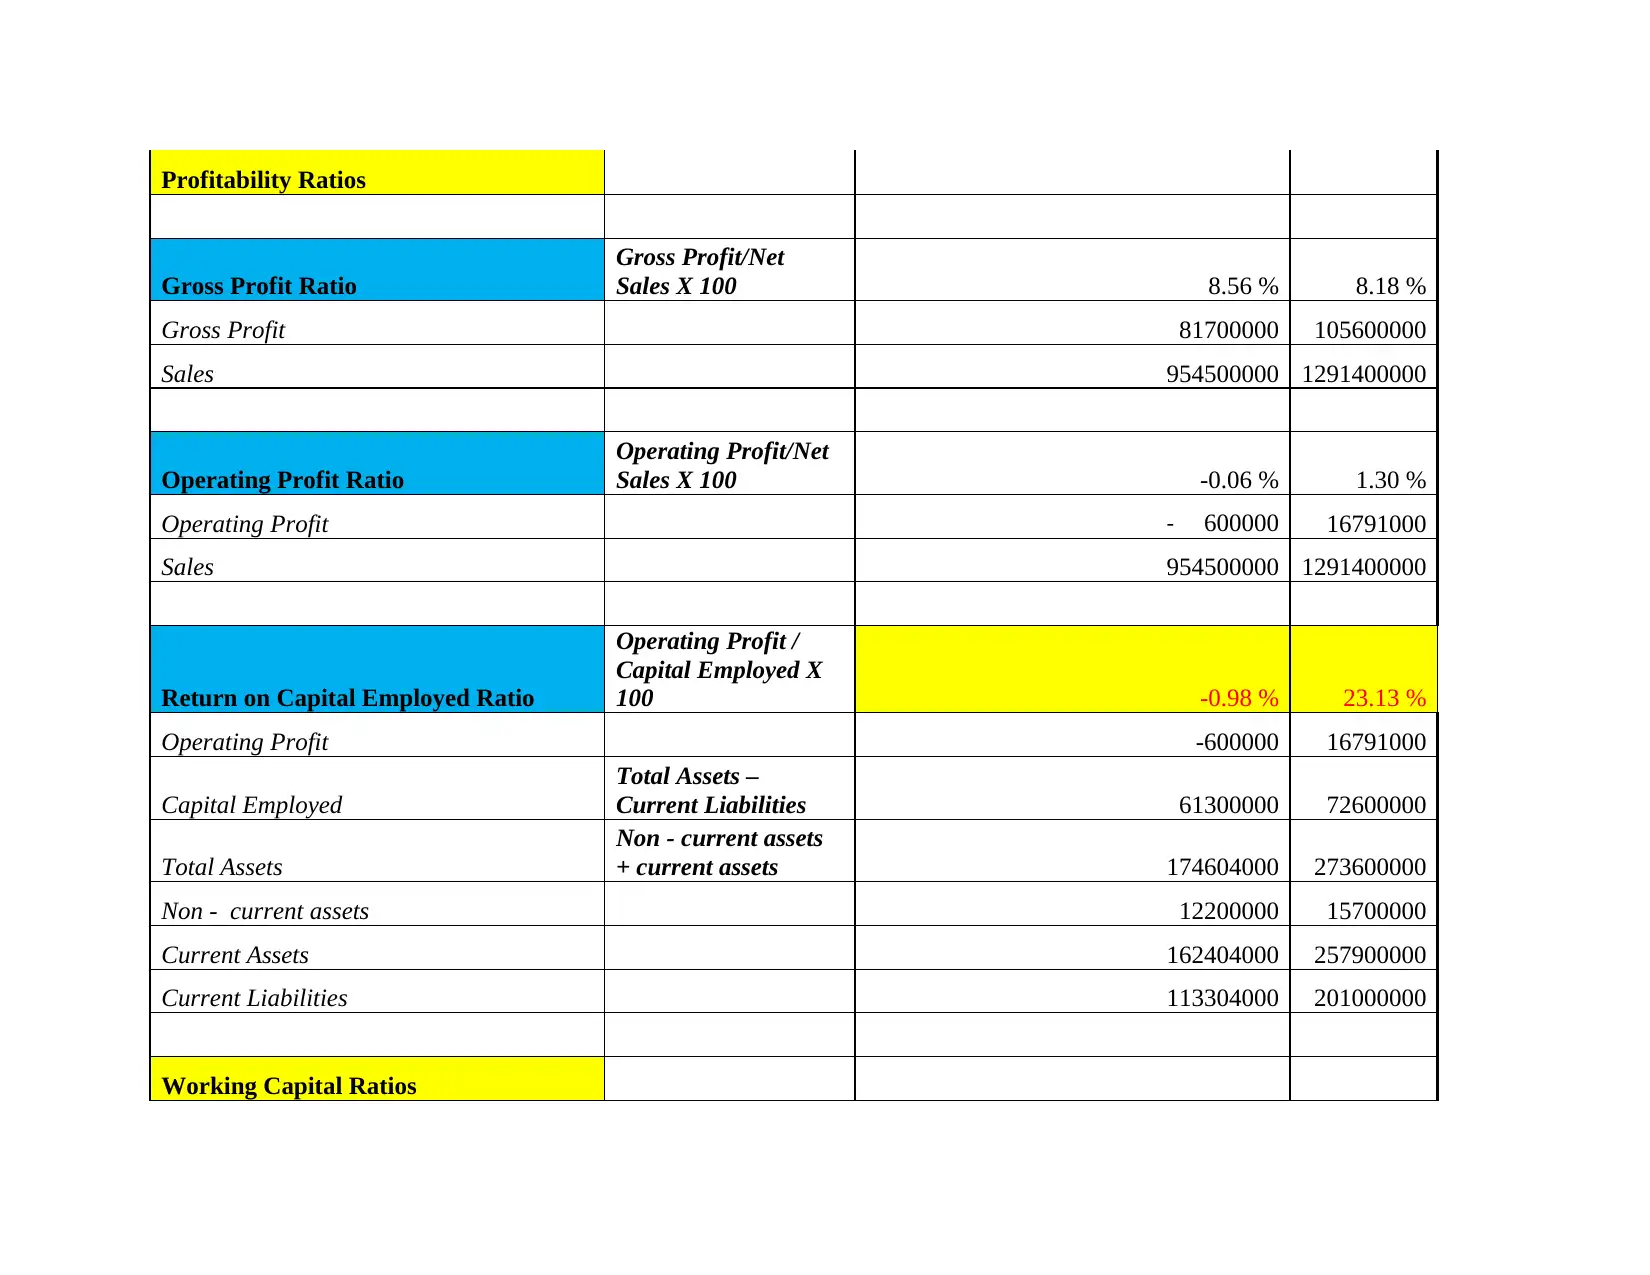
Profitability Ratios
Gross Profit Ratio
Gross Profit/Net
Sales X 100 8.56 % 8.18 %
Gross Profit 81700000 105600000
Sales 954500000 1291400000
Operating Profit Ratio
Operating Profit/Net
Sales X 100 -0.06 % 1.30 %
Operating Profit - 600000 16791000
Sales 954500000 1291400000
Return on Capital Employed Ratio
Operating Profit /
Capital Employed X
100 -0.98 % 23.13 %
Operating Profit -600000 16791000
Capital Employed
Total Assets –
Current Liabilities 61300000 72600000
Total Assets
Non - current assets
+ current assets 174604000 273600000
Non - current assets 12200000 15700000
Current Assets 162404000 257900000
Current Liabilities 113304000 201000000
Working Capital Ratios
⊘ This is a preview!⊘
Do you want full access?
Subscribe today to unlock all pages.
Trusted by 1+ million students worldwide
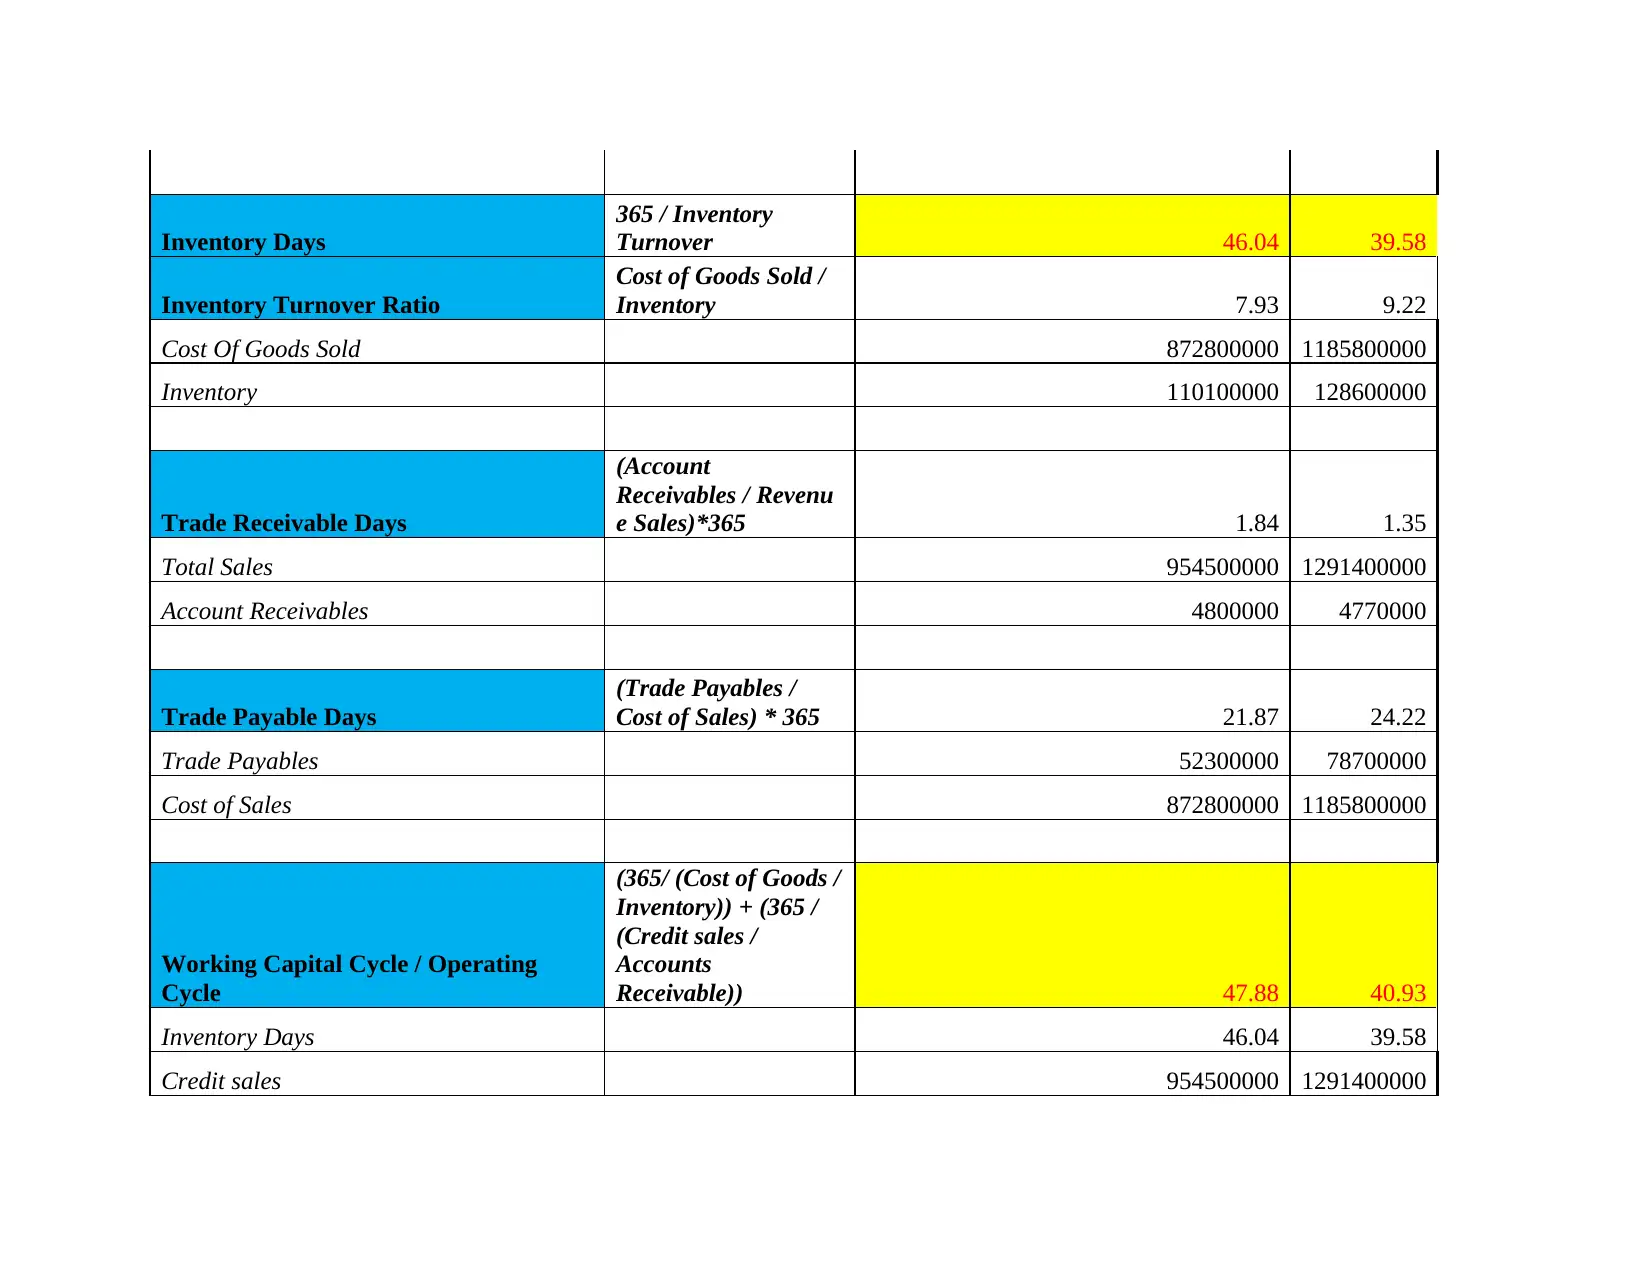
Inventory Days
365 / Inventory
Turnover 46.04 39.58
Inventory Turnover Ratio
Cost of Goods Sold /
Inventory 7.93 9.22
Cost Of Goods Sold 872800000 1185800000
Inventory 110100000 128600000
Trade Receivable Days
(Account
Receivables / Revenu
e Sales)*365 1.84 1.35
Total Sales 954500000 1291400000
Account Receivables 4800000 4770000
Trade Payable Days
(Trade Payables /
Cost of Sales) * 365 21.87 24.22
Trade Payables 52300000 78700000
Cost of Sales 872800000 1185800000
Working Capital Cycle / Operating
Cycle
(365/ (Cost of Goods /
Inventory)) + (365 /
(Credit sales /
Accounts
Receivable)) 47.88 40.93
Inventory Days 46.04 39.58
Credit sales 954500000 1291400000
Paraphrase This Document
Need a fresh take? Get an instant paraphrase of this document with our AI Paraphraser
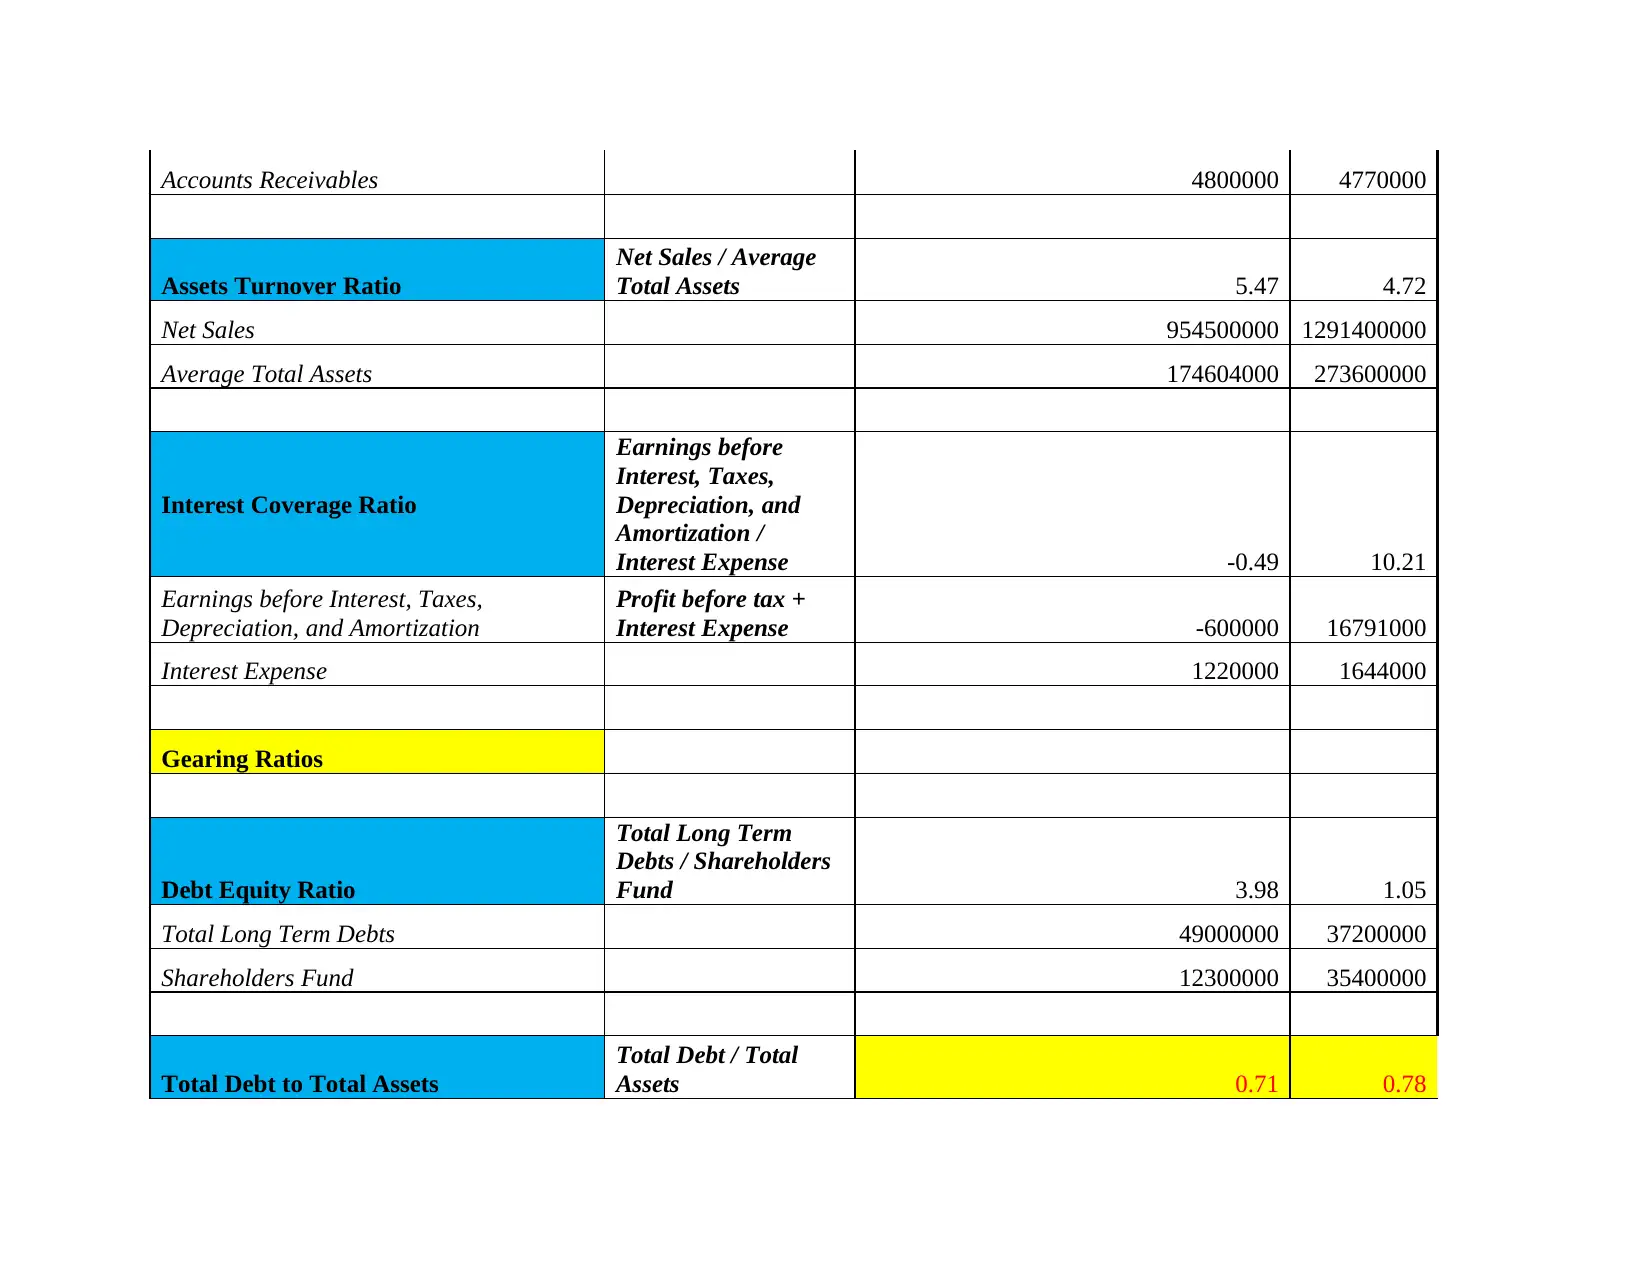
Accounts Receivables 4800000 4770000
Assets Turnover Ratio
Net Sales / Average
Total Assets 5.47 4.72
Net Sales 954500000 1291400000
Average Total Assets 174604000 273600000
Interest Coverage Ratio
Earnings before
Interest, Taxes,
Depreciation, and
Amortization /
Interest Expense -0.49 10.21
Earnings before Interest, Taxes,
Depreciation, and Amortization
Profit before tax +
Interest Expense -600000 16791000
Interest Expense 1220000 1644000
Gearing Ratios
Debt Equity Ratio
Total Long Term
Debts / Shareholders
Fund 3.98 1.05
Total Long Term Debts 49000000 37200000
Shareholders Fund 12300000 35400000
Total Debt to Total Assets
Total Debt / Total
Assets 0.71 0.78
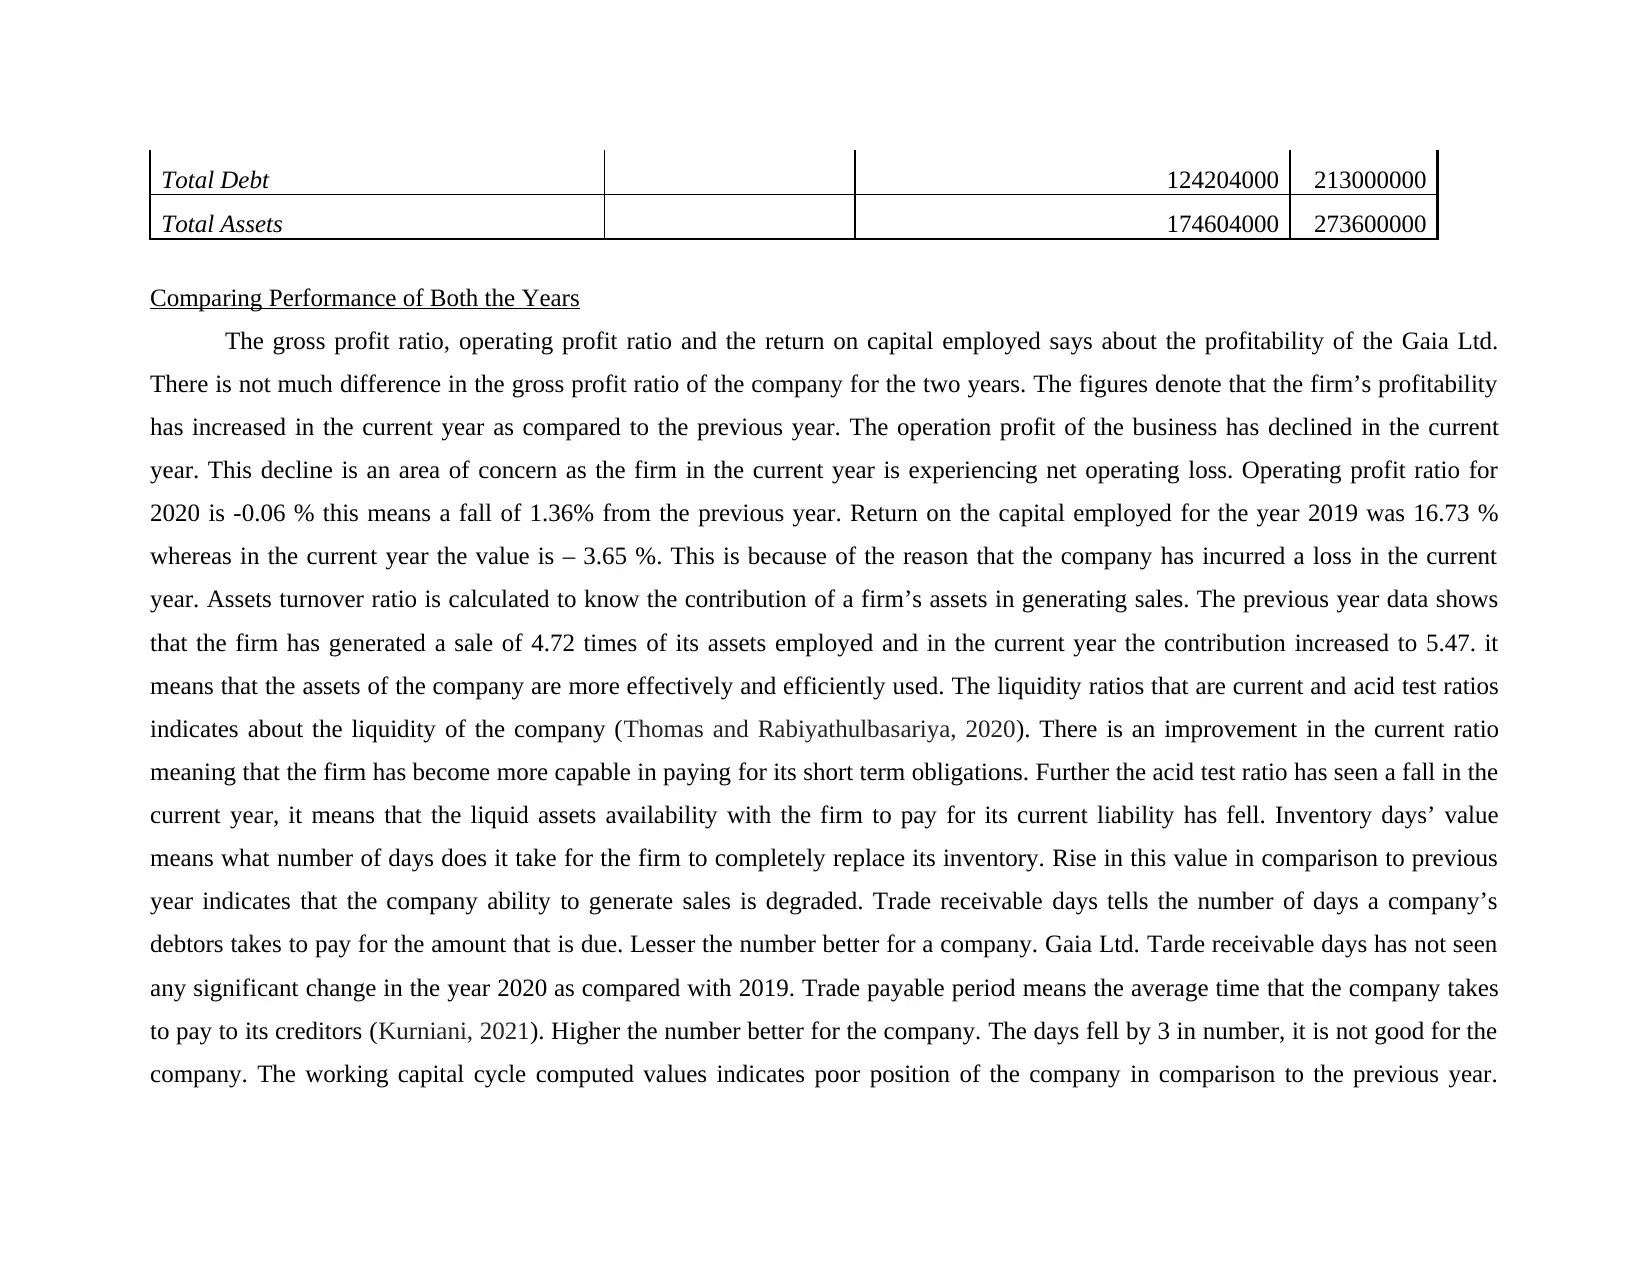
Total Debt 124204000 213000000
Total Assets 174604000 273600000
Comparing Performance of Both the Years
The gross profit ratio, operating profit ratio and the return on capital employed says about the profitability of the Gaia Ltd.
There is not much difference in the gross profit ratio of the company for the two years. The figures denote that the firm’s profitability
has increased in the current year as compared to the previous year. The operation profit of the business has declined in the current
year. This decline is an area of concern as the firm in the current year is experiencing net operating loss. Operating profit ratio for
2020 is -0.06 % this means a fall of 1.36% from the previous year. Return on the capital employed for the year 2019 was 16.73 %
whereas in the current year the value is – 3.65 %. This is because of the reason that the company has incurred a loss in the current
year. Assets turnover ratio is calculated to know the contribution of a firm’s assets in generating sales. The previous year data shows
that the firm has generated a sale of 4.72 times of its assets employed and in the current year the contribution increased to 5.47. it
means that the assets of the company are more effectively and efficiently used. The liquidity ratios that are current and acid test ratios
indicates about the liquidity of the company (Thomas and Rabiyathulbasariya, 2020). There is an improvement in the current ratio
meaning that the firm has become more capable in paying for its short term obligations. Further the acid test ratio has seen a fall in the
current year, it means that the liquid assets availability with the firm to pay for its current liability has fell. Inventory days’ value
means what number of days does it take for the firm to completely replace its inventory. Rise in this value in comparison to previous
year indicates that the company ability to generate sales is degraded. Trade receivable days tells the number of days a company’s
debtors takes to pay for the amount that is due. Lesser the number better for a company. Gaia Ltd. Tarde receivable days has not seen
any significant change in the year 2020 as compared with 2019. Trade payable period means the average time that the company takes
to pay to its creditors (Kurniani, 2021). Higher the number better for the company. The days fell by 3 in number, it is not good for the
company. The working capital cycle computed values indicates poor position of the company in comparison to the previous year.
⊘ This is a preview!⊘
Do you want full access?
Subscribe today to unlock all pages.
Trusted by 1+ million students worldwide
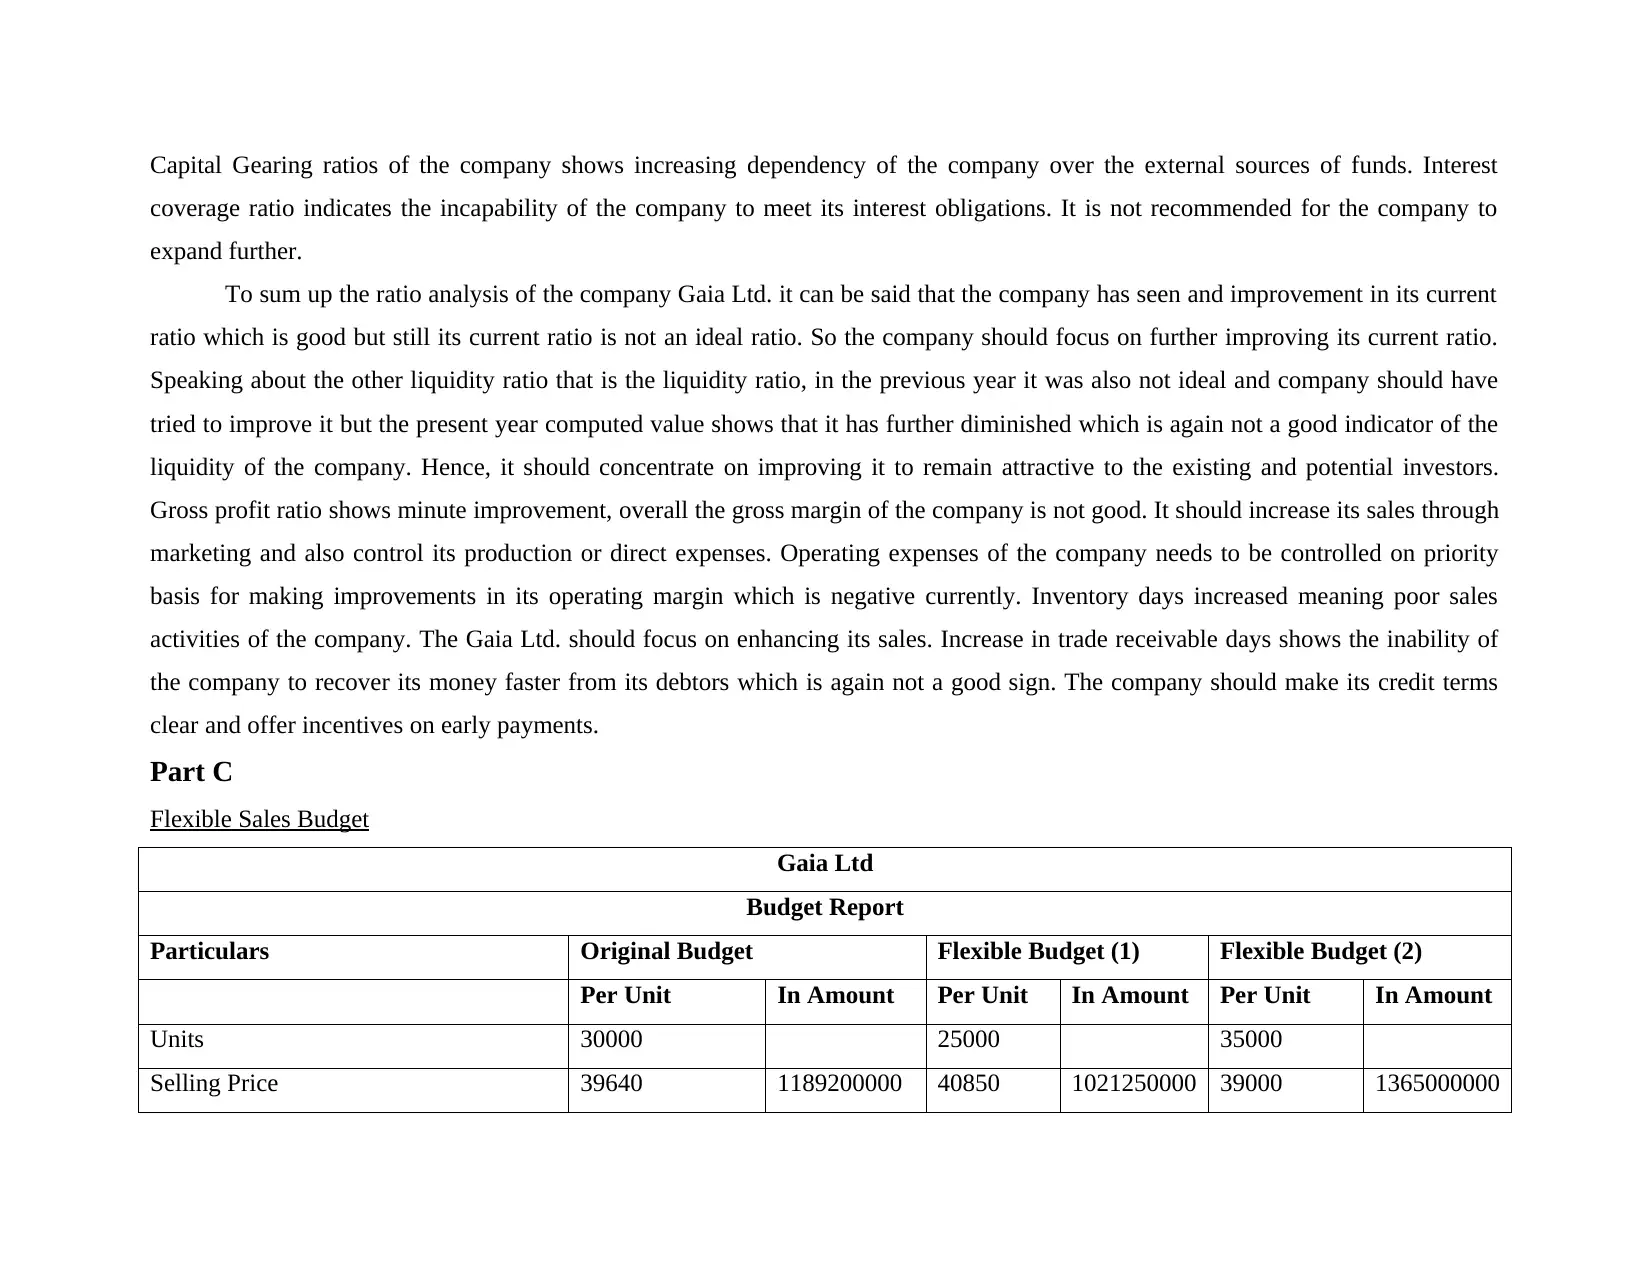
Capital Gearing ratios of the company shows increasing dependency of the company over the external sources of funds. Interest
coverage ratio indicates the incapability of the company to meet its interest obligations. It is not recommended for the company to
expand further.
To sum up the ratio analysis of the company Gaia Ltd. it can be said that the company has seen and improvement in its current
ratio which is good but still its current ratio is not an ideal ratio. So the company should focus on further improving its current ratio.
Speaking about the other liquidity ratio that is the liquidity ratio, in the previous year it was also not ideal and company should have
tried to improve it but the present year computed value shows that it has further diminished which is again not a good indicator of the
liquidity of the company. Hence, it should concentrate on improving it to remain attractive to the existing and potential investors.
Gross profit ratio shows minute improvement, overall the gross margin of the company is not good. It should increase its sales through
marketing and also control its production or direct expenses. Operating expenses of the company needs to be controlled on priority
basis for making improvements in its operating margin which is negative currently. Inventory days increased meaning poor sales
activities of the company. The Gaia Ltd. should focus on enhancing its sales. Increase in trade receivable days shows the inability of
the company to recover its money faster from its debtors which is again not a good sign. The company should make its credit terms
clear and offer incentives on early payments.
Part C
Flexible Sales Budget
Gaia Ltd
Budget Report
Particulars Original Budget Flexible Budget (1) Flexible Budget (2)
Per Unit In Amount Per Unit In Amount Per Unit In Amount
Units 30000 25000 35000
Selling Price 39640 1189200000 40850 1021250000 39000 1365000000
Paraphrase This Document
Need a fresh take? Get an instant paraphrase of this document with our AI Paraphraser
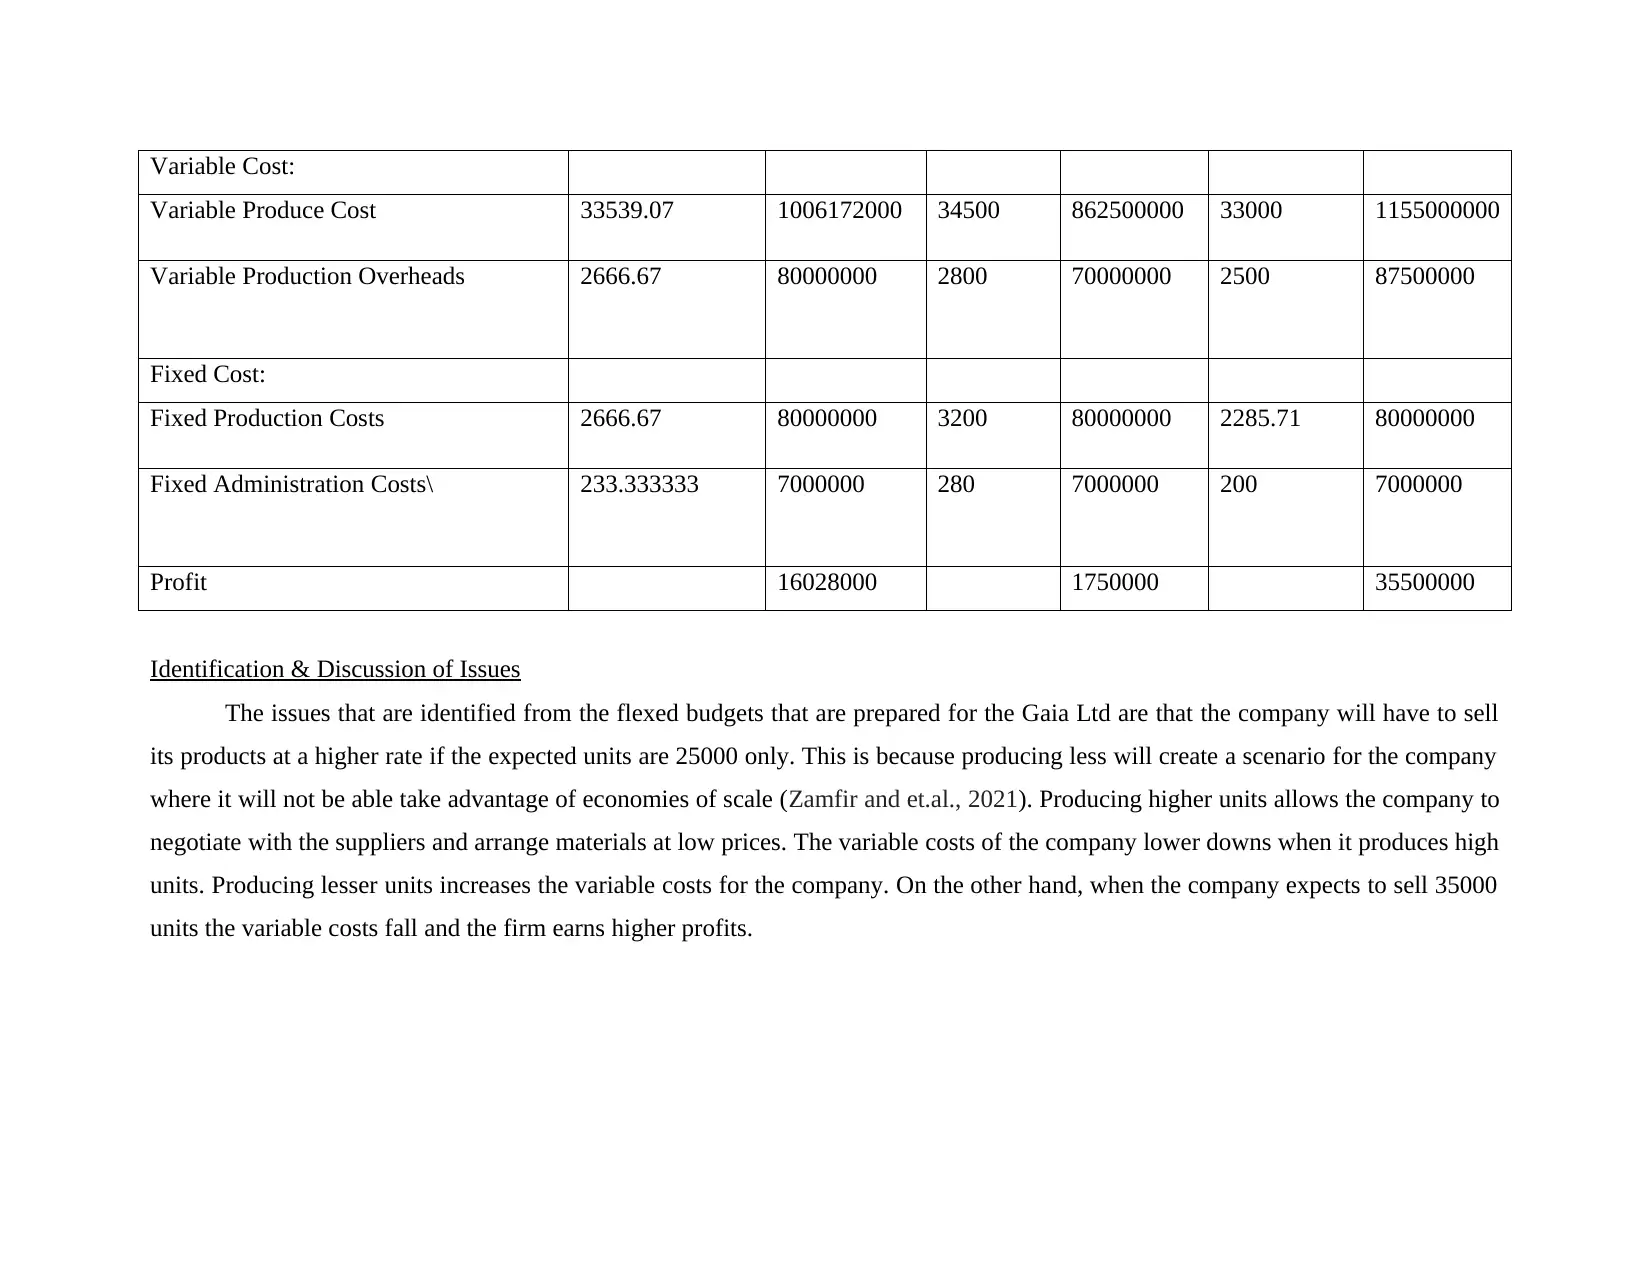
Variable Cost:
Variable Produce Cost 33539.07 1006172000 34500 862500000 33000 1155000000
Variable Production Overheads 2666.67 80000000 2800 70000000 2500 87500000
Fixed Cost:
Fixed Production Costs 2666.67 80000000 3200 80000000 2285.71 80000000
Fixed Administration Costs\ 233.333333 7000000 280 7000000 200 7000000
Profit 16028000 1750000 35500000
Identification & Discussion of Issues
The issues that are identified from the flexed budgets that are prepared for the Gaia Ltd are that the company will have to sell
its products at a higher rate if the expected units are 25000 only. This is because producing less will create a scenario for the company
where it will not be able take advantage of economies of scale (Zamfir and et.al., 2021). Producing higher units allows the company to
negotiate with the suppliers and arrange materials at low prices. The variable costs of the company lower downs when it produces high
units. Producing lesser units increases the variable costs for the company. On the other hand, when the company expects to sell 35000
units the variable costs fall and the firm earns higher profits.

⊘ This is a preview!⊘
Do you want full access?
Subscribe today to unlock all pages.
Trusted by 1+ million students worldwide
1 out of 13
Related Documents


Your All-in-One AI-Powered Toolkit for Academic Success.
+13062052269
info@desklib.com
Available 24*7 on WhatsApp / Email
![[object Object]](/_next/static/media/star-bottom.7253800d.svg)
Unlock your academic potential
Copyright © 2020–2026 A2Z Services. All Rights Reserved. Developed and managed by ZUCOL.