Galliford Try plc Stock and Capital Budgeting Report, MAN7MFI, 2019
VerifiedAdded on 2023/03/30
|73
|6837
|193
Report
AI Summary
This report analyzes Galliford Try plc's financial performance, focusing on its stock price movement and its relationship with macroeconomic variables such as unemployment data and house prices. The analysis includes descriptive statistics of the company's stock returns, calculating standard deviation to assess investor risk, and examining correlations between stock prices and macroeconomic indicators. The report also performs a capital budgeting analysis, evaluating different investment projects using methods like NPV, AAR, IRR, and payback period to recommend the most financially viable project. Furthermore, it explores funding options, considering debt and equity, and suggests the most suitable financing approach for the company based on its capital structure. The findings reveal the volatility of Galliford Try plc's stock, its correlation with economic factors, and recommendations for capital allocation and financing strategies.

Management Finance and
Science
Name:
Student Number:
Module Code: MAN7MFI
Submitted to:
Submission date:
Word Count:
Science
Name:
Student Number:
Module Code: MAN7MFI
Submitted to:
Submission date:
Word Count:
Paraphrase This Document
Need a fresh take? Get an instant paraphrase of this document with our AI Paraphraser
Continuation Page
Contents
1. Executive Summary..............................................................................................4
2. Introduction............................................................................................................6
3. Galliford Try plc Analysis.......................................................................................7
3.1 Galliford Try plc stock price analysis..................................................................7
3.1.1 Descriptive statistics of Galliford Try plc’s return based on 1-year historical
prices.....................................................................................................................7
3.1.2 Descriptive statistics of Bovis Homes plc’s return based on 1-year
historical prices......................................................................................................8
3.1.3 Standard deviation as a measure of investor risk........................................8
3.1.4 The relationship between the close share prices of Galliford Try plc and
two macro-economic data sets...........................................................................10
3.1.5 The correlation between the monthly unemployment data and the relevant
close share price of Galliford Try plc and the monthly HPI data and the close
share price for year 2018....................................................................................11
3.1.6 Statistical significance and practical importance of the relationship
between the Galliford Try plc and two macro-economic variables (monthly HPI
and Unemployment data)....................................................................................12
3.2 Analysis of a capital budgeting decision...........................................................14
3.2.1 Selecting an investment project using capital budgeting methods and
analysing the risks of the project.........................................................................14
Page 2 of 73
Continuation Page
3.2.2 Choice of funding for the project................................................................17
4. Conclusion and Recommendation......................................................................19
5. List of References...............................................................................................21
Appendix 1..................................................................................................................24
Appendix 2..................................................................................................................44
Appendix 3..................................................................................................................65
Appendix 4..................................................................................................................65
Page 3 of 73
⊘ This is a preview!⊘
Do you want full access?
Subscribe today to unlock all pages.
Trusted by 1+ million students worldwide
Continuation Page
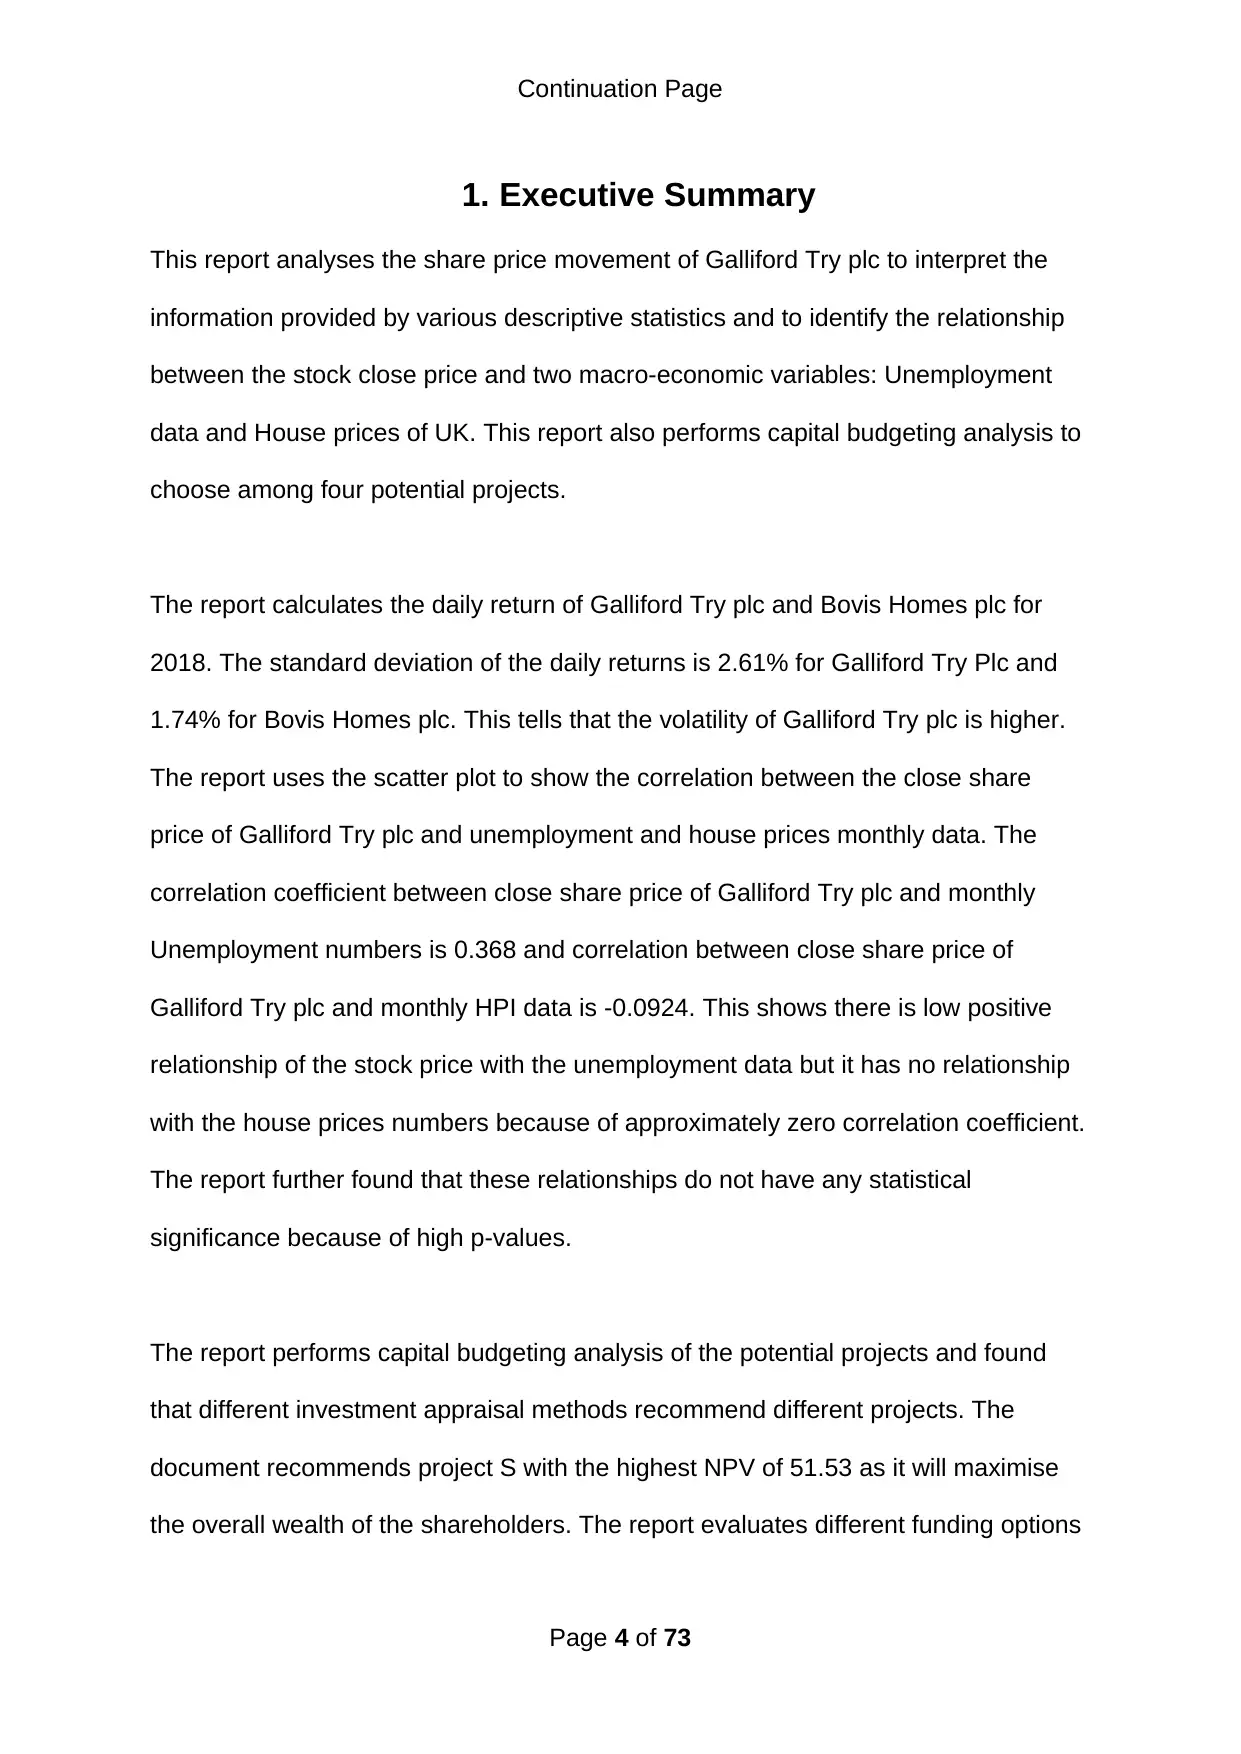
1. Executive Summary
This report analyses the share price movement of Galliford Try plc to interpret the
information provided by various descriptive statistics and to identify the relationship
between the stock close price and two macro-economic variables: Unemployment
data and House prices of UK. This report also performs capital budgeting analysis to
choose among four potential projects.
The report calculates the daily return of Galliford Try plc and Bovis Homes plc for
2018. The standard deviation of the daily returns is 2.61% for Galliford Try Plc and
1.74% for Bovis Homes plc. This tells that the volatility of Galliford Try plc is higher.
The report uses the scatter plot to show the correlation between the close share
price of Galliford Try plc and unemployment and house prices monthly data. The
correlation coefficient between close share price of Galliford Try plc and monthly
Unemployment numbers is 0.368 and correlation between close share price of
Galliford Try plc and monthly HPI data is -0.0924. This shows there is low positive
relationship of the stock price with the unemployment data but it has no relationship
with the house prices numbers because of approximately zero correlation coefficient.
The report further found that these relationships do not have any statistical
significance because of high p-values.
The report performs capital budgeting analysis of the potential projects and found
that different investment appraisal methods recommend different projects. The
document recommends project S with the highest NPV of 51.53 as it will maximise
the overall wealth of the shareholders. The report evaluates different funding options
Page 4 of 73
Paraphrase This Document
Need a fresh take? Get an instant paraphrase of this document with our AI Paraphraser
Continuation Page
like debt and equity. It recommends the use of debt funding by Galliford Try plc to
fund this project.
Page 5 of 73
like debt and equity. It recommends the use of debt funding by Galliford Try plc to
fund this project.
Page 5 of 73
Continuation Page
2. Introduction
This report analyses the share price movement of Galliford Try plc to interpret the
information provided by various descriptive statistics and to identify the relationship
between the stock close price and two macro-economic variables. This report also
performs capital budgeting analysis to choose among four potential projects.
Galliford Try plc is a well-established construction company based in UK. The
company is among the top 250 companies listed on the London Stock Exchange.
The main business operations of the company include house-building, construction
and regeneration. Bovis Homes plc is another company in the same industry that is a
competitor of Galliford Try plc.
The report calculates the daily return of Galliford Try plc and Bovis Homes plc over
2018. It then calculates the descriptive statistics like mean, median, range and
standard deviation. It then analyse the standard deviation of both the stocks to
compare risk to the investors. The report also plots the correlation between Galliford
Try plc and two macro-economic variables and it calculates the correlation coefficient
to study the strength of their relationships.
The report uses different capital budgeting methods like NPV, AAR, IIR and payback
period to choose from four potential projects. It also analyses debt and equity
funding options to recommend the one that will suit Galliford Try plc according to its
capital structure.
Page 6 of 73
⊘ This is a preview!⊘
Do you want full access?
Subscribe today to unlock all pages.
Trusted by 1+ million students worldwide
Continuation Page
3. Galliford Try plc Analysis
3.1 Galliford Try plc stock price analysis
3.1.1 Descriptive statistics of Galliford Try plc’s return based on 1-year
historical prices.
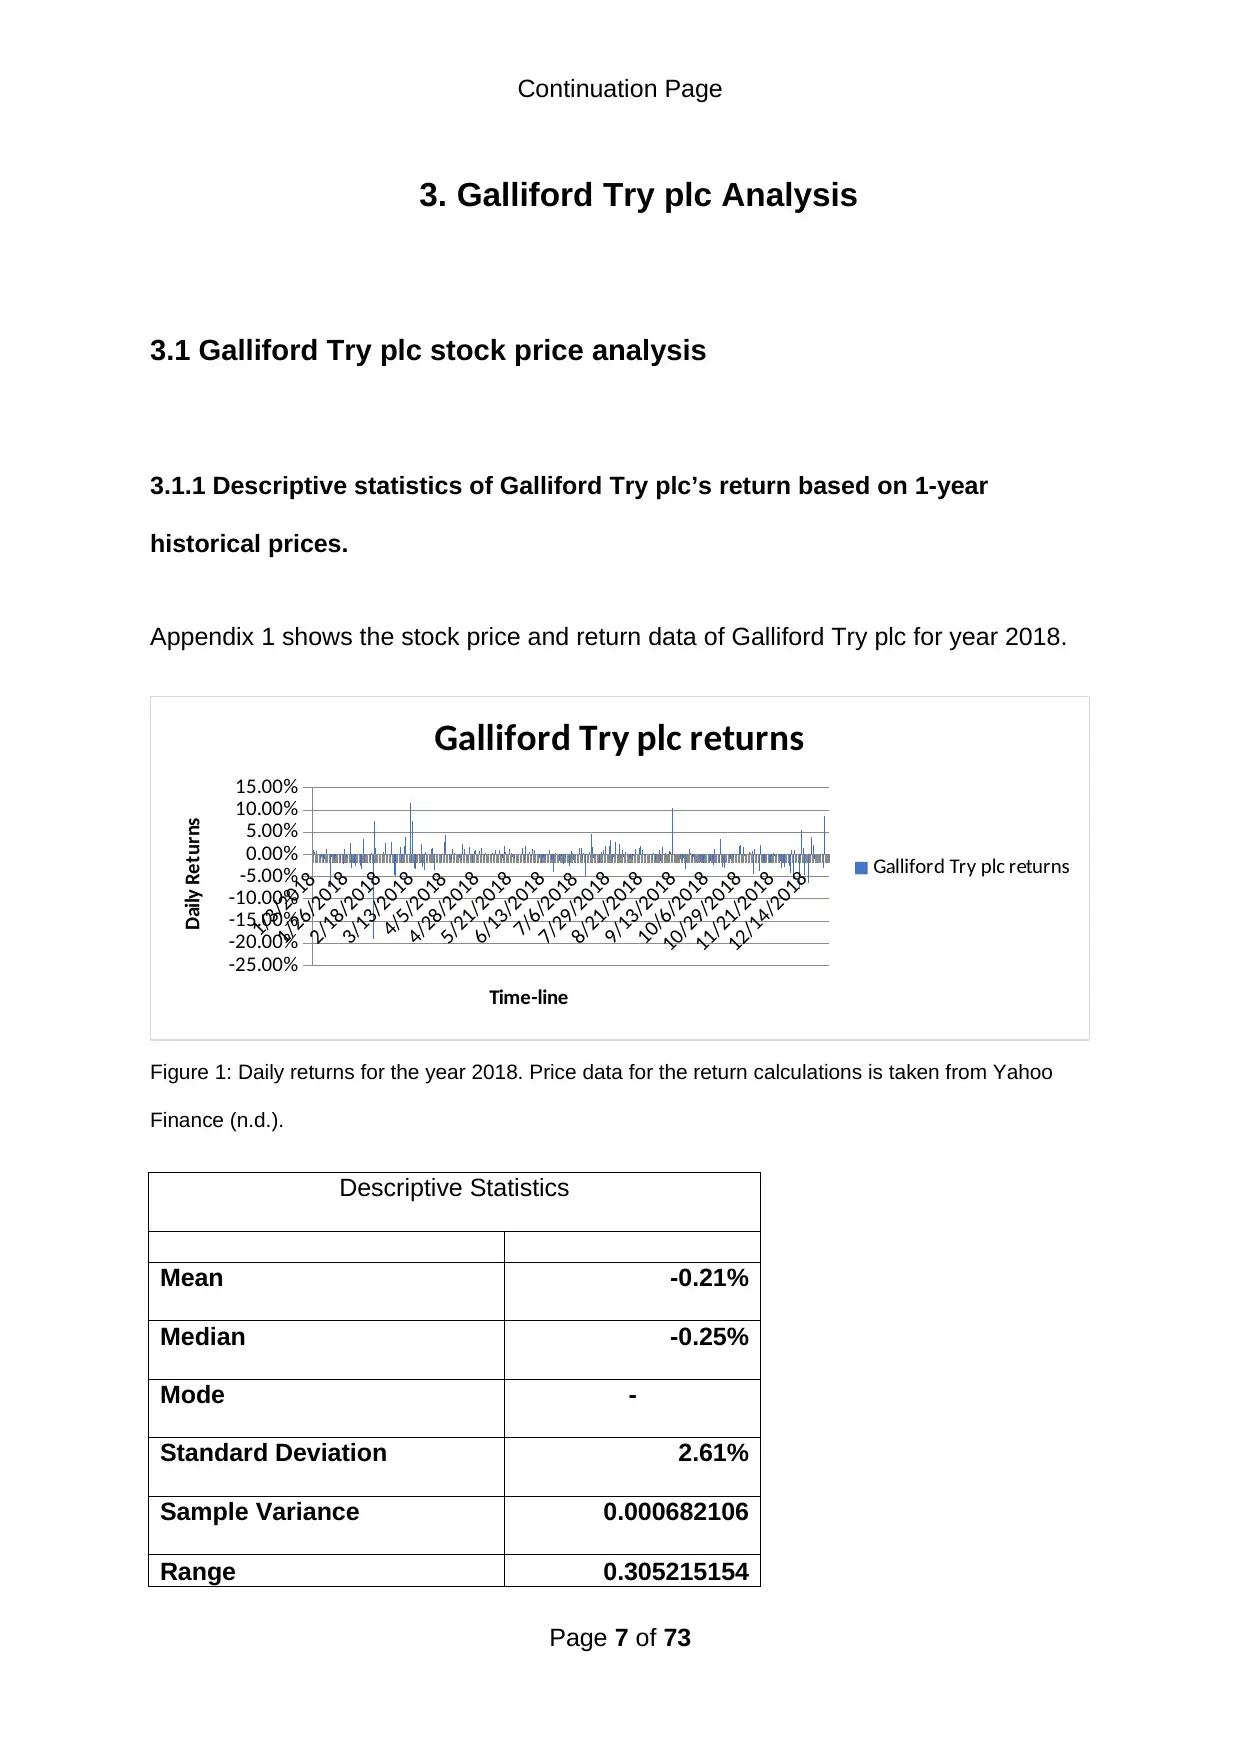
Appendix 1 shows the stock price and return data of Galliford Try plc for year 2018.
1/3/2018
1/26/2018
2/18/2018
3/13/2018
4/5/2018
4/28/2018
5/21/2018
6/13/2018
7/6/2018
7/29/2018
8/21/2018
9/13/2018
10/6/2018
10/29/2018
11/21/2018
12/14/2018
-25.00%
-20.00%
-15.00%
-10.00%
-5.00%
0.00%
5.00%
10.00%
15.00%
Galliford Try plc returns
Galliford Try plc returns
Time-line
Daily Returns
Figure 1: Daily returns for the year 2018. Price data for the return calculations is taken from Yahoo
Finance (n.d.).
Descriptive Statistics
Mean -0.21%
Median -0.25%
Mode -
Standard Deviation 2.61%
Sample Variance 0.000682106
Range 0.305215154
Page 7 of 73
3. Galliford Try plc Analysis
3.1 Galliford Try plc stock price analysis
3.1.1 Descriptive statistics of Galliford Try plc’s return based on 1-year
historical prices.
Appendix 1 shows the stock price and return data of Galliford Try plc for year 2018.
1/3/2018
1/26/2018
2/18/2018
3/13/2018
4/5/2018
4/28/2018
5/21/2018
6/13/2018
7/6/2018
7/29/2018
8/21/2018
9/13/2018
10/6/2018
10/29/2018
11/21/2018
12/14/2018
-25.00%
-20.00%
-15.00%
-10.00%
-5.00%
0.00%
5.00%
10.00%
15.00%
Galliford Try plc returns
Galliford Try plc returns
Time-line
Daily Returns
Figure 1: Daily returns for the year 2018. Price data for the return calculations is taken from Yahoo
Finance (n.d.).
Descriptive Statistics
Mean -0.21%
Median -0.25%
Mode -
Standard Deviation 2.61%
Sample Variance 0.000682106
Range 0.305215154
Page 7 of 73
Paraphrase This Document
Need a fresh take? Get an instant paraphrase of this document with our AI Paraphraser
Continuation Page
Table 1: Descriptive Statistics based on daily return data
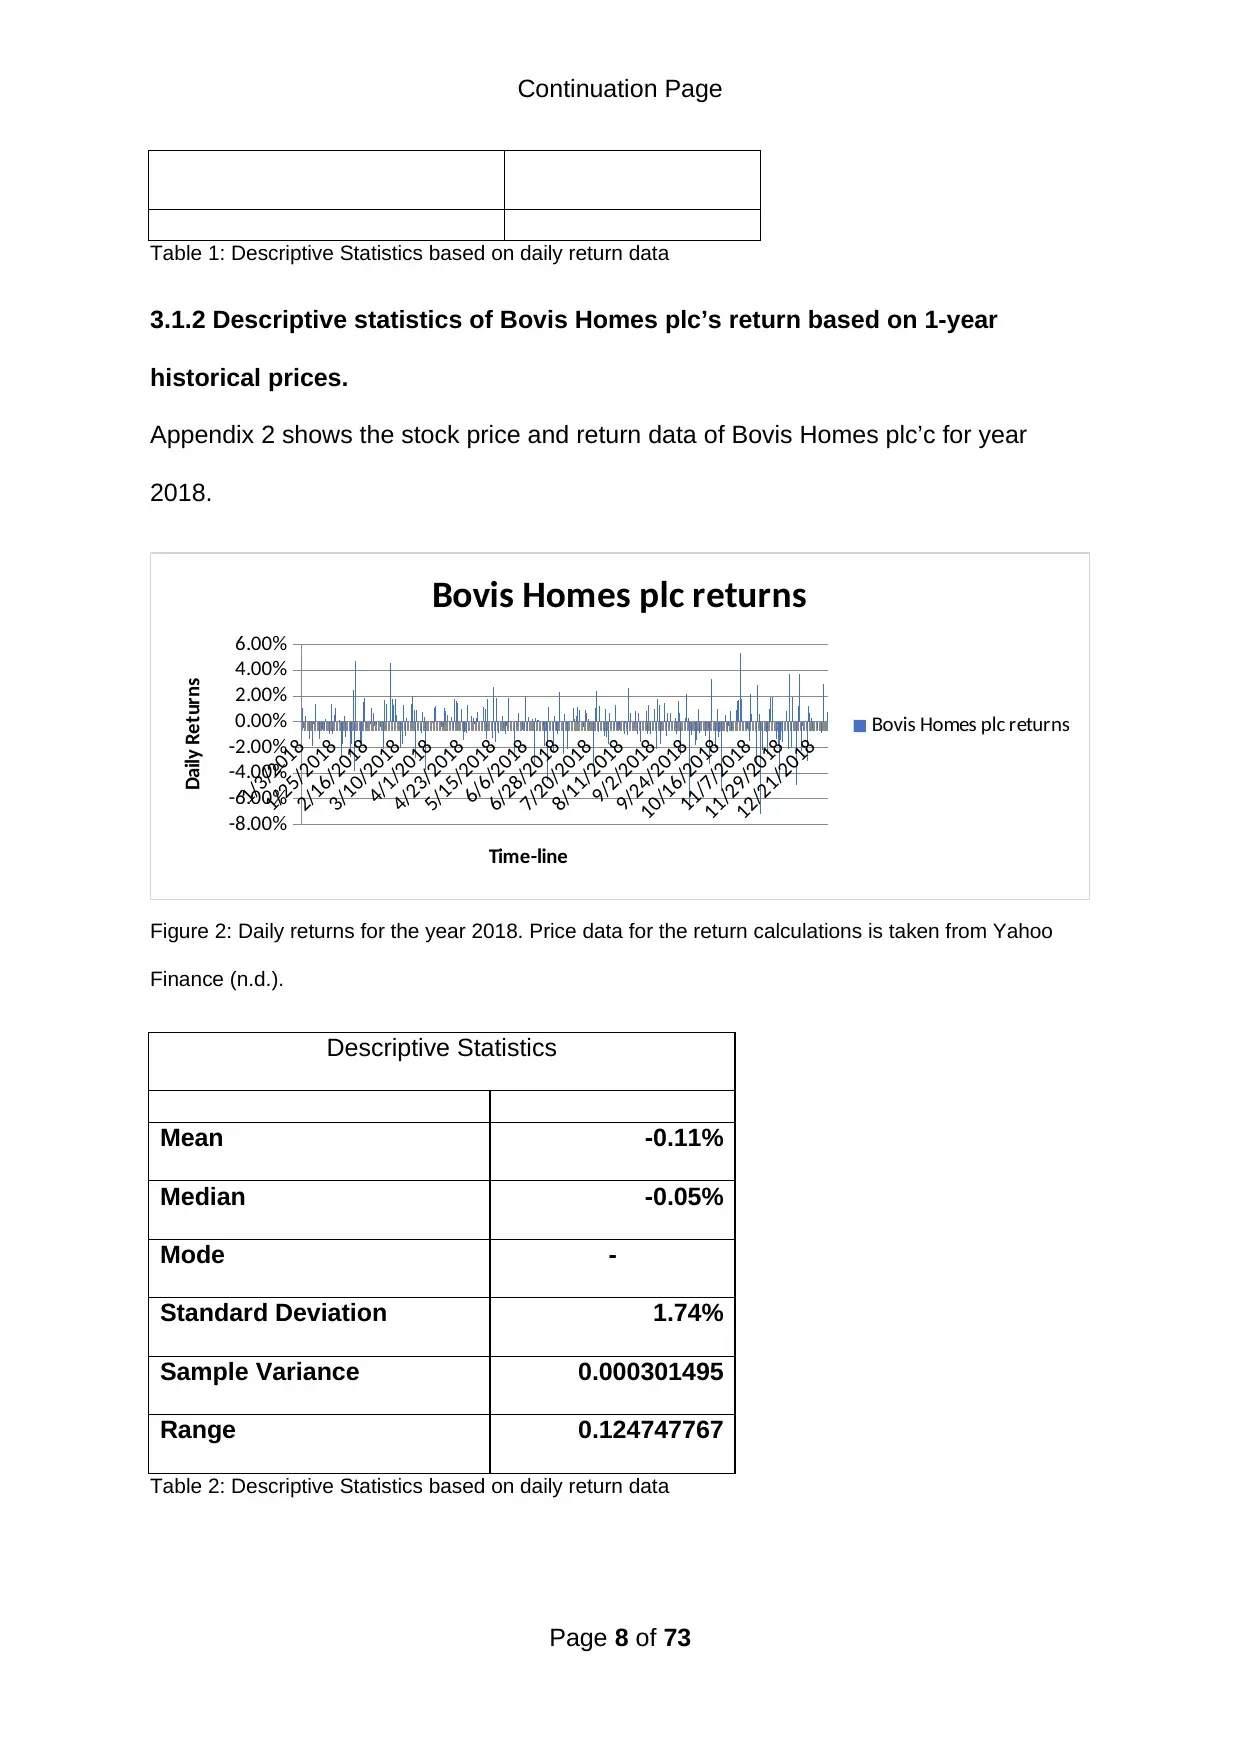
3.1.2 Descriptive statistics of Bovis Homes plc’s return based on 1-year
historical prices.
Appendix 2 shows the stock price and return data of Bovis Homes plc’c for year
2018.
1/3/2018
1/25/2018
2/16/2018
3/10/2018
4/1/2018
4/23/2018
5/15/2018
6/6/2018
6/28/2018
7/20/2018
8/11/2018
9/2/2018
9/24/2018
10/16/2018
11/7/2018
11/29/2018
12/21/2018
-8.00%
-6.00%
-4.00%
-2.00%
0.00%
2.00%
4.00%
6.00%
Bovis Homes plc returns
Bovis Homes plc returns
Time-line
Daily Returns
Figure 2: Daily returns for the year 2018. Price data for the return calculations is taken from Yahoo
Finance (n.d.).
Descriptive Statistics
Mean -0.11%
Median -0.05%
Mode -
Standard Deviation 1.74%
Sample Variance 0.000301495
Range 0.124747767
Table 2: Descriptive Statistics based on daily return data
Page 8 of 73
Table 1: Descriptive Statistics based on daily return data
3.1.2 Descriptive statistics of Bovis Homes plc’s return based on 1-year
historical prices.
Appendix 2 shows the stock price and return data of Bovis Homes plc’c for year
2018.
1/3/2018
1/25/2018
2/16/2018
3/10/2018
4/1/2018
4/23/2018
5/15/2018
6/6/2018
6/28/2018
7/20/2018
8/11/2018
9/2/2018
9/24/2018
10/16/2018
11/7/2018
11/29/2018
12/21/2018
-8.00%
-6.00%
-4.00%
-2.00%
0.00%
2.00%
4.00%
6.00%
Bovis Homes plc returns
Bovis Homes plc returns
Time-line
Daily Returns
Figure 2: Daily returns for the year 2018. Price data for the return calculations is taken from Yahoo
Finance (n.d.).
Descriptive Statistics
Mean -0.11%
Median -0.05%
Mode -
Standard Deviation 1.74%
Sample Variance 0.000301495
Range 0.124747767
Table 2: Descriptive Statistics based on daily return data
Page 8 of 73
Continuation Page
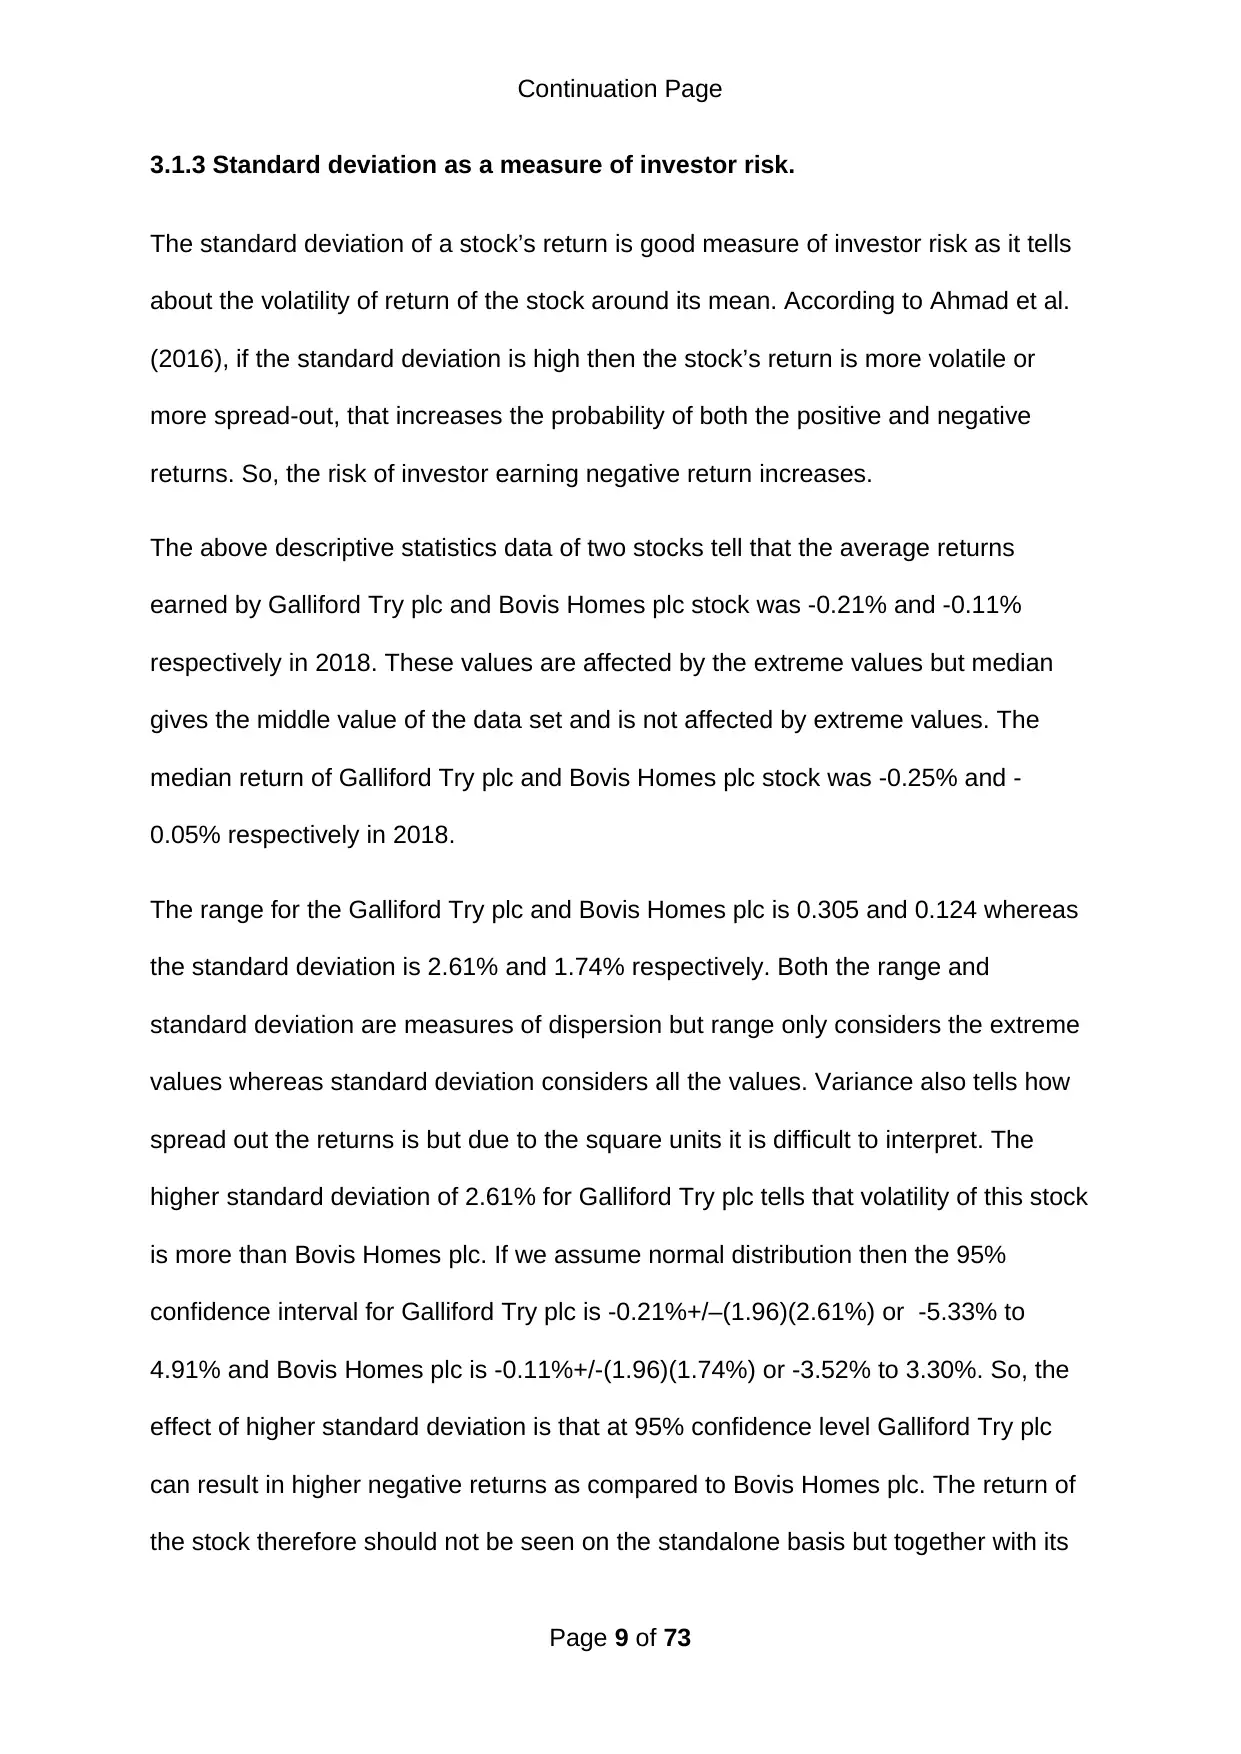
3.1.3 Standard deviation as a measure of investor risk.
The standard deviation of a stock’s return is good measure of investor risk as it tells
about the volatility of return of the stock around its mean. According to Ahmad et al.
(2016), if the standard deviation is high then the stock’s return is more volatile or
more spread-out, that increases the probability of both the positive and negative
returns. So, the risk of investor earning negative return increases.
The above descriptive statistics data of two stocks tell that the average returns
earned by Galliford Try plc and Bovis Homes plc stock was -0.21% and -0.11%
respectively in 2018. These values are affected by the extreme values but median
gives the middle value of the data set and is not affected by extreme values. The
median return of Galliford Try plc and Bovis Homes plc stock was -0.25% and -
0.05% respectively in 2018.
The range for the Galliford Try plc and Bovis Homes plc is 0.305 and 0.124 whereas
the standard deviation is 2.61% and 1.74% respectively. Both the range and
standard deviation are measures of dispersion but range only considers the extreme
values whereas standard deviation considers all the values. Variance also tells how
spread out the returns is but due to the square units it is difficult to interpret. The
higher standard deviation of 2.61% for Galliford Try plc tells that volatility of this stock
is more than Bovis Homes plc. If we assume normal distribution then the 95%
confidence interval for Galliford Try plc is -0.21%+/–(1.96)(2.61%) or -5.33% to
4.91% and Bovis Homes plc is -0.11%+/-(1.96)(1.74%) or -3.52% to 3.30%. So, the
effect of higher standard deviation is that at 95% confidence level Galliford Try plc
can result in higher negative returns as compared to Bovis Homes plc. The return of
the stock therefore should not be seen on the standalone basis but together with its
Page 9 of 73
⊘ This is a preview!⊘
Do you want full access?
Subscribe today to unlock all pages.
Trusted by 1+ million students worldwide
Continuation Page
standard deviation. Sharpe ratio (Stock return – risk free rate)/ standard deviation of
stock return, is one such measure. Using risk free rate of 1.47% (yield on 30 year
government bond), sharpe ratio for Galliford Try plc is (-0.21%-1.47)/2.61% = -0.64
and Bovis Homes plc is (-0.11%-1.47)/1.74% = -0.90. The downside of using
standard deviation as an investors risk measure is first that it assumes that the
returns are normally distributed and second it is affected by the outliers. Also,
standard deviation tells about the volatility on positive as well as negative side but
most investors are just concerned about the downside risk.
3.1.4 The relationship between the close share prices of Galliford Try plc and
two macro-economic data sets.
The macro-economic fundamentals can have effect on the stock price of the
company. The relationship between these variables and stock can be analysed
through correlation or scatter plot (Anderson and Semmelroth, n.d.).
The following plot shows the correlation between the monthly close share prices of
Galliford Try plc and monthly unemployment and UK house prices. The relevant data
is shown in the appendix 3.
Page 10 of 73
Paraphrase This Document
Need a fresh take? Get an instant paraphrase of this document with our AI Paraphraser
Continuation Page
650 750 850 950 1050 1150
1300000
1320000
1340000
1360000
1380000
1400000
1420000
1440000
1460000
1480000
115
116
117
118
119
120
121
122
Unemployment Numbers
Housing Price Numbers
Galliford Try plc close price
Unemployment Numbers
Housing Price Numbers
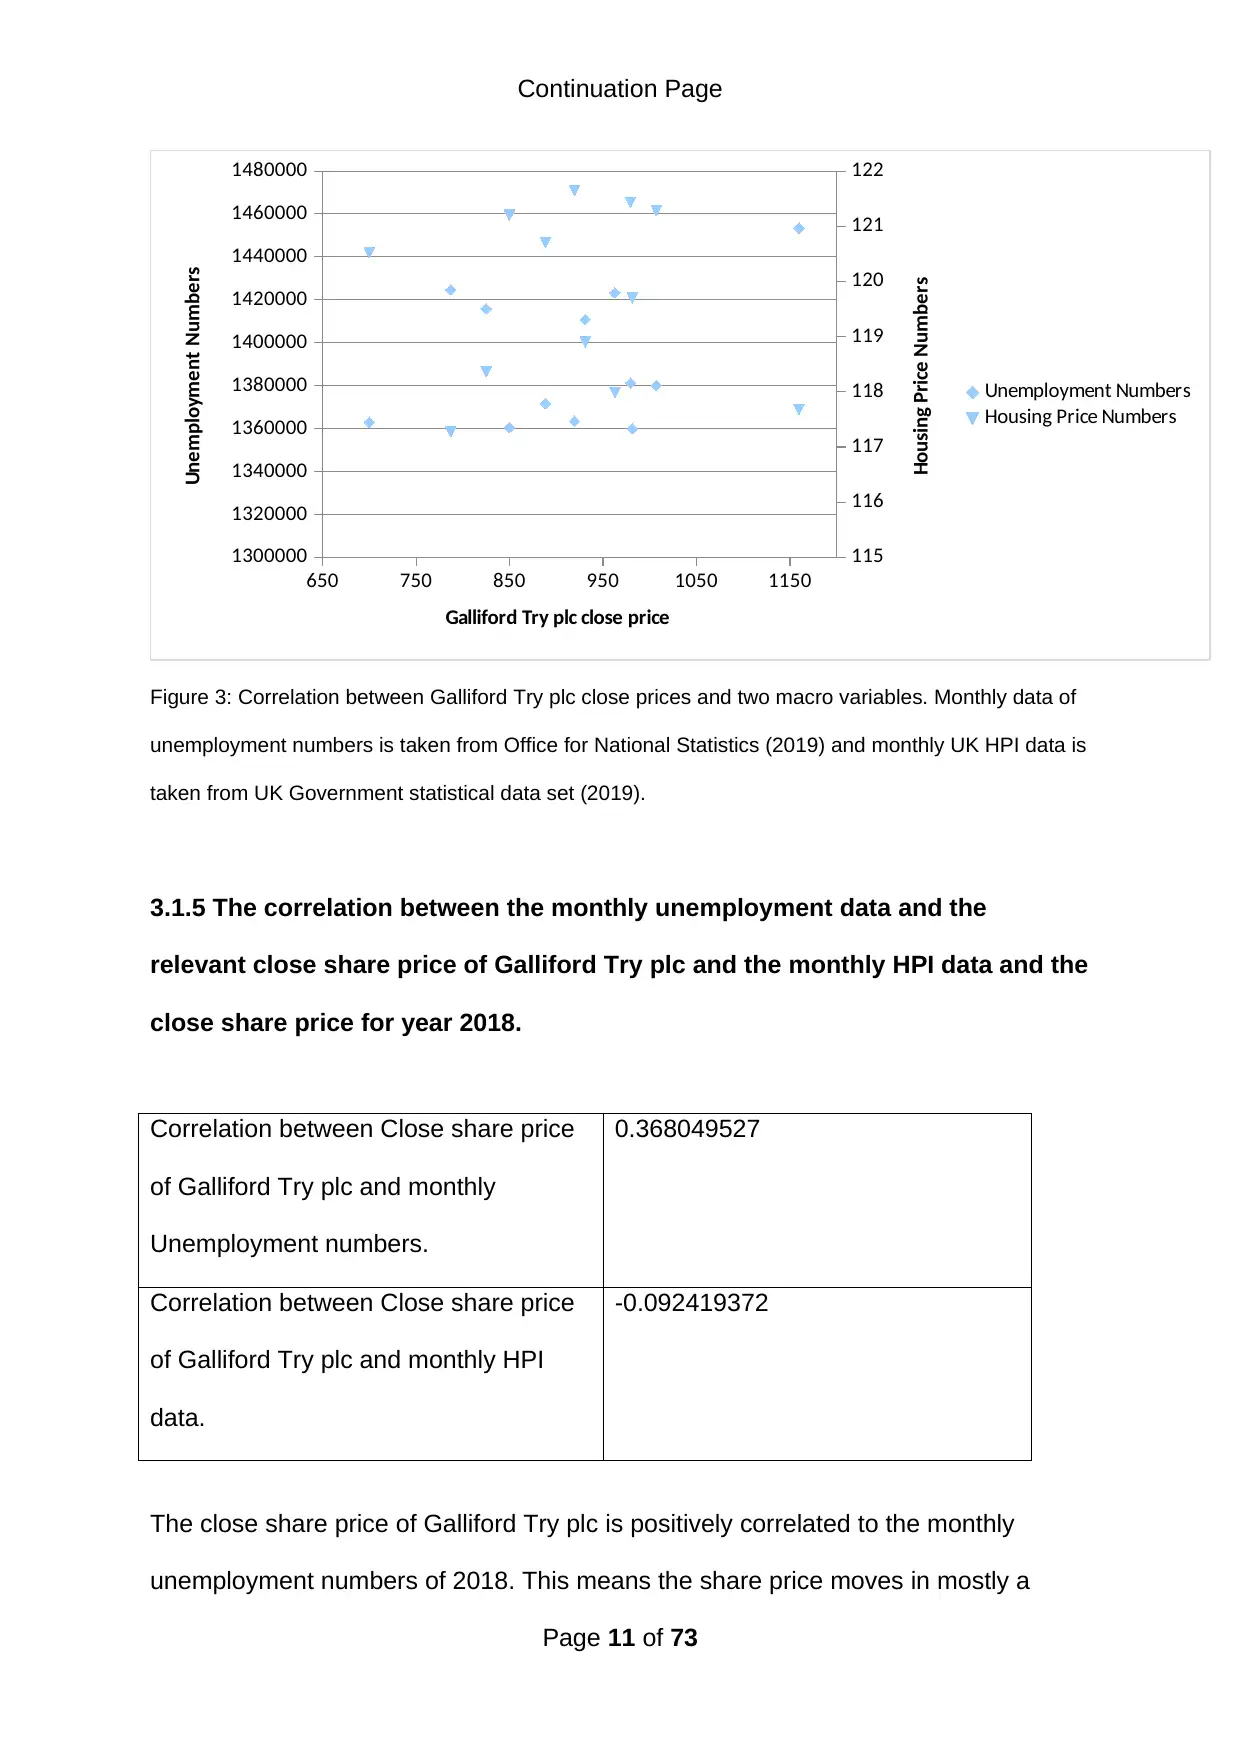
Figure 3: Correlation between Galliford Try plc close prices and two macro variables. Monthly data of
unemployment numbers is taken from Office for National Statistics (2019) and monthly UK HPI data is
taken from UK Government statistical data set (2019).
3.1.5 The correlation between the monthly unemployment data and the
relevant close share price of Galliford Try plc and the monthly HPI data and the
close share price for year 2018.
Correlation between Close share price
of Galliford Try plc and monthly
Unemployment numbers.
0.368049527
Correlation between Close share price
of Galliford Try plc and monthly HPI
data.
-0.092419372
The close share price of Galliford Try plc is positively correlated to the monthly
unemployment numbers of 2018. This means the share price moves in mostly a
Page 11 of 73
650 750 850 950 1050 1150
1300000
1320000
1340000
1360000
1380000
1400000
1420000
1440000
1460000
1480000
115
116
117
118
119
120
121
122
Unemployment Numbers
Housing Price Numbers
Galliford Try plc close price
Unemployment Numbers
Housing Price Numbers
Figure 3: Correlation between Galliford Try plc close prices and two macro variables. Monthly data of
unemployment numbers is taken from Office for National Statistics (2019) and monthly UK HPI data is
taken from UK Government statistical data set (2019).
3.1.5 The correlation between the monthly unemployment data and the
relevant close share price of Galliford Try plc and the monthly HPI data and the
close share price for year 2018.
Correlation between Close share price
of Galliford Try plc and monthly
Unemployment numbers.
0.368049527
Correlation between Close share price
of Galliford Try plc and monthly HPI
data.
-0.092419372
The close share price of Galliford Try plc is positively correlated to the monthly
unemployment numbers of 2018. This means the share price moves in mostly a
Page 11 of 73
Continuation Page
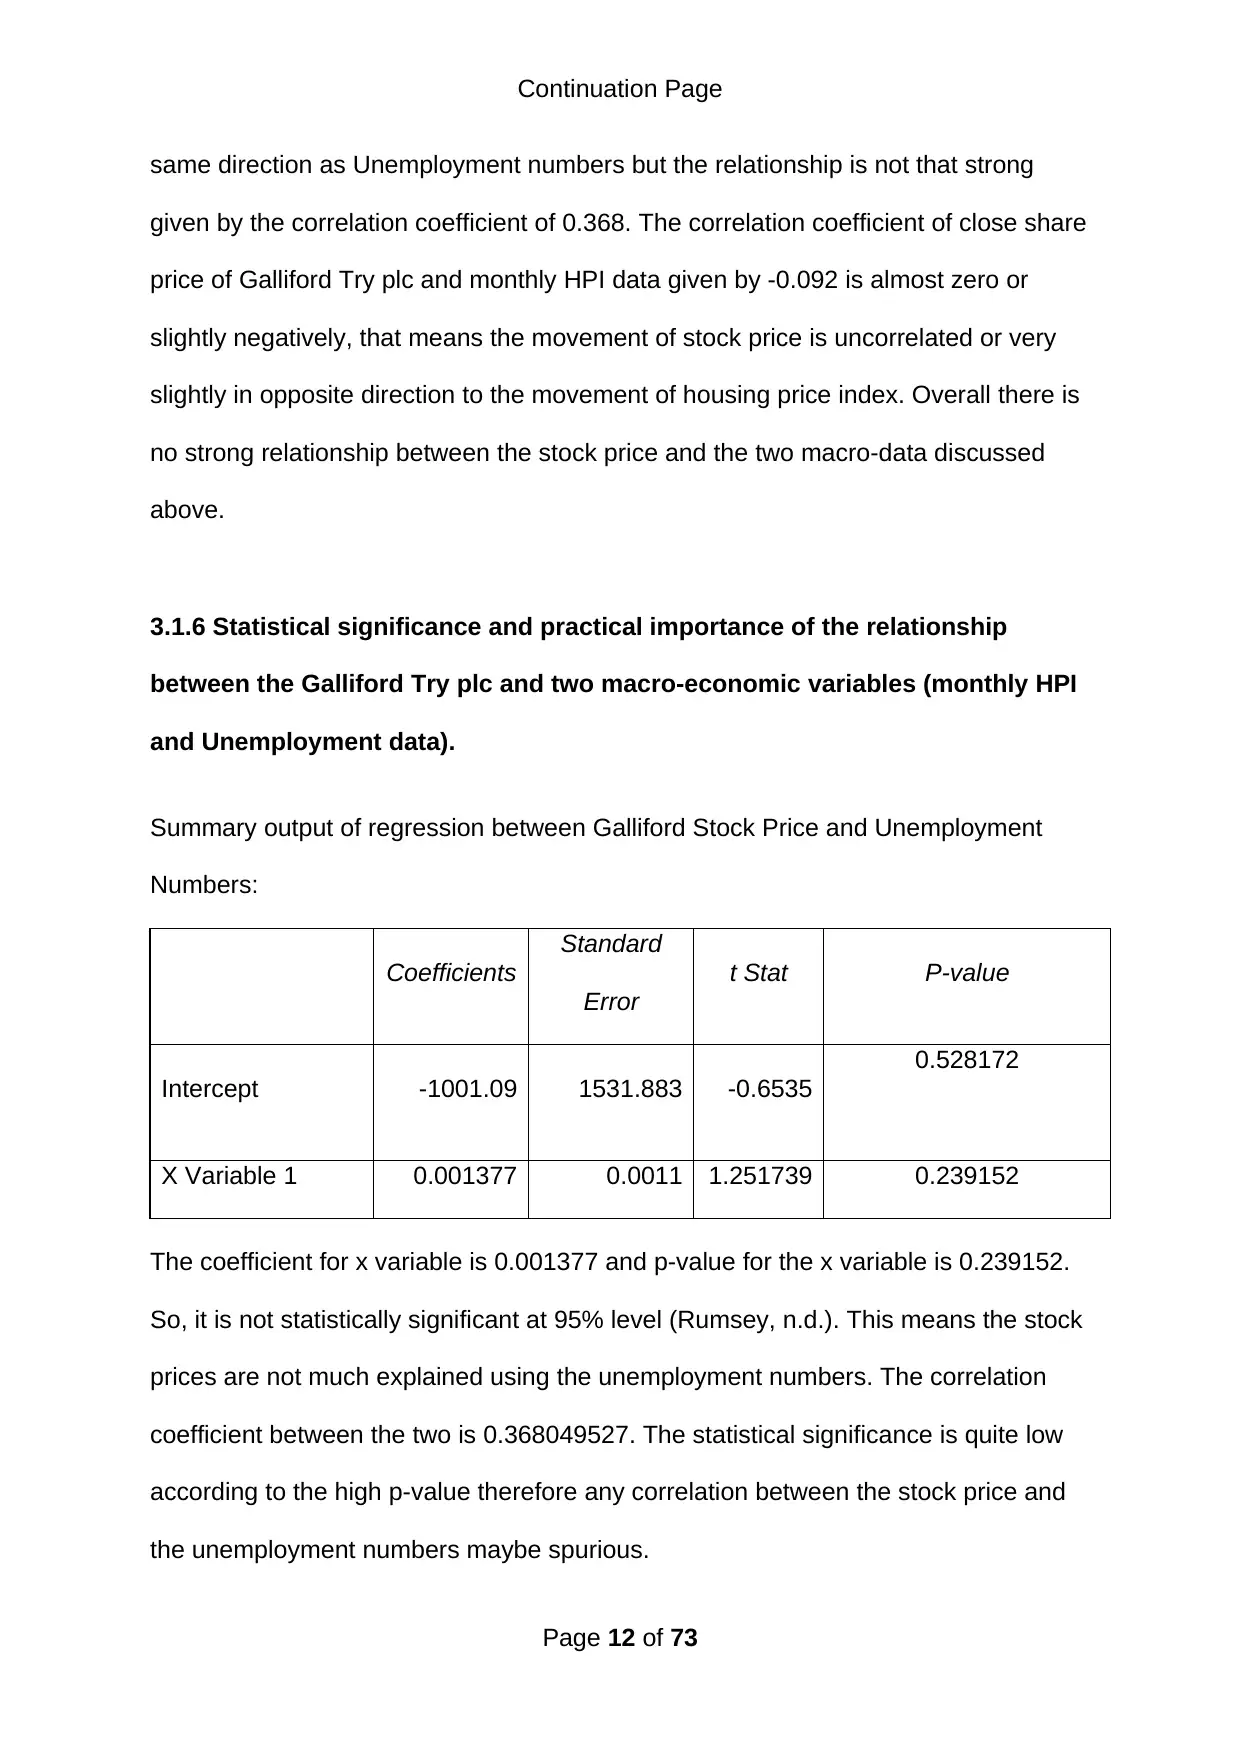
same direction as Unemployment numbers but the relationship is not that strong
given by the correlation coefficient of 0.368. The correlation coefficient of close share
price of Galliford Try plc and monthly HPI data given by -0.092 is almost zero or
slightly negatively, that means the movement of stock price is uncorrelated or very
slightly in opposite direction to the movement of housing price index. Overall there is
no strong relationship between the stock price and the two macro-data discussed
above.
3.1.6 Statistical significance and practical importance of the relationship
between the Galliford Try plc and two macro-economic variables (monthly HPI
and Unemployment data).
Summary output of regression between Galliford Stock Price and Unemployment
Numbers:
Coefficients
Standard
Error
t Stat P-value
Intercept -1001.09 1531.883 -0.6535
0.528172
X Variable 1 0.001377 0.0011 1.251739 0.239152
The coefficient for x variable is 0.001377 and p-value for the x variable is 0.239152.
So, it is not statistically significant at 95% level (Rumsey, n.d.). This means the stock
prices are not much explained using the unemployment numbers. The correlation
coefficient between the two is 0.368049527. The statistical significance is quite low
according to the high p-value therefore any correlation between the stock price and
the unemployment numbers maybe spurious.
Page 12 of 73
⊘ This is a preview!⊘
Do you want full access?
Subscribe today to unlock all pages.
Trusted by 1+ million students worldwide
1 out of 73


Your All-in-One AI-Powered Toolkit for Academic Success.
+13062052269
info@desklib.com
Available 24*7 on WhatsApp / Email
![[object Object]](/_next/static/media/star-bottom.7253800d.svg)
Unlock your academic potential
Copyright © 2020–2026 A2Z Services. All Rights Reserved. Developed and managed by ZUCOL.