Accounting and Finance Report: Gambling Company Performance Analysis
VerifiedAdded on 2020/03/28
|22
|3731
|69
Report
AI Summary
This report provides a detailed financial analysis of three UK-based gambling companies: William Hill Plc, Landbrokers Coral Group Plc, and Paddy Power Betfair Public Limited Company Plc. The analysis utilizes ratio analysis, including profitability, operational, and structural ratios, to assess their performance from 2014 to 2016. Key financial ratios such as Return on Assets (ROA), Return on Capital Employed (ROCE), cash flow as a percentage of operating revenue, net asset turnover, interest coverage ratio, current ratio, liquidity ratio, and gearing ratio are examined. Non-financial ratios like staff retention and customer retention are also considered. The report identifies trends, compares the companies' performances, and highlights the efficiency of each company in generating revenue and managing their finances. The analysis reveals insights into the companies' financial health, operational effectiveness, and debt management, providing a comprehensive overview of their financial positions during the analyzed period.
Running head: ACCOUNTING AND FINANCE FOR MANAGERS
Accounting and finance for managers
Name of the University
Name of the student
Authors note
Accounting and finance for managers
Name of the University
Name of the student
Authors note
Paraphrase This Document
Need a fresh take? Get an instant paraphrase of this document with our AI Paraphraser
1
ACCOUNTING AND FINANCE FOR MANAGERS
Table of Contents
Question 1:.......................................................................................................................................2
Requirement a).................................................................................................................................2
Requirement b)..............................................................................................................................12
Requirement c)...............................................................................................................................12
Question 2:.....................................................................................................................................13
Requirement a)...............................................................................................................................13
Requirement b)..............................................................................................................................15
References list and Bibliography:..................................................................................................18
2
ACCOUNTING AND FINANCE FOR MANAGERS
Question 1:
Requirement a)
The analysis of performance and financial position of all three companies provided is
done by using the tool of ratio analysis. Ten financial ratios that are selected for the purpose of
analysis are return on asset using net income, return on capital employed, cash flow as a
percentage of operating income, net asset turnover, interest coverage ratio, current ratio, liquidity
ratio, gearing ratio, operating revenue per employee and cost of employees. Non-financial ratios
that will be for the purpose of analysis are staff retention ratios and customer retention ratio
(Baber et al. 2013). Three gambling companies from UK gambling industry for identifying
performance analysis are William hill Plc, Landbrokers coral group Plc and Paddy power Betfair
public limited company limited Plc.
Financial ratios:
Profitability ratio:
2016 2015 2014
-10.00%
-5.00%
0.00%
5.00%
10.00%
15.00%
20.00%
25.00%
30.00%
RoA
William Hill Plc. Ladbrokers Coral Group Paddy Power Betfair
⊘ This is a preview!⊘
Do you want full access?
Subscribe today to unlock all pages.
Trusted by 1+ million students worldwide
3
ACCOUNTING AND FINANCE FOR MANAGERS
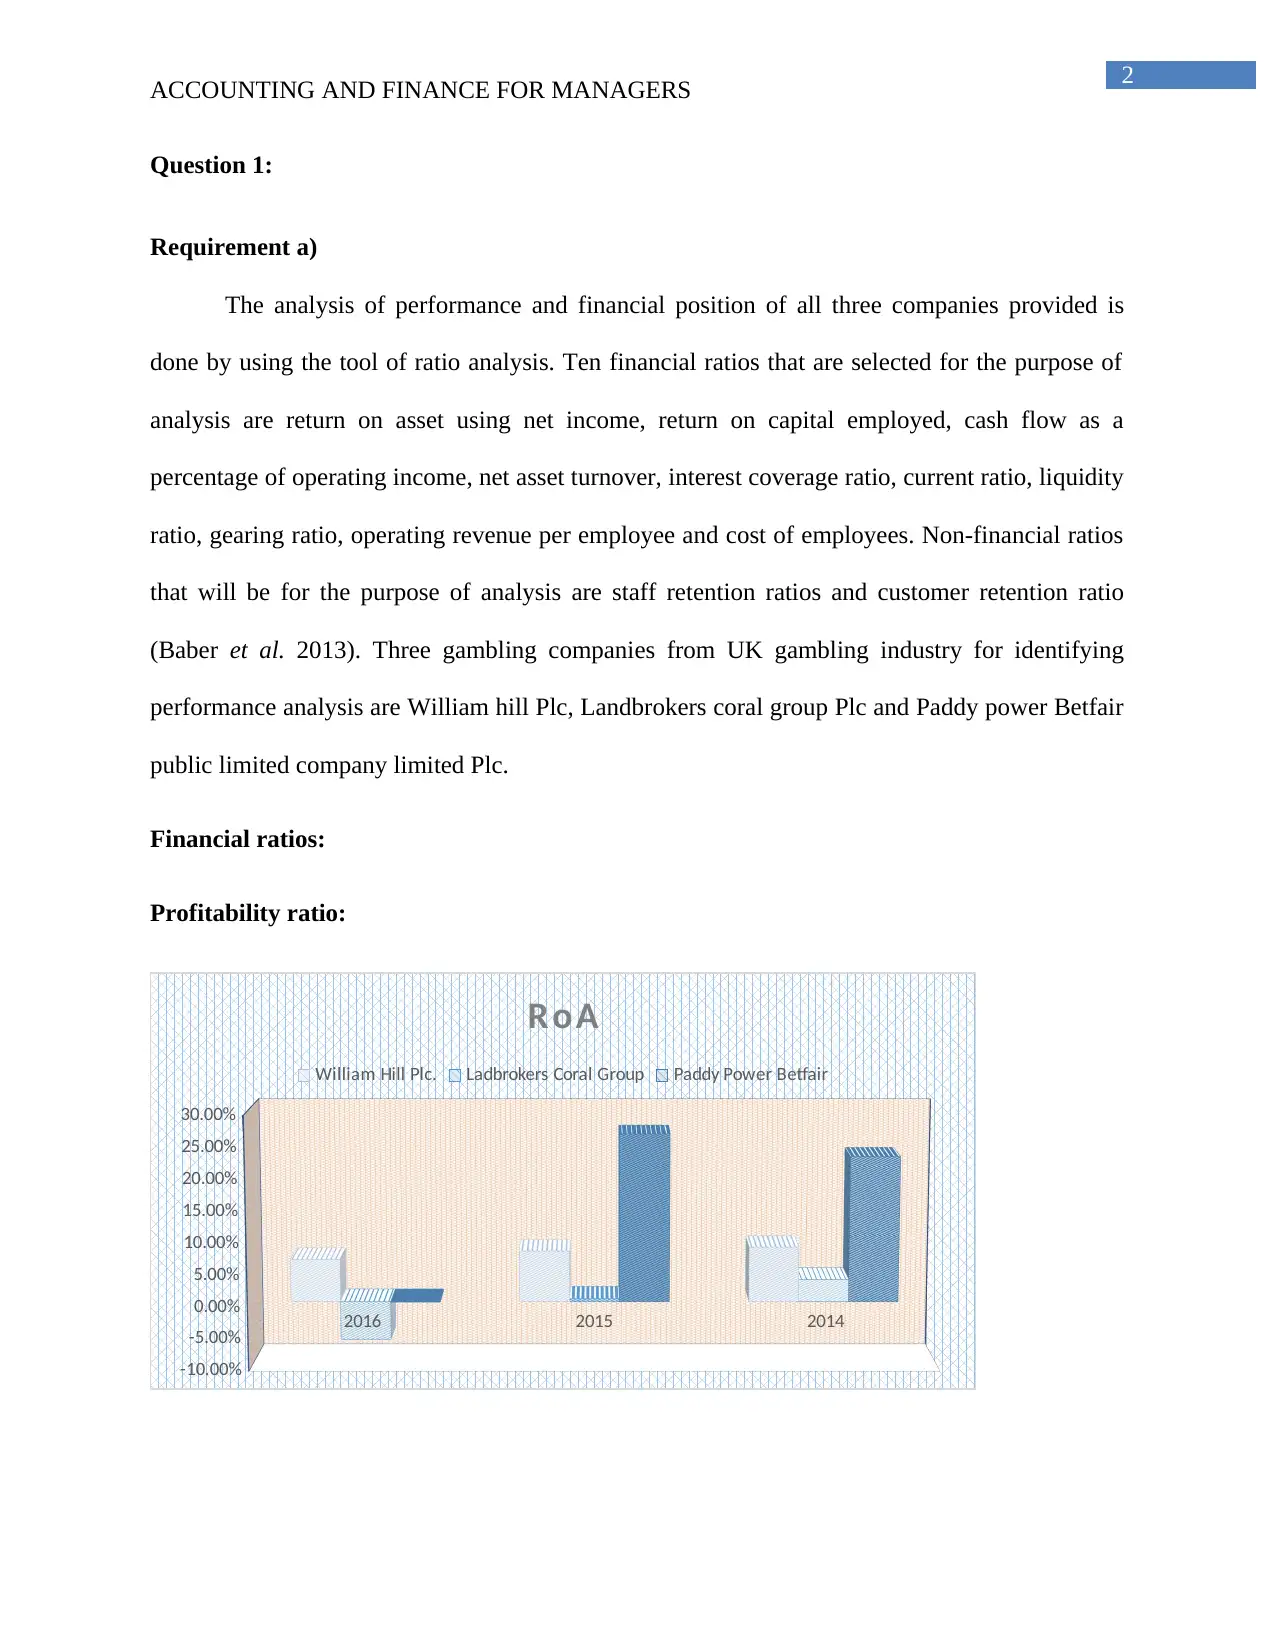
Return on asset (ROA) as a percentage of net income for William hill Plc has witnessed
substantial decline from 8.67 in year 2014 to 6.73 in year 2016 respectively. ROA for
Landbrokers coral group Plc in year 2014 stood at 3.52 that declined to 0.45 in year 2015 and
ratio further declined and became negative -6.02% in year 2016 respectively. Now, looking at
figures of Paddy power, ratio stood at 22.87 in year 2014 as against 26.41 in year 2015. There
was considerable decline in figure in year 2016 to -0.11. Therefore, one common thing that has
been identified for all three companies is declining trend of return on assets. Ratio stood at
significantly higher value for Paddy power compared to other companies. Average return on
assets for Paddy power is 16.39% compared to 7.83% and .68% for William and land broker.
Therefore, paddy power is more efficient in generating income from assets.
2016 2015 2014
-10.00%
0.00%
10.00%
20.00%
30.00%
40.00%
50.00%
60.00%
70.00%
ROCE
William Hill Plc. Ladbrokers Coral Group Paddy Power Betfair
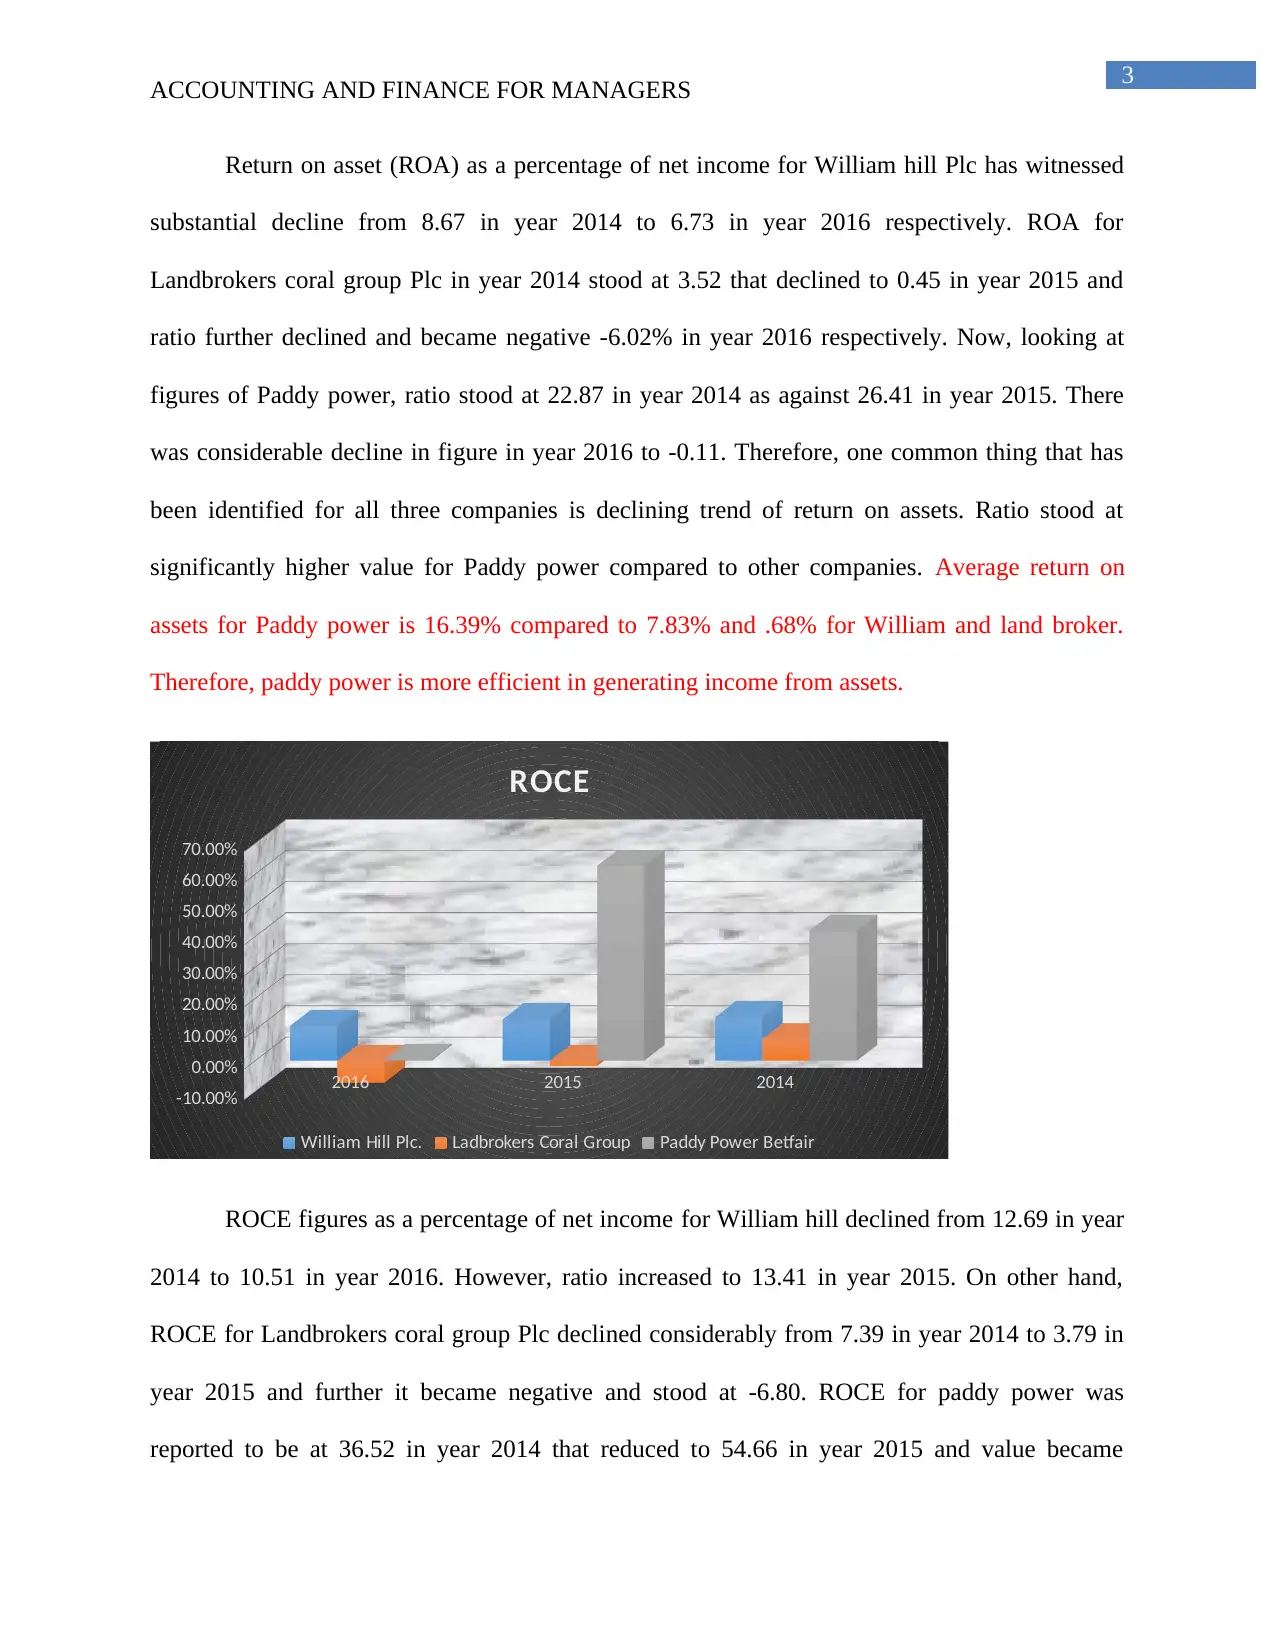
ROCE figures as a percentage of net income for William hill declined from 12.69 in year
2014 to 10.51 in year 2016. However, ratio increased to 13.41 in year 2015. On other hand,
ROCE for Landbrokers coral group Plc declined considerably from 7.39 in year 2014 to 3.79 in
year 2015 and further it became negative and stood at -6.80. ROCE for paddy power was
reported to be at 36.52 in year 2014 that reduced to 54.66 in year 2015 and value became
ACCOUNTING AND FINANCE FOR MANAGERS
Return on asset (ROA) as a percentage of net income for William hill Plc has witnessed
substantial decline from 8.67 in year 2014 to 6.73 in year 2016 respectively. ROA for
Landbrokers coral group Plc in year 2014 stood at 3.52 that declined to 0.45 in year 2015 and
ratio further declined and became negative -6.02% in year 2016 respectively. Now, looking at
figures of Paddy power, ratio stood at 22.87 in year 2014 as against 26.41 in year 2015. There
was considerable decline in figure in year 2016 to -0.11. Therefore, one common thing that has
been identified for all three companies is declining trend of return on assets. Ratio stood at
significantly higher value for Paddy power compared to other companies. Average return on
assets for Paddy power is 16.39% compared to 7.83% and .68% for William and land broker.
Therefore, paddy power is more efficient in generating income from assets.
2016 2015 2014
-10.00%
0.00%
10.00%
20.00%
30.00%
40.00%
50.00%
60.00%
70.00%
ROCE
William Hill Plc. Ladbrokers Coral Group Paddy Power Betfair
ROCE figures as a percentage of net income for William hill declined from 12.69 in year
2014 to 10.51 in year 2016. However, ratio increased to 13.41 in year 2015. On other hand,
ROCE for Landbrokers coral group Plc declined considerably from 7.39 in year 2014 to 3.79 in
year 2015 and further it became negative and stood at -6.80. ROCE for paddy power was
reported to be at 36.52 in year 2014 that reduced to 54.66 in year 2015 and value became
Paraphrase This Document
Need a fresh take? Get an instant paraphrase of this document with our AI Paraphraser
4
ACCOUNTING AND FINANCE FOR MANAGERS
negative -0.02 respectively. It can be seen from above figures that ROCE is highest for Paddy
power, however value decreased to negative in year 2016 unlike William hill whose value was
reported at 10.51. Therefore, it can be seen that William hill has highest ROCE as percentage of
net income in year 2016 compared to other two companies. Now, looking at average value, it can
be seen that paddy perform return on capital employed stood at 35.03% as against William Plc
and landbrokers at 12.94%and 0.61%. Therefore, paddy powers have been more efficient in
generating return on assets compared to other companies.
2016 2015 2014
0.00%
5.00%
10.00%
15.00%
20.00%
25.00%
Cash Flow/Operating Income
William Hill Plc. Ladbrokers Coral Group Paddy Power Betfair
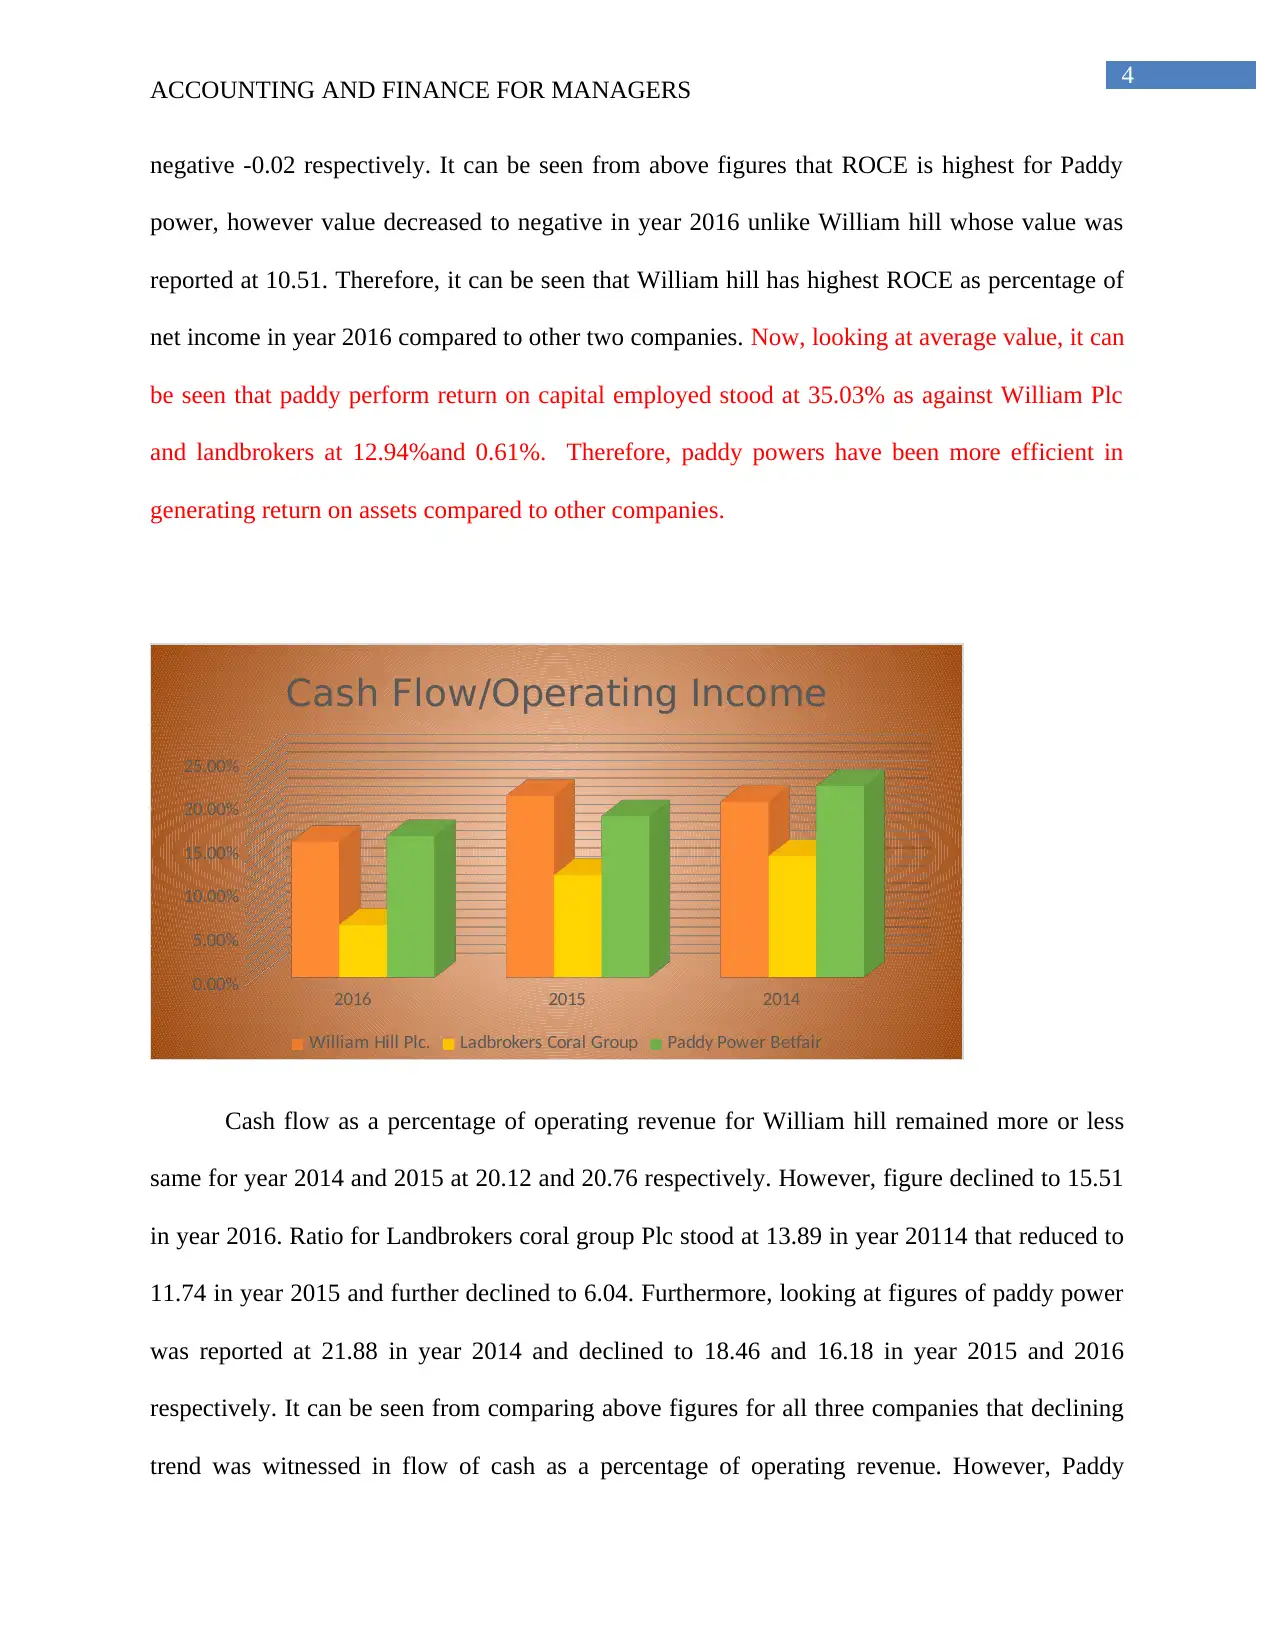
Cash flow as a percentage of operating revenue for William hill remained more or less
same for year 2014 and 2015 at 20.12 and 20.76 respectively. However, figure declined to 15.51
in year 2016. Ratio for Landbrokers coral group Plc stood at 13.89 in year 20114 that reduced to
11.74 in year 2015 and further declined to 6.04. Furthermore, looking at figures of paddy power
was reported at 21.88 in year 2014 and declined to 18.46 and 16.18 in year 2015 and 2016
respectively. It can be seen from comparing above figures for all three companies that declining
trend was witnessed in flow of cash as a percentage of operating revenue. However, Paddy
ACCOUNTING AND FINANCE FOR MANAGERS
negative -0.02 respectively. It can be seen from above figures that ROCE is highest for Paddy
power, however value decreased to negative in year 2016 unlike William hill whose value was
reported at 10.51. Therefore, it can be seen that William hill has highest ROCE as percentage of
net income in year 2016 compared to other two companies. Now, looking at average value, it can
be seen that paddy perform return on capital employed stood at 35.03% as against William Plc
and landbrokers at 12.94%and 0.61%. Therefore, paddy powers have been more efficient in
generating return on assets compared to other companies.
2016 2015 2014
0.00%
5.00%
10.00%
15.00%
20.00%
25.00%
Cash Flow/Operating Income
William Hill Plc. Ladbrokers Coral Group Paddy Power Betfair
Cash flow as a percentage of operating revenue for William hill remained more or less
same for year 2014 and 2015 at 20.12 and 20.76 respectively. However, figure declined to 15.51
in year 2016. Ratio for Landbrokers coral group Plc stood at 13.89 in year 20114 that reduced to
11.74 in year 2015 and further declined to 6.04. Furthermore, looking at figures of paddy power
was reported at 21.88 in year 2014 and declined to 18.46 and 16.18 in year 2015 and 2016
respectively. It can be seen from comparing above figures for all three companies that declining
trend was witnessed in flow of cash as a percentage of operating revenue. However, Paddy
5
ACCOUNTING AND FINANCE FOR MANAGERS
power is generating higher cash flow compared to William hill and Landbrokers. The average
value of cash flow as a percentage of operating revenue for paddy stood at 18.84% as against
18.8% and 10.56% for William and landbroker.
Operational ratios:
1 2 3
0
0.5
1
1.5
2
2.5
3
3.5
4
Net Asset Turnover
William Hill Plc.
Ladbrokes Coral Group Plc.
Paddy Power Betfair Public Limited Company Plc.
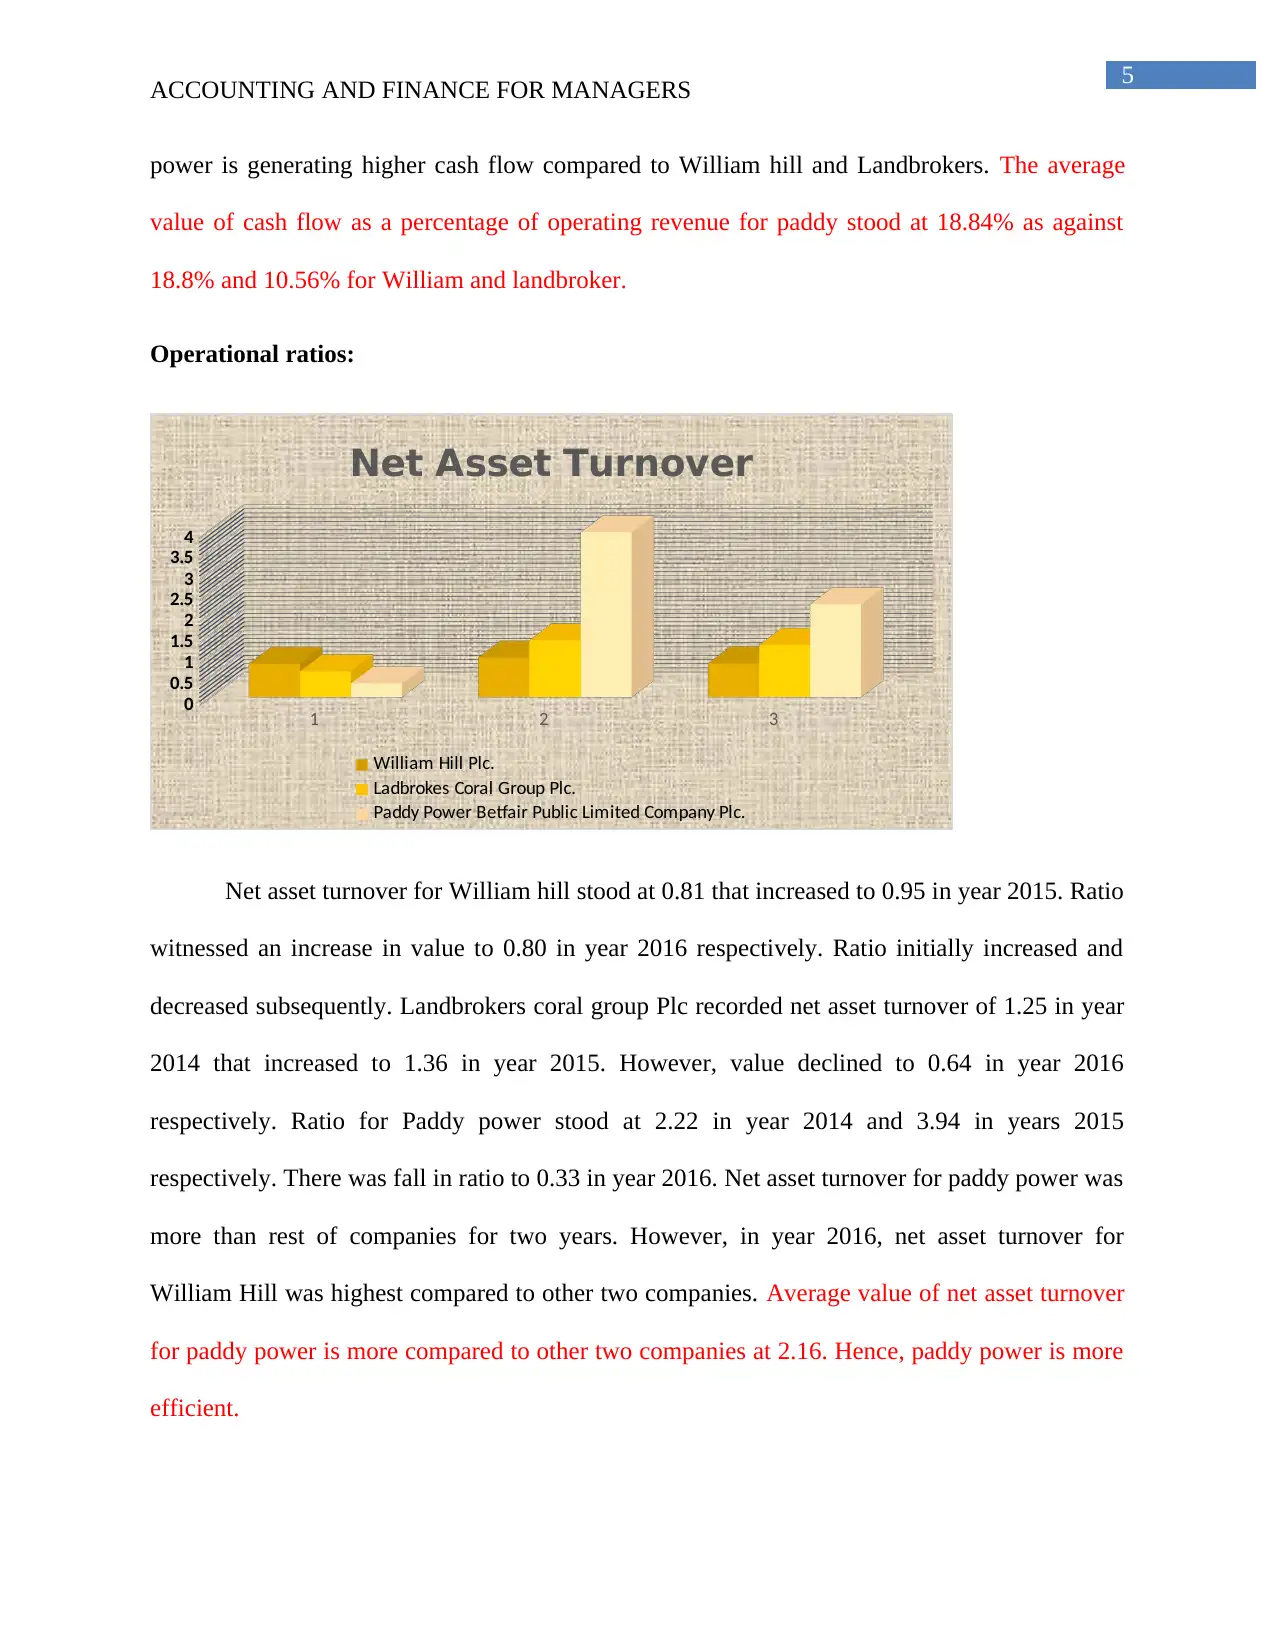
Net asset turnover for William hill stood at 0.81 that increased to 0.95 in year 2015. Ratio
witnessed an increase in value to 0.80 in year 2016 respectively. Ratio initially increased and
decreased subsequently. Landbrokers coral group Plc recorded net asset turnover of 1.25 in year
2014 that increased to 1.36 in year 2015. However, value declined to 0.64 in year 2016
respectively. Ratio for Paddy power stood at 2.22 in year 2014 and 3.94 in years 2015
respectively. There was fall in ratio to 0.33 in year 2016. Net asset turnover for paddy power was
more than rest of companies for two years. However, in year 2016, net asset turnover for
William Hill was highest compared to other two companies. Average value of net asset turnover
for paddy power is more compared to other two companies at 2.16. Hence, paddy power is more
efficient.
ACCOUNTING AND FINANCE FOR MANAGERS
power is generating higher cash flow compared to William hill and Landbrokers. The average
value of cash flow as a percentage of operating revenue for paddy stood at 18.84% as against
18.8% and 10.56% for William and landbroker.
Operational ratios:
1 2 3
0
0.5
1
1.5
2
2.5
3
3.5
4
Net Asset Turnover
William Hill Plc.
Ladbrokes Coral Group Plc.
Paddy Power Betfair Public Limited Company Plc.
Net asset turnover for William hill stood at 0.81 that increased to 0.95 in year 2015. Ratio
witnessed an increase in value to 0.80 in year 2016 respectively. Ratio initially increased and
decreased subsequently. Landbrokers coral group Plc recorded net asset turnover of 1.25 in year
2014 that increased to 1.36 in year 2015. However, value declined to 0.64 in year 2016
respectively. Ratio for Paddy power stood at 2.22 in year 2014 and 3.94 in years 2015
respectively. There was fall in ratio to 0.33 in year 2016. Net asset turnover for paddy power was
more than rest of companies for two years. However, in year 2016, net asset turnover for
William Hill was highest compared to other two companies. Average value of net asset turnover
for paddy power is more compared to other two companies at 2.16. Hence, paddy power is more
efficient.
⊘ This is a preview!⊘
Do you want full access?
Subscribe today to unlock all pages.
Trusted by 1+ million students worldwide
6
ACCOUNTING AND FINANCE FOR MANAGERS
2016 2015 2014
-200
0
200
400
600
800
1000
Interest Coverage Ratio
William Hill Plc. Ladbrokes Coral Group Plc.
Paddy Power Betfair Public Limited Company Plc.
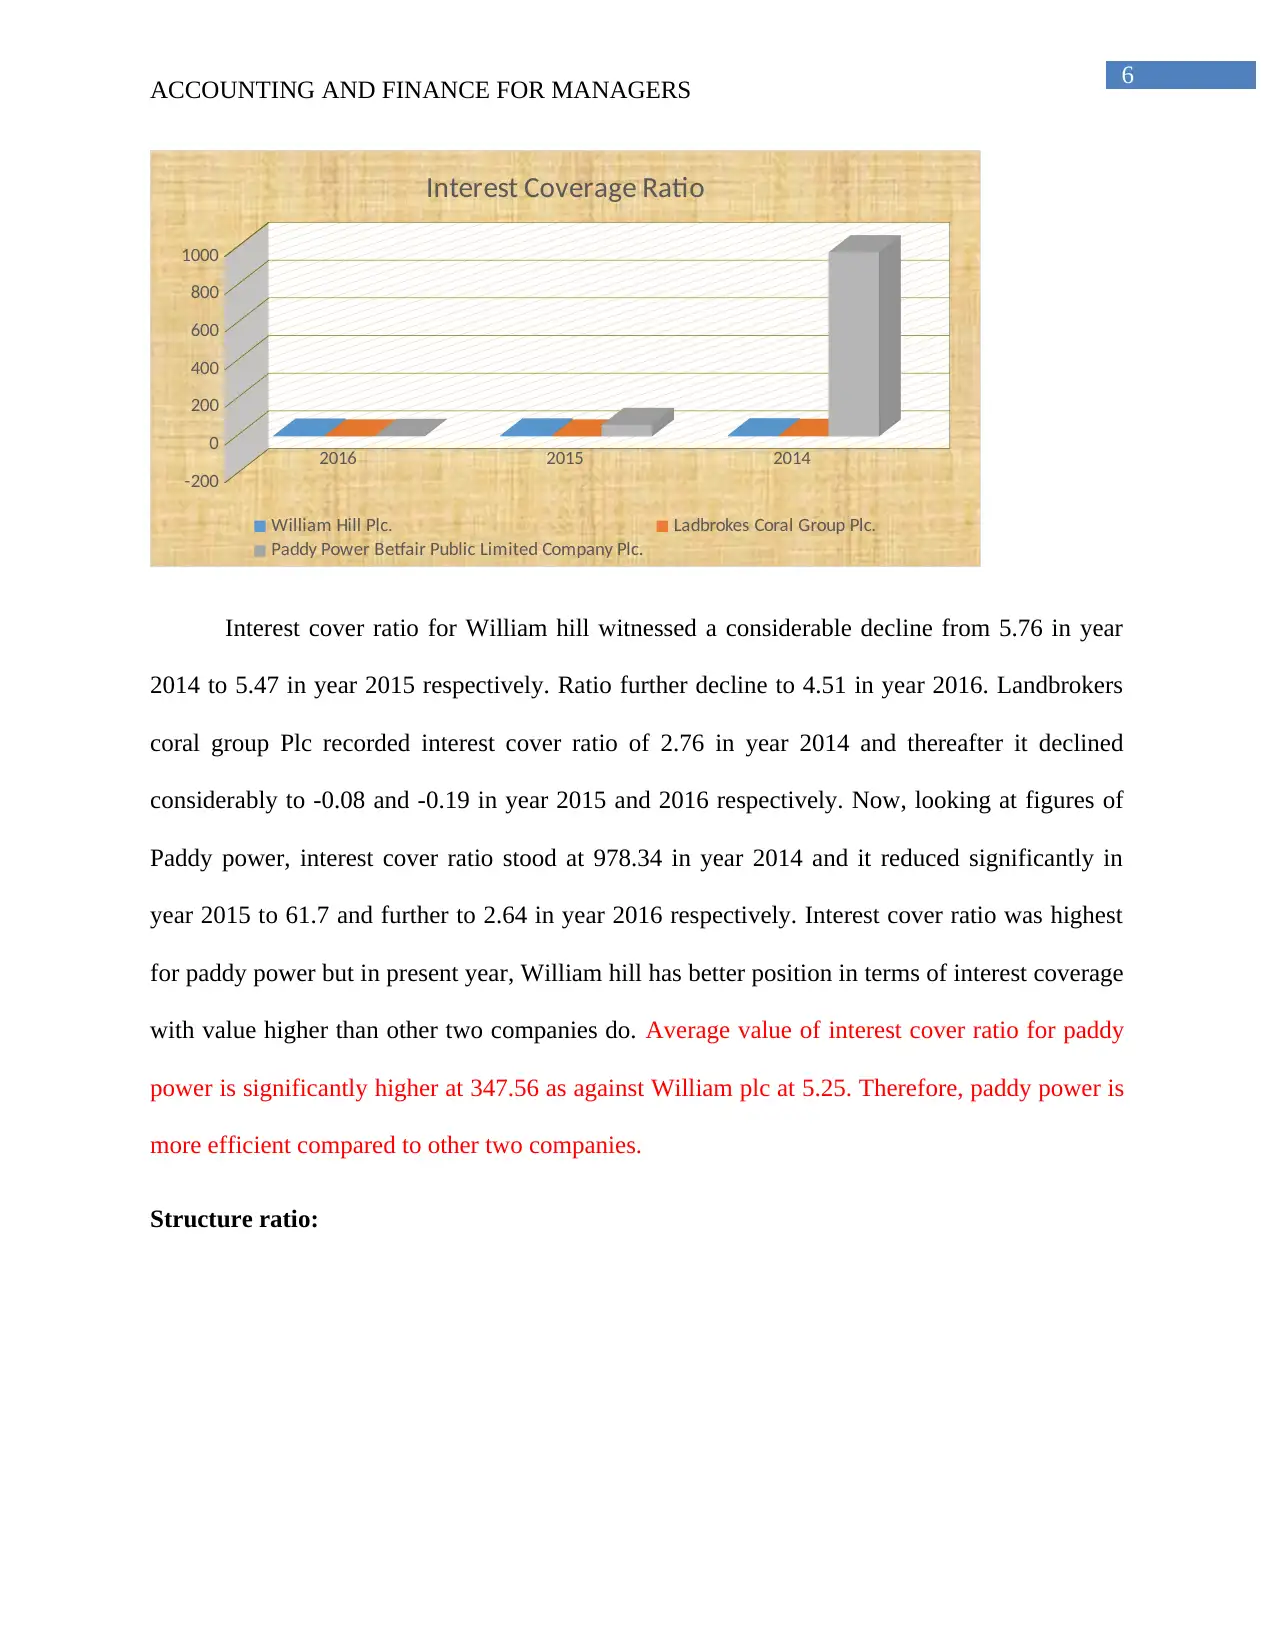
Interest cover ratio for William hill witnessed a considerable decline from 5.76 in year
2014 to 5.47 in year 2015 respectively. Ratio further decline to 4.51 in year 2016. Landbrokers
coral group Plc recorded interest cover ratio of 2.76 in year 2014 and thereafter it declined
considerably to -0.08 and -0.19 in year 2015 and 2016 respectively. Now, looking at figures of
Paddy power, interest cover ratio stood at 978.34 in year 2014 and it reduced significantly in
year 2015 to 61.7 and further to 2.64 in year 2016 respectively. Interest cover ratio was highest
for paddy power but in present year, William hill has better position in terms of interest coverage
with value higher than other two companies do. Average value of interest cover ratio for paddy
power is significantly higher at 347.56 as against William plc at 5.25. Therefore, paddy power is
more efficient compared to other two companies.
Structure ratio:
ACCOUNTING AND FINANCE FOR MANAGERS
2016 2015 2014
-200
0
200
400
600
800
1000
Interest Coverage Ratio
William Hill Plc. Ladbrokes Coral Group Plc.
Paddy Power Betfair Public Limited Company Plc.
Interest cover ratio for William hill witnessed a considerable decline from 5.76 in year
2014 to 5.47 in year 2015 respectively. Ratio further decline to 4.51 in year 2016. Landbrokers
coral group Plc recorded interest cover ratio of 2.76 in year 2014 and thereafter it declined
considerably to -0.08 and -0.19 in year 2015 and 2016 respectively. Now, looking at figures of
Paddy power, interest cover ratio stood at 978.34 in year 2014 and it reduced significantly in
year 2015 to 61.7 and further to 2.64 in year 2016 respectively. Interest cover ratio was highest
for paddy power but in present year, William hill has better position in terms of interest coverage
with value higher than other two companies do. Average value of interest cover ratio for paddy
power is significantly higher at 347.56 as against William plc at 5.25. Therefore, paddy power is
more efficient compared to other two companies.
Structure ratio:
Paraphrase This Document
Need a fresh take? Get an instant paraphrase of this document with our AI Paraphraser
7
ACCOUNTING AND FINANCE FOR MANAGERS
2016 2015 2014
0
0.2
0.4
0.6
0.8
1
1.2
1.4
Current Ratio
William Hill Plc.
Ladbrokes Coral Group Plc.
Paddy Power Betfair Public Limited Company Plc.
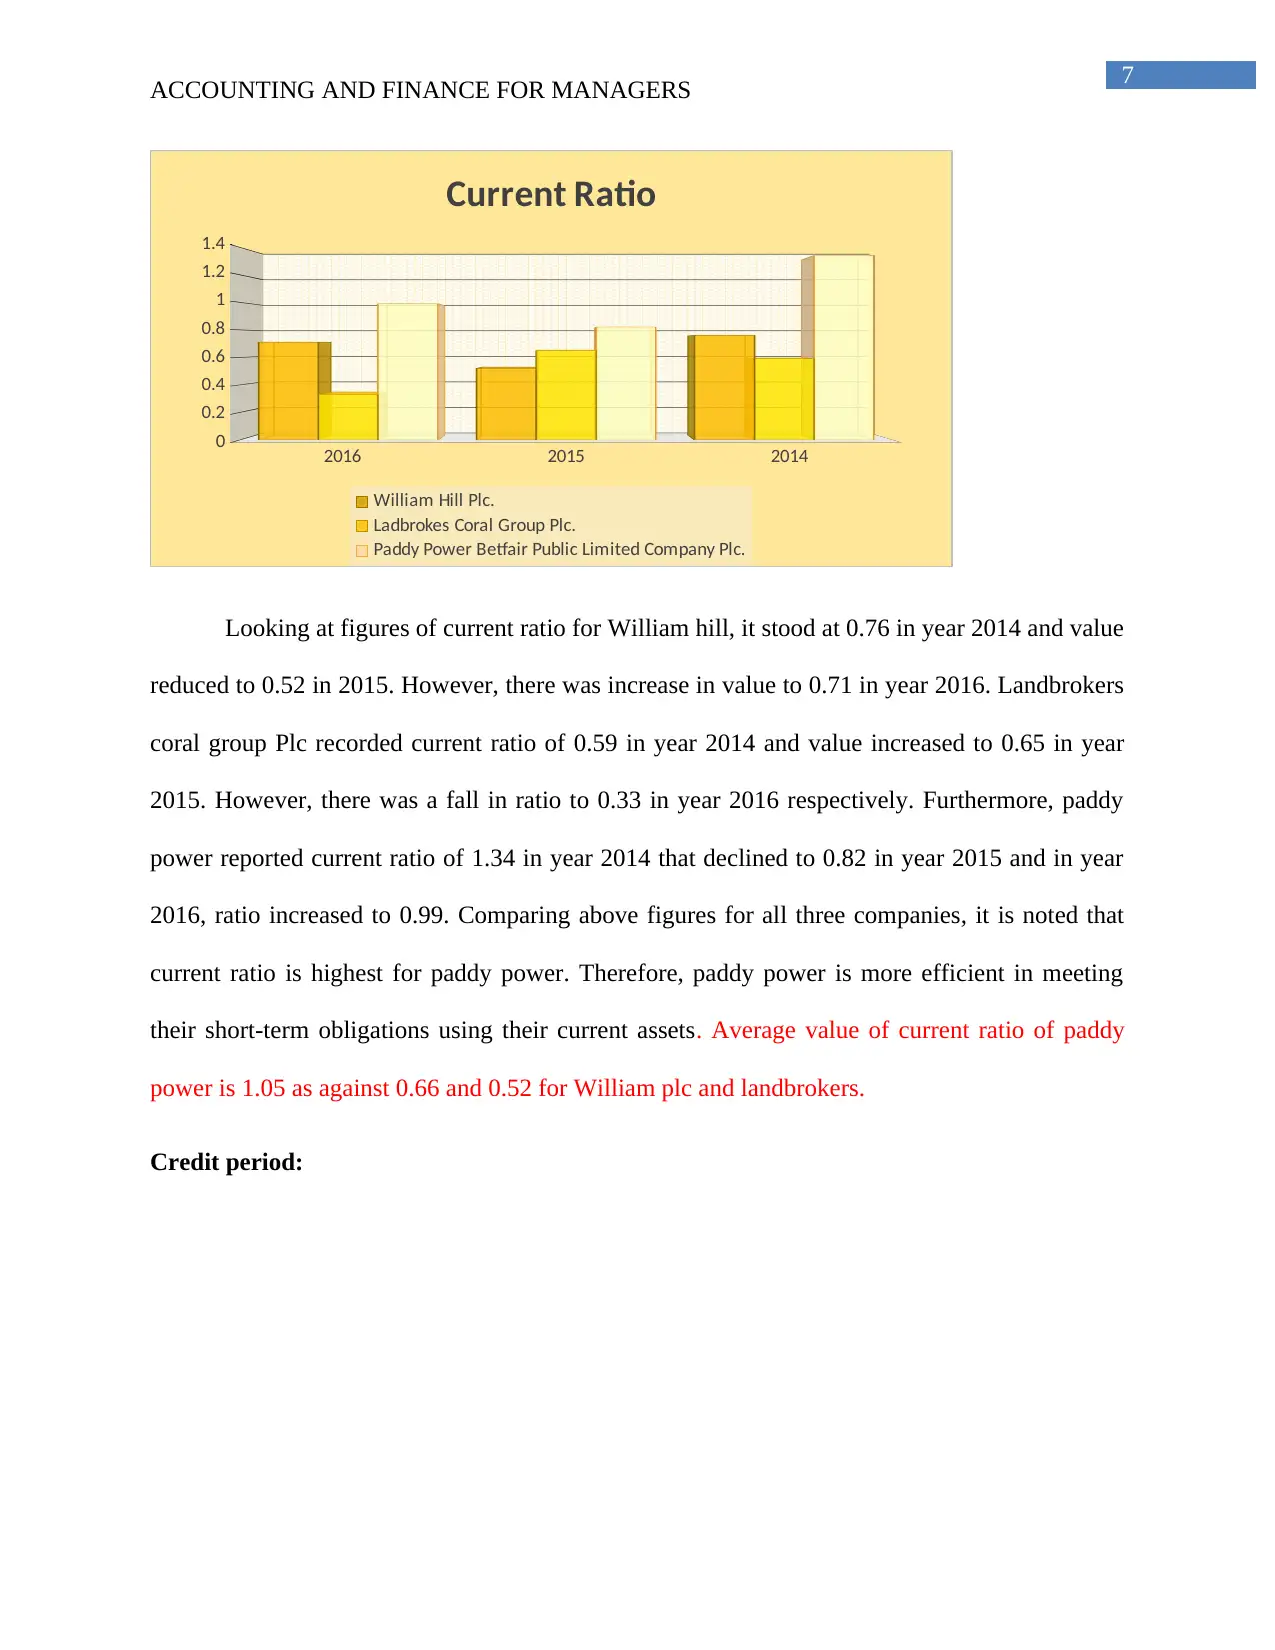
Looking at figures of current ratio for William hill, it stood at 0.76 in year 2014 and value
reduced to 0.52 in 2015. However, there was increase in value to 0.71 in year 2016. Landbrokers
coral group Plc recorded current ratio of 0.59 in year 2014 and value increased to 0.65 in year
2015. However, there was a fall in ratio to 0.33 in year 2016 respectively. Furthermore, paddy
power reported current ratio of 1.34 in year 2014 that declined to 0.82 in year 2015 and in year
2016, ratio increased to 0.99. Comparing above figures for all three companies, it is noted that
current ratio is highest for paddy power. Therefore, paddy power is more efficient in meeting
their short-term obligations using their current assets. Average value of current ratio of paddy
power is 1.05 as against 0.66 and 0.52 for William plc and landbrokers.
Credit period:
ACCOUNTING AND FINANCE FOR MANAGERS
2016 2015 2014
0
0.2
0.4
0.6
0.8
1
1.2
1.4
Current Ratio
William Hill Plc.
Ladbrokes Coral Group Plc.
Paddy Power Betfair Public Limited Company Plc.
Looking at figures of current ratio for William hill, it stood at 0.76 in year 2014 and value
reduced to 0.52 in 2015. However, there was increase in value to 0.71 in year 2016. Landbrokers
coral group Plc recorded current ratio of 0.59 in year 2014 and value increased to 0.65 in year
2015. However, there was a fall in ratio to 0.33 in year 2016 respectively. Furthermore, paddy
power reported current ratio of 1.34 in year 2014 that declined to 0.82 in year 2015 and in year
2016, ratio increased to 0.99. Comparing above figures for all three companies, it is noted that
current ratio is highest for paddy power. Therefore, paddy power is more efficient in meeting
their short-term obligations using their current assets. Average value of current ratio of paddy
power is 1.05 as against 0.66 and 0.52 for William plc and landbrokers.
Credit period:
8
ACCOUNTING AND FINANCE FOR MANAGERS
2016 2015 2014
0
5
10
15
20
25
30
Credit Period
William Hill Plc.
Ladbrokes Coral Group Plc.
Paddy Power Betfair Public Limited Company Plc.
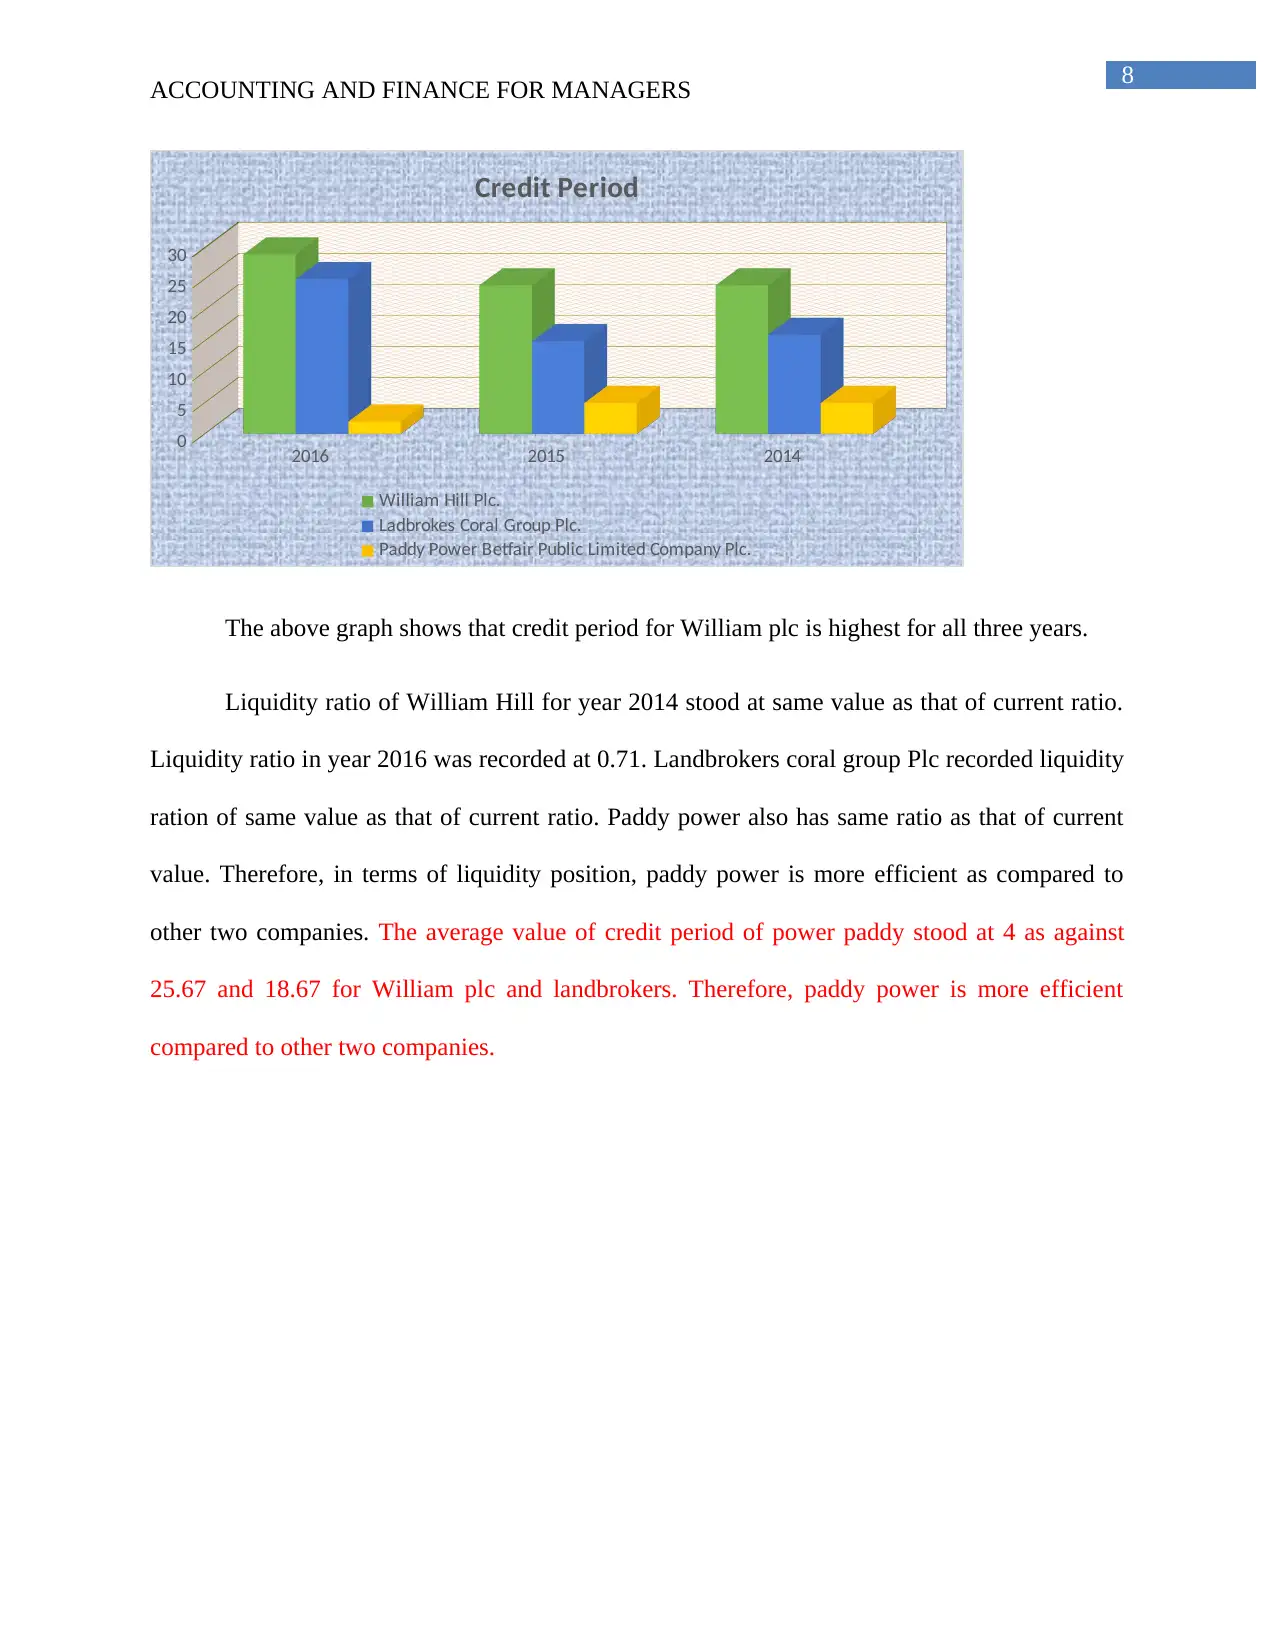
The above graph shows that credit period for William plc is highest for all three years.
Liquidity ratio of William Hill for year 2014 stood at same value as that of current ratio.
Liquidity ratio in year 2016 was recorded at 0.71. Landbrokers coral group Plc recorded liquidity
ration of same value as that of current ratio. Paddy power also has same ratio as that of current
value. Therefore, in terms of liquidity position, paddy power is more efficient as compared to
other two companies. The average value of credit period of power paddy stood at 4 as against
25.67 and 18.67 for William plc and landbrokers. Therefore, paddy power is more efficient
compared to other two companies.
ACCOUNTING AND FINANCE FOR MANAGERS
2016 2015 2014
0
5
10
15
20
25
30
Credit Period
William Hill Plc.
Ladbrokes Coral Group Plc.
Paddy Power Betfair Public Limited Company Plc.
The above graph shows that credit period for William plc is highest for all three years.
Liquidity ratio of William Hill for year 2014 stood at same value as that of current ratio.
Liquidity ratio in year 2016 was recorded at 0.71. Landbrokers coral group Plc recorded liquidity
ration of same value as that of current ratio. Paddy power also has same ratio as that of current
value. Therefore, in terms of liquidity position, paddy power is more efficient as compared to
other two companies. The average value of credit period of power paddy stood at 4 as against
25.67 and 18.67 for William plc and landbrokers. Therefore, paddy power is more efficient
compared to other two companies.
⊘ This is a preview!⊘
Do you want full access?
Subscribe today to unlock all pages.
Trusted by 1+ million students worldwide
9
ACCOUNTING AND FINANCE FOR MANAGERS
2016 2015 2014
0
50
100
150
200
250
300
Gearing Ratio
William Hill Plc.
Ladbrokes Coral Group Plc.
Paddy Power Betfair Public Limited Company Plc.
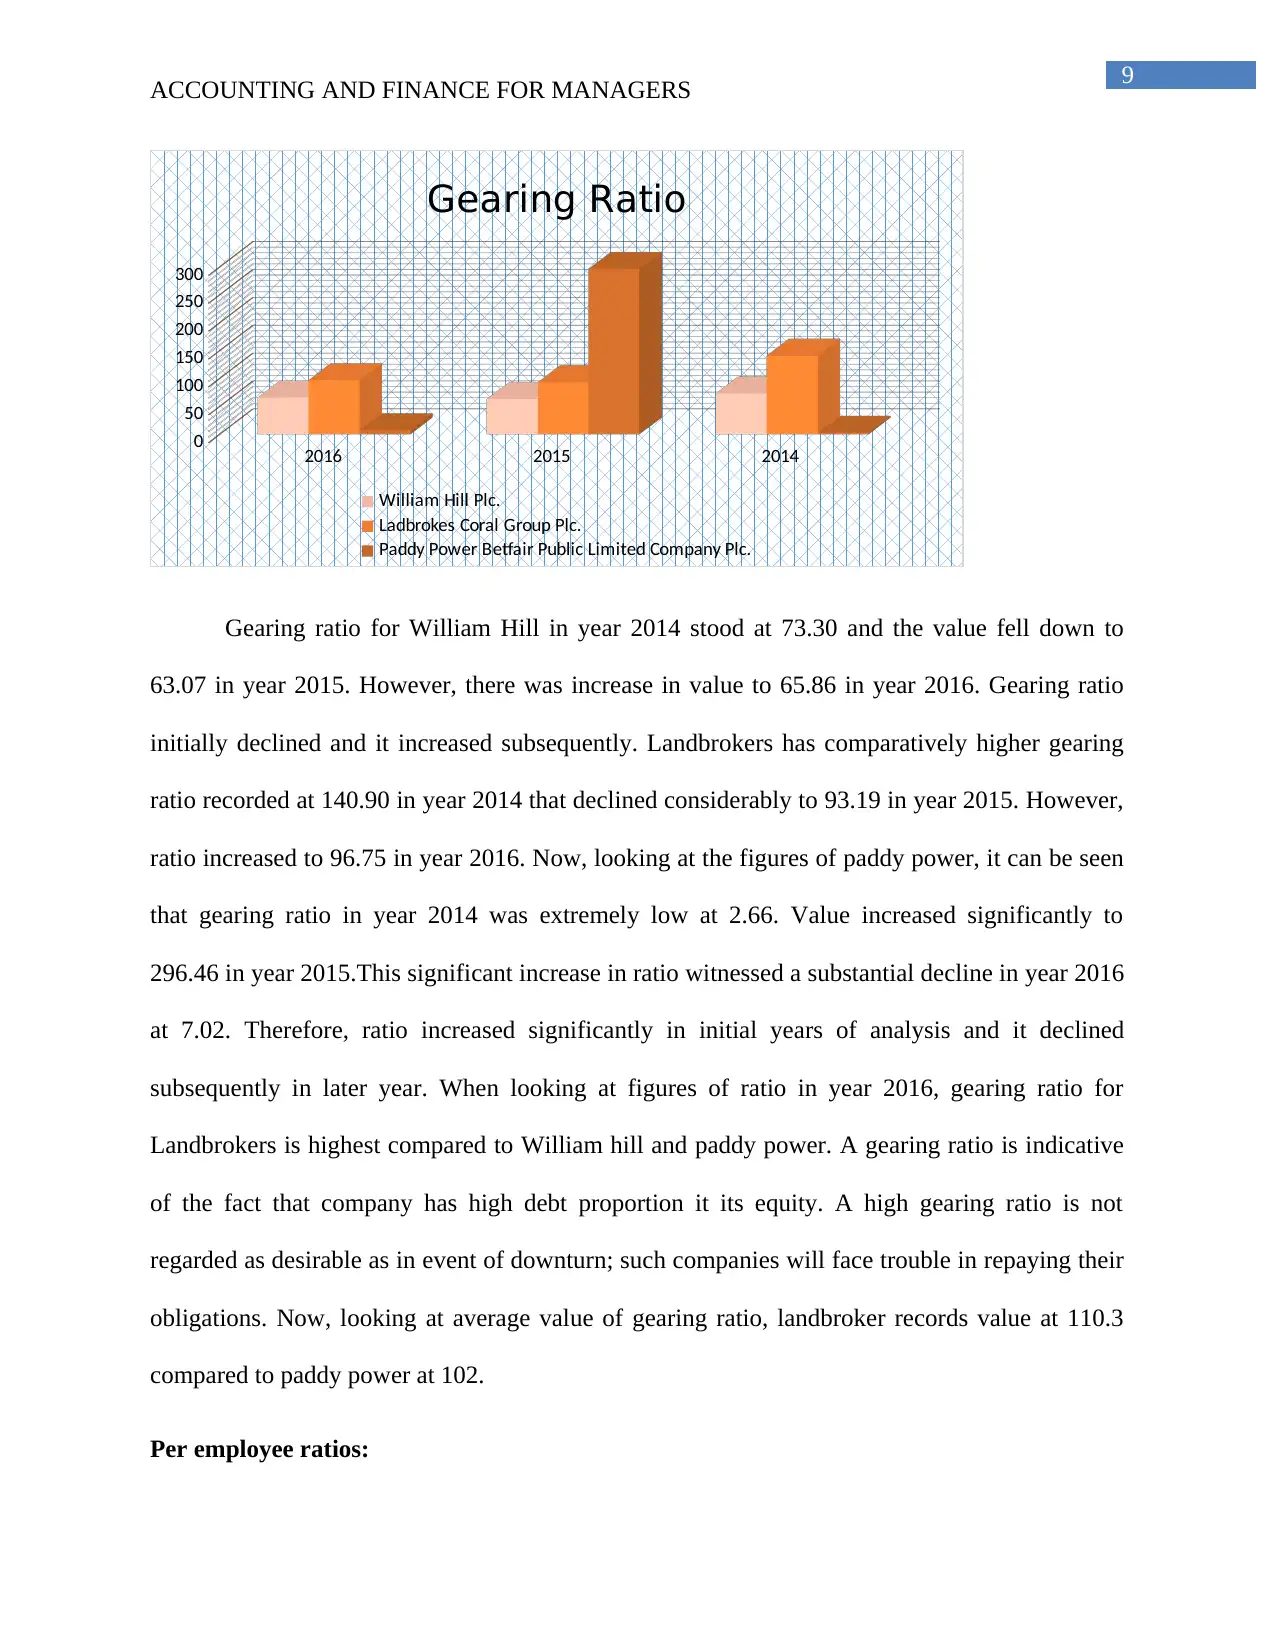
Gearing ratio for William Hill in year 2014 stood at 73.30 and the value fell down to
63.07 in year 2015. However, there was increase in value to 65.86 in year 2016. Gearing ratio
initially declined and it increased subsequently. Landbrokers has comparatively higher gearing
ratio recorded at 140.90 in year 2014 that declined considerably to 93.19 in year 2015. However,
ratio increased to 96.75 in year 2016. Now, looking at the figures of paddy power, it can be seen
that gearing ratio in year 2014 was extremely low at 2.66. Value increased significantly to
296.46 in year 2015.This significant increase in ratio witnessed a substantial decline in year 2016
at 7.02. Therefore, ratio increased significantly in initial years of analysis and it declined
subsequently in later year. When looking at figures of ratio in year 2016, gearing ratio for
Landbrokers is highest compared to William hill and paddy power. A gearing ratio is indicative
of the fact that company has high debt proportion it its equity. A high gearing ratio is not
regarded as desirable as in event of downturn; such companies will face trouble in repaying their
obligations. Now, looking at average value of gearing ratio, landbroker records value at 110.3
compared to paddy power at 102.
Per employee ratios:
ACCOUNTING AND FINANCE FOR MANAGERS
2016 2015 2014
0
50
100
150
200
250
300
Gearing Ratio
William Hill Plc.
Ladbrokes Coral Group Plc.
Paddy Power Betfair Public Limited Company Plc.
Gearing ratio for William Hill in year 2014 stood at 73.30 and the value fell down to
63.07 in year 2015. However, there was increase in value to 65.86 in year 2016. Gearing ratio
initially declined and it increased subsequently. Landbrokers has comparatively higher gearing
ratio recorded at 140.90 in year 2014 that declined considerably to 93.19 in year 2015. However,
ratio increased to 96.75 in year 2016. Now, looking at the figures of paddy power, it can be seen
that gearing ratio in year 2014 was extremely low at 2.66. Value increased significantly to
296.46 in year 2015.This significant increase in ratio witnessed a substantial decline in year 2016
at 7.02. Therefore, ratio increased significantly in initial years of analysis and it declined
subsequently in later year. When looking at figures of ratio in year 2016, gearing ratio for
Landbrokers is highest compared to William hill and paddy power. A gearing ratio is indicative
of the fact that company has high debt proportion it its equity. A high gearing ratio is not
regarded as desirable as in event of downturn; such companies will face trouble in repaying their
obligations. Now, looking at average value of gearing ratio, landbroker records value at 110.3
compared to paddy power at 102.
Per employee ratios:
Paraphrase This Document
Need a fresh take? Get an instant paraphrase of this document with our AI Paraphraser
10
ACCOUNTING AND FINANCE FOR MANAGERS
2016 2015 2014
0
0.2
0.4
0.6
0.8
1
1.2
1.4
Operating Revenue per Employee
William Hill Plc. Ladbrokes Coral Group Plc.
Paddy Power Betfair Public Limited Company Plc.
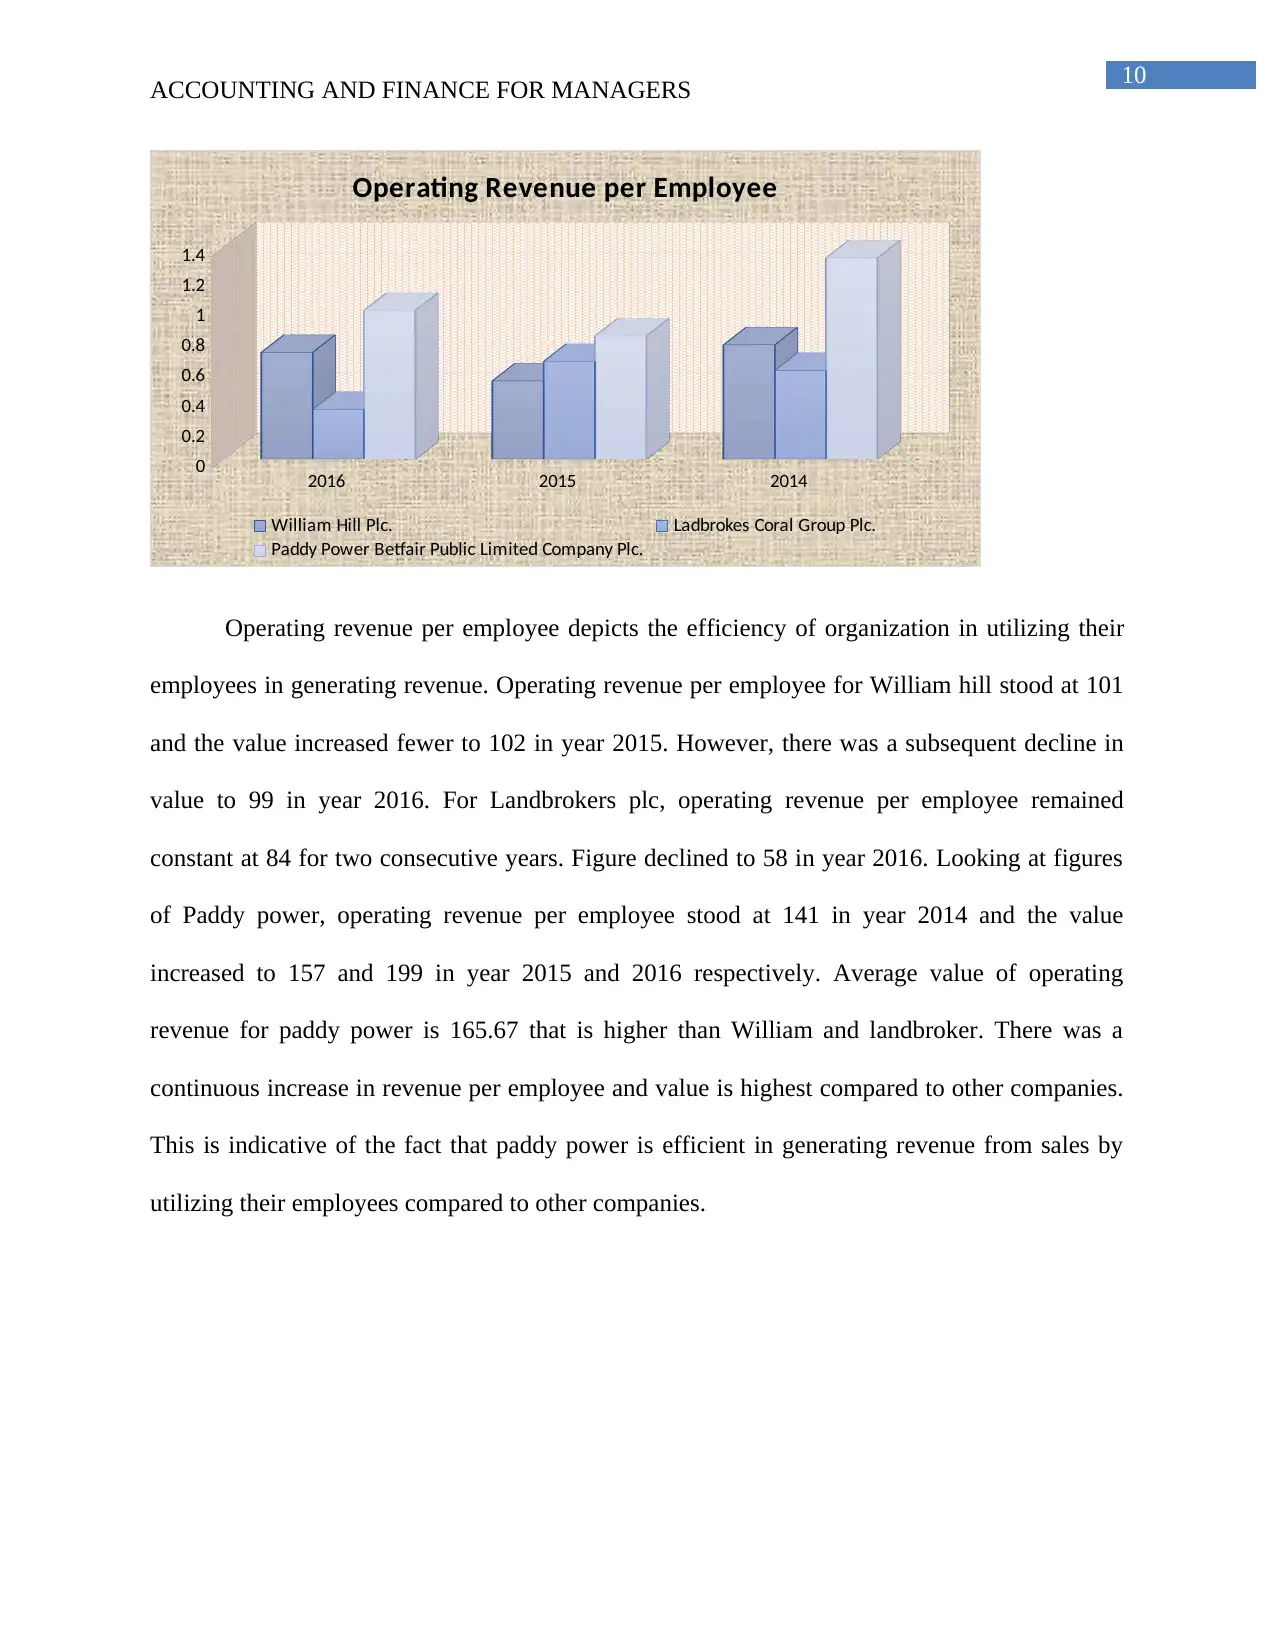
Operating revenue per employee depicts the efficiency of organization in utilizing their
employees in generating revenue. Operating revenue per employee for William hill stood at 101
and the value increased fewer to 102 in year 2015. However, there was a subsequent decline in
value to 99 in year 2016. For Landbrokers plc, operating revenue per employee remained
constant at 84 for two consecutive years. Figure declined to 58 in year 2016. Looking at figures
of Paddy power, operating revenue per employee stood at 141 in year 2014 and the value
increased to 157 and 199 in year 2015 and 2016 respectively. Average value of operating
revenue for paddy power is 165.67 that is higher than William and landbroker. There was a
continuous increase in revenue per employee and value is highest compared to other companies.
This is indicative of the fact that paddy power is efficient in generating revenue from sales by
utilizing their employees compared to other companies.
ACCOUNTING AND FINANCE FOR MANAGERS
2016 2015 2014
0
0.2
0.4
0.6
0.8
1
1.2
1.4
Operating Revenue per Employee
William Hill Plc. Ladbrokes Coral Group Plc.
Paddy Power Betfair Public Limited Company Plc.
Operating revenue per employee depicts the efficiency of organization in utilizing their
employees in generating revenue. Operating revenue per employee for William hill stood at 101
and the value increased fewer to 102 in year 2015. However, there was a subsequent decline in
value to 99 in year 2016. For Landbrokers plc, operating revenue per employee remained
constant at 84 for two consecutive years. Figure declined to 58 in year 2016. Looking at figures
of Paddy power, operating revenue per employee stood at 141 in year 2014 and the value
increased to 157 and 199 in year 2015 and 2016 respectively. Average value of operating
revenue for paddy power is 165.67 that is higher than William and landbroker. There was a
continuous increase in revenue per employee and value is highest compared to other companies.
This is indicative of the fact that paddy power is efficient in generating revenue from sales by
utilizing their employees compared to other companies.
11
ACCOUNTING AND FINANCE FOR MANAGERS
2016 2015 2014
0
50
100
150
200
250
300
Cost of employee/OR
William Hill Plc.
Ladbrokes Coral Group Plc.
Paddy Power Betfair Public Limited Company Plc.
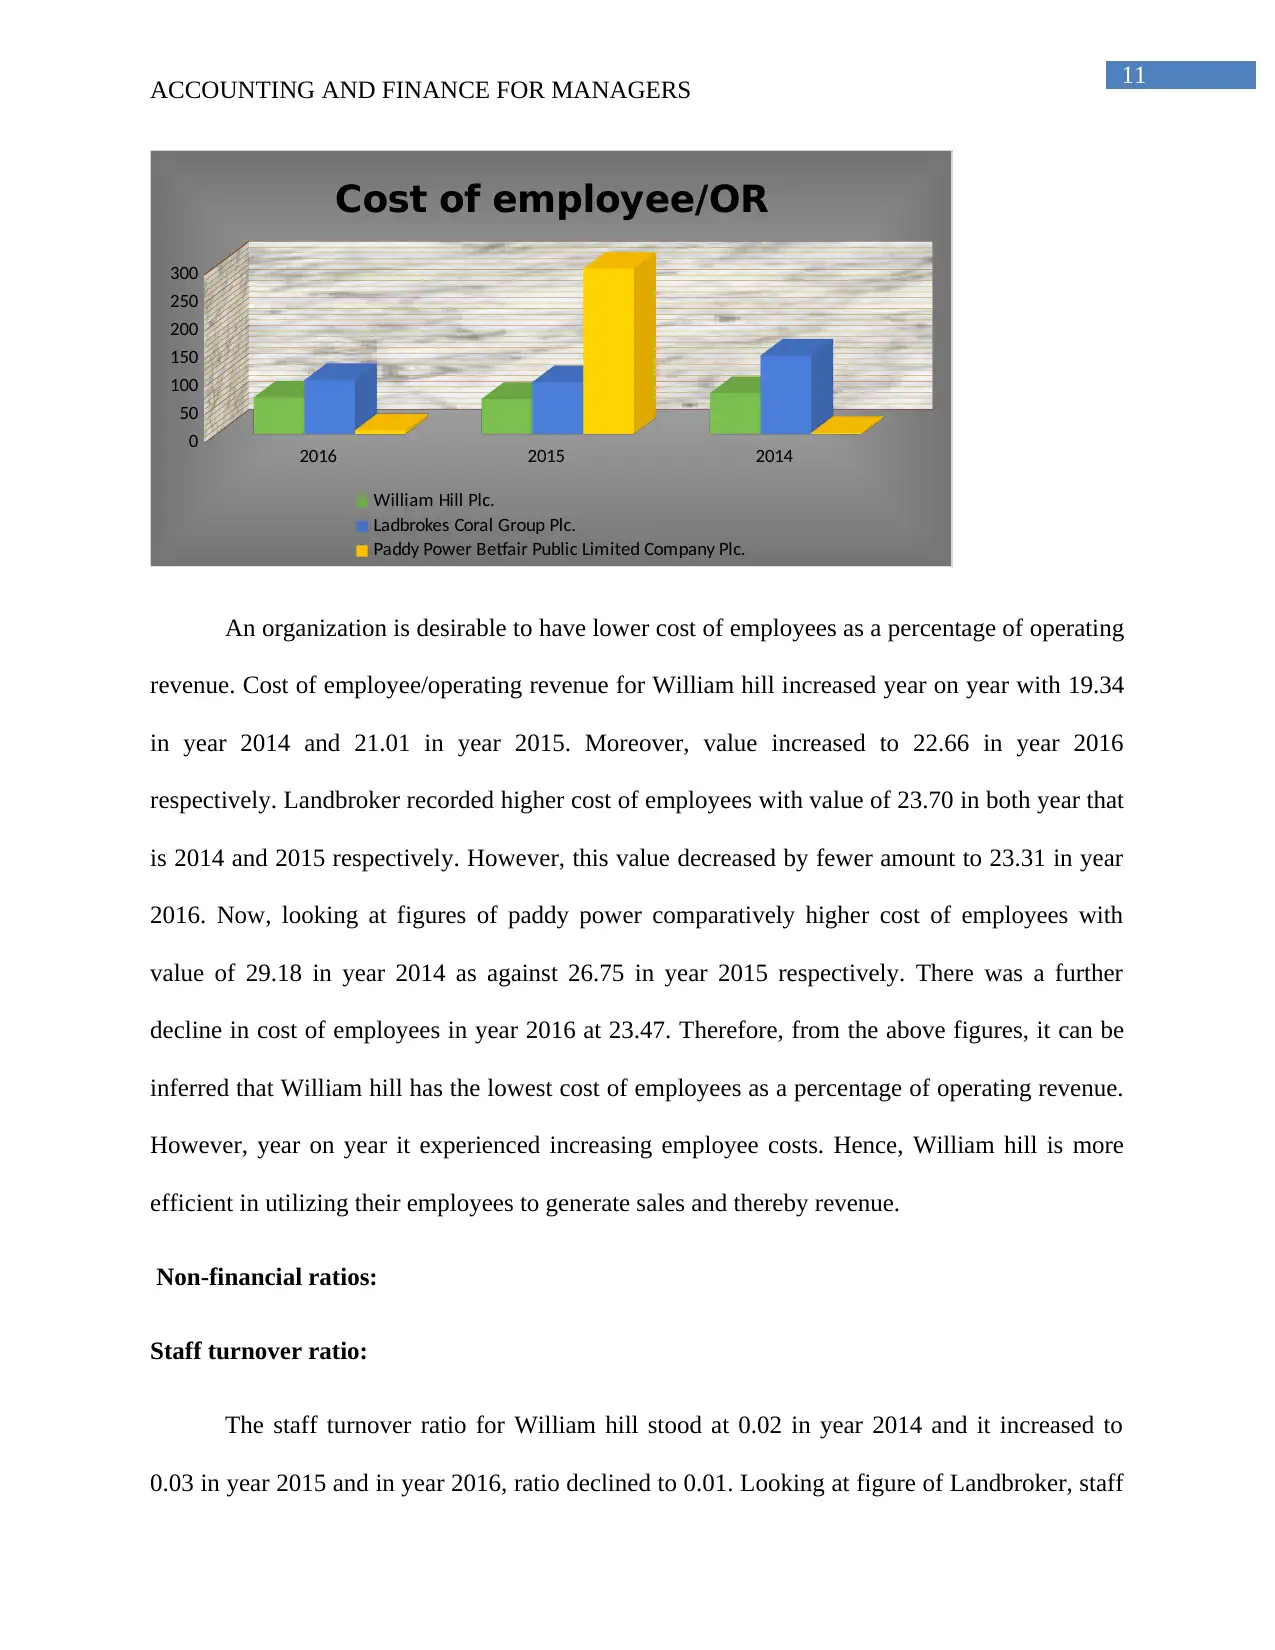
An organization is desirable to have lower cost of employees as a percentage of operating
revenue. Cost of employee/operating revenue for William hill increased year on year with 19.34
in year 2014 and 21.01 in year 2015. Moreover, value increased to 22.66 in year 2016
respectively. Landbroker recorded higher cost of employees with value of 23.70 in both year that
is 2014 and 2015 respectively. However, this value decreased by fewer amount to 23.31 in year
2016. Now, looking at figures of paddy power comparatively higher cost of employees with
value of 29.18 in year 2014 as against 26.75 in year 2015 respectively. There was a further
decline in cost of employees in year 2016 at 23.47. Therefore, from the above figures, it can be
inferred that William hill has the lowest cost of employees as a percentage of operating revenue.
However, year on year it experienced increasing employee costs. Hence, William hill is more
efficient in utilizing their employees to generate sales and thereby revenue.
Non-financial ratios:
Staff turnover ratio:
The staff turnover ratio for William hill stood at 0.02 in year 2014 and it increased to
0.03 in year 2015 and in year 2016, ratio declined to 0.01. Looking at figure of Landbroker, staff
ACCOUNTING AND FINANCE FOR MANAGERS
2016 2015 2014
0
50
100
150
200
250
300
Cost of employee/OR
William Hill Plc.
Ladbrokes Coral Group Plc.
Paddy Power Betfair Public Limited Company Plc.
An organization is desirable to have lower cost of employees as a percentage of operating
revenue. Cost of employee/operating revenue for William hill increased year on year with 19.34
in year 2014 and 21.01 in year 2015. Moreover, value increased to 22.66 in year 2016
respectively. Landbroker recorded higher cost of employees with value of 23.70 in both year that
is 2014 and 2015 respectively. However, this value decreased by fewer amount to 23.31 in year
2016. Now, looking at figures of paddy power comparatively higher cost of employees with
value of 29.18 in year 2014 as against 26.75 in year 2015 respectively. There was a further
decline in cost of employees in year 2016 at 23.47. Therefore, from the above figures, it can be
inferred that William hill has the lowest cost of employees as a percentage of operating revenue.
However, year on year it experienced increasing employee costs. Hence, William hill is more
efficient in utilizing their employees to generate sales and thereby revenue.
Non-financial ratios:
Staff turnover ratio:
The staff turnover ratio for William hill stood at 0.02 in year 2014 and it increased to
0.03 in year 2015 and in year 2016, ratio declined to 0.01. Looking at figure of Landbroker, staff
⊘ This is a preview!⊘
Do you want full access?
Subscribe today to unlock all pages.
Trusted by 1+ million students worldwide
1 out of 22
Related Documents


Your All-in-One AI-Powered Toolkit for Academic Success.
+13062052269
info@desklib.com
Available 24*7 on WhatsApp / Email
![[object Object]](/_next/static/media/star-bottom.7253800d.svg)
Unlock your academic potential
Copyright © 2020–2026 A2Z Services. All Rights Reserved. Developed and managed by ZUCOL.