Comparative Financial Performance Analysis of Gambling Firms
VerifiedAdded on 2020/06/03
|17
|3300
|106
AI Summary
The report evaluates the financial performance of major UK gambling firms for FY 2016, highlighting William Hill's superior profitability, liquidity, and operational efficiency compared to its competitors, Ladbrokes and Paddy Power. Using investment appraisal tools like payback period and NPV calculations, the analysis reveals strategic insights into how these companies can enhance their market positions through effective financial management and investment strategies.

Accounting and Finance for Managers
1
1
Paraphrase This Document
Need a fresh take? Get an instant paraphrase of this document with our AI Paraphraser
TABLE OF CONTENTS
INTRODUCTION......................................................................................................................1
SECTION A...............................................................................................................................1
a. Analyzing financial position of the three companies undertaken......................................1
b. Identifying best performing company by giving ranks to all of them................................9
c. Recommending actions for making improvement in the business performance..............10
SECTION B.............................................................................................................................10
a. Explaining key stages in the context of capital budgeting tools along with its
significance..........................................................................................................................10
b. Explaining main methods of investment appraisal that can be used in practice..............11
CONCLUSION........................................................................................................................13
REFERENCES.........................................................................................................................14
2
INTRODUCTION
In the context of business organization, it is the accountability of manager to develop
strategies and policies in such a manner that makes contribution in the attainment of goals.
Under the competitive business arena, it becomes difficult for the managers to achieve both
financial and non-financial objectives. In this regard, ratio analysis is the most effectual
financial tool that helps in measuring business performance and undertaking suitable measure
for the improvement. The present report is based on William Hill, Ladbrokes and Paddy
Power which are operating and considered as the leading units under gambling sector. All
such business units are listed on the recognized stock exchange of London such FTSE 100
and recognized as a major contributor in the UK economy. In this, present report will shed
light on the extent to which financial position of one business unit is sound over others.
Besides this, report will also provide deeper insight about the process associated with
investment appraisal. It also entails the manner in which capital budgeting tools & techniques
facilitates profitable decision making.
SECTION A
a. Analyzing financial position of the three companies undertaken
Ratio analysis tool helps business units in summarizing financial performance and
enables them to compare the same over the years as well as in against to the rivals. Hence, to
assess the firm, in gambling sector, that is highly suitable for the investment purpose ratio
analysis has been done.
Ratio analysis of William Hill, Paddy Power and Ladbrokes from the period of 2014 to 2016
is enumerated below:
Financial ratios
Profitability ratios
Gross margin or profit ratio
1
⊘ This is a preview!⊘
Do you want full access?
Subscribe today to unlock all pages.
Trusted by 1+ million students worldwide
William Hilll Ladbrokes Paddy Power
0.00
10.00
20.00
30.00
40.00
50.00
60.00
70.00
80.00
90.00
Gross margin
in %
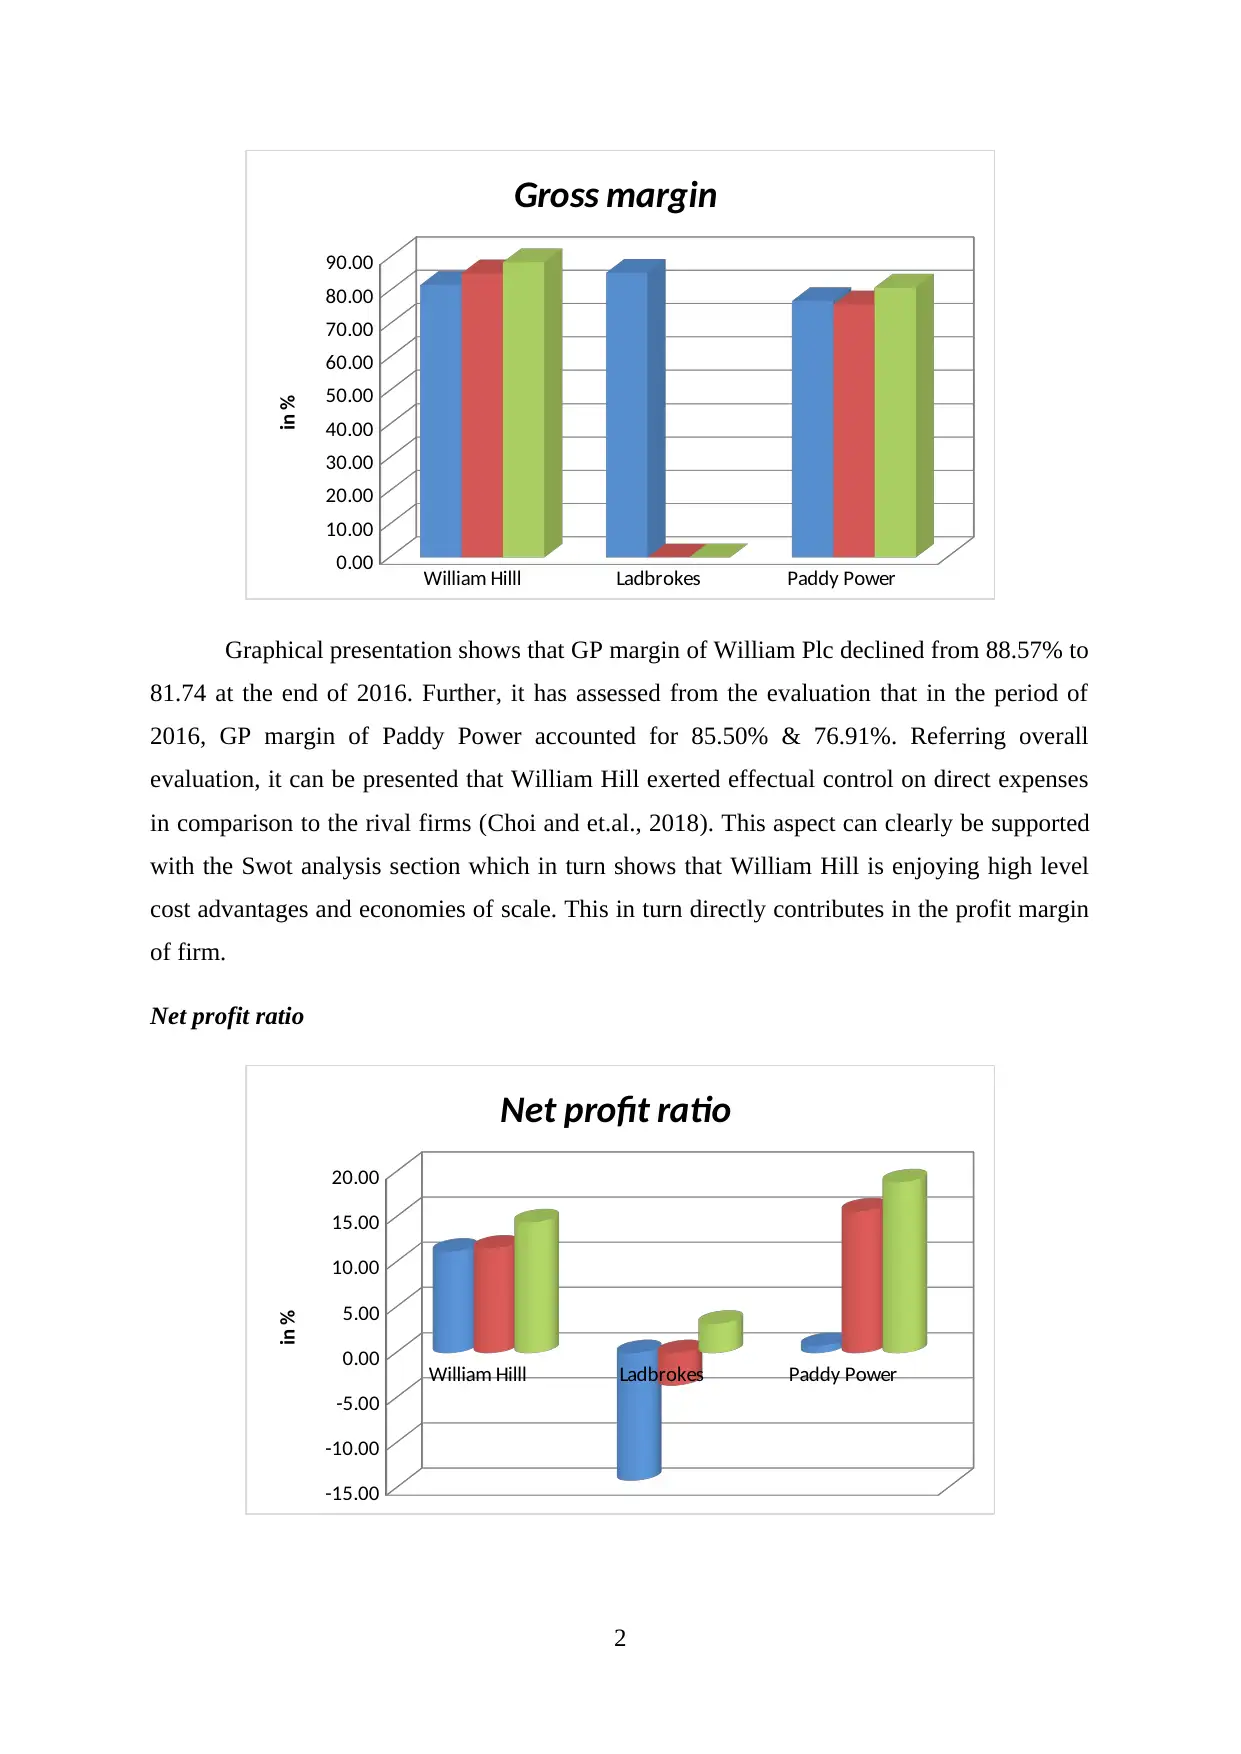
Graphical presentation shows that GP margin of William Plc declined from 88.57% to
81.74 at the end of 2016. Further, it has assessed from the evaluation that in the period of
2016, GP margin of Paddy Power accounted for 85.50% & 76.91%. Referring overall
evaluation, it can be presented that William Hill exerted effectual control on direct expenses
in comparison to the rival firms (Choi and et.al., 2018). This aspect can clearly be supported
with the Swot analysis section which in turn shows that William Hill is enjoying high level
cost advantages and economies of scale. This in turn directly contributes in the profit margin
of firm.
Net profit ratio
William Hilll Ladbrokes Paddy Power
-15.00
-10.00
-5.00
0.00
5.00
10.00
15.00
20.00
Net profit ratio
in %
2
0.00
10.00
20.00
30.00
40.00
50.00
60.00
70.00
80.00
90.00
Gross margin
in %
Graphical presentation shows that GP margin of William Plc declined from 88.57% to
81.74 at the end of 2016. Further, it has assessed from the evaluation that in the period of
2016, GP margin of Paddy Power accounted for 85.50% & 76.91%. Referring overall
evaluation, it can be presented that William Hill exerted effectual control on direct expenses
in comparison to the rival firms (Choi and et.al., 2018). This aspect can clearly be supported
with the Swot analysis section which in turn shows that William Hill is enjoying high level
cost advantages and economies of scale. This in turn directly contributes in the profit margin
of firm.
Net profit ratio
William Hilll Ladbrokes Paddy Power
-15.00
-10.00
-5.00
0.00
5.00
10.00
15.00
20.00
Net profit ratio
in %
2
Paraphrase This Document
Need a fresh take? Get an instant paraphrase of this document with our AI Paraphraser
Interpretation: Financial statement analysis shows decreasing trend in the net
profitability aspect of all such three business. However, NP margin of William Hill implied
for 11.20% in FY 2016 that was good and higher as compared to competitors. The rationale
behind the high margin of William Hill was sound customer loyalty and brand image (SWOT
analysis of William Hill, 2018). Further, indirect expenses are also recognized as a major
cause due to which other business units such as Paddy Power and Ladbrokes failed to make
effectual control on indirect expenses. By taking into account this aspect, profitability aspect
of William Hill deteriorated over the time frame but it’s good in against to the rival units.
Return on equity
William Hilll Ladbrokes Paddy Power
-50
0
50
100
150
200
250
Return on equity
in %
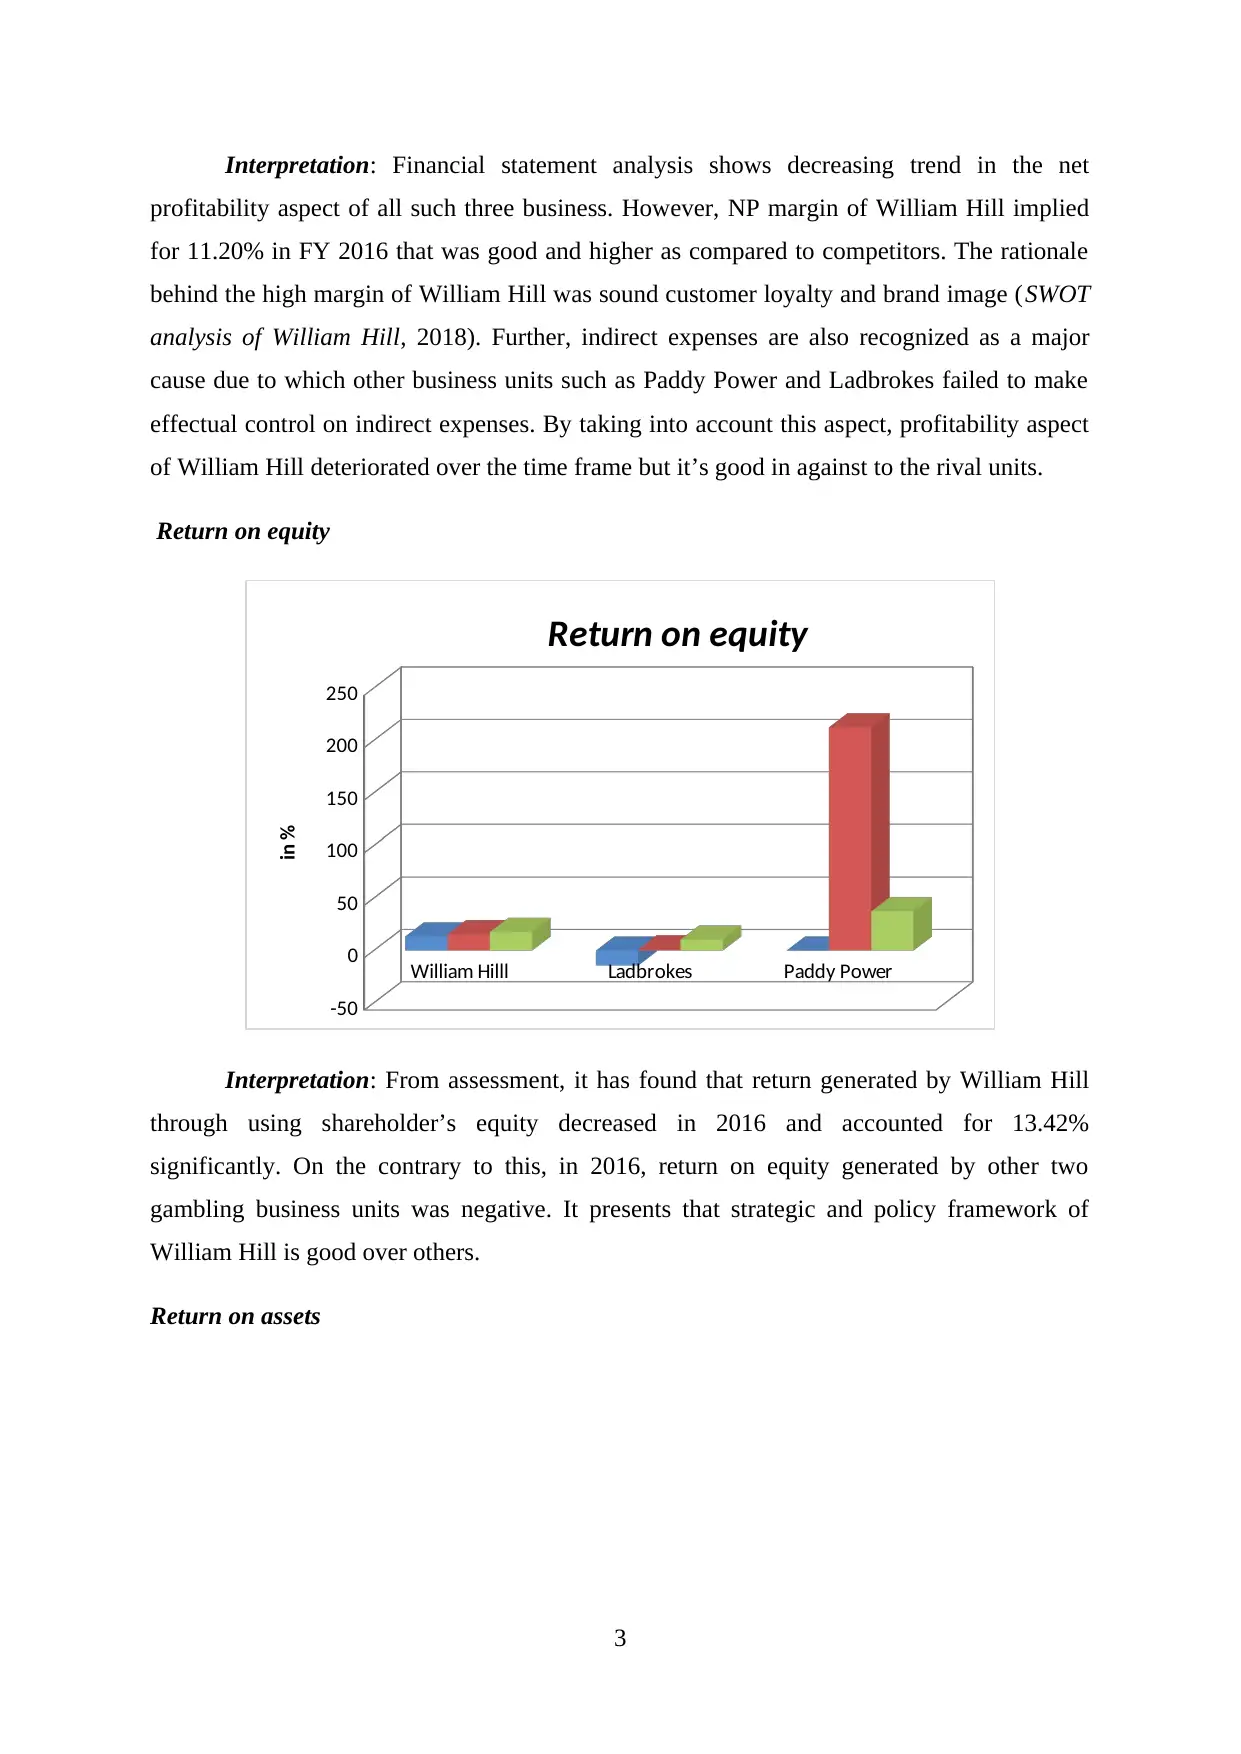
Interpretation: From assessment, it has found that return generated by William Hill
through using shareholder’s equity decreased in 2016 and accounted for 13.42%
significantly. On the contrary to this, in 2016, return on equity generated by other two
gambling business units was negative. It presents that strategic and policy framework of
William Hill is good over others.
Return on assets
3
profitability aspect of all such three business. However, NP margin of William Hill implied
for 11.20% in FY 2016 that was good and higher as compared to competitors. The rationale
behind the high margin of William Hill was sound customer loyalty and brand image (SWOT
analysis of William Hill, 2018). Further, indirect expenses are also recognized as a major
cause due to which other business units such as Paddy Power and Ladbrokes failed to make
effectual control on indirect expenses. By taking into account this aspect, profitability aspect
of William Hill deteriorated over the time frame but it’s good in against to the rival units.
Return on equity
William Hilll Ladbrokes Paddy Power
-50
0
50
100
150
200
250
Return on equity
in %
Interpretation: From assessment, it has found that return generated by William Hill
through using shareholder’s equity decreased in 2016 and accounted for 13.42%
significantly. On the contrary to this, in 2016, return on equity generated by other two
gambling business units was negative. It presents that strategic and policy framework of
William Hill is good over others.
Return on assets
3
William Hilll Ladbrokes Paddy Power
-10.00
-5.00
0.00
5.00
10.00
15.00
20.00
25.00
30.00
ROA
in %
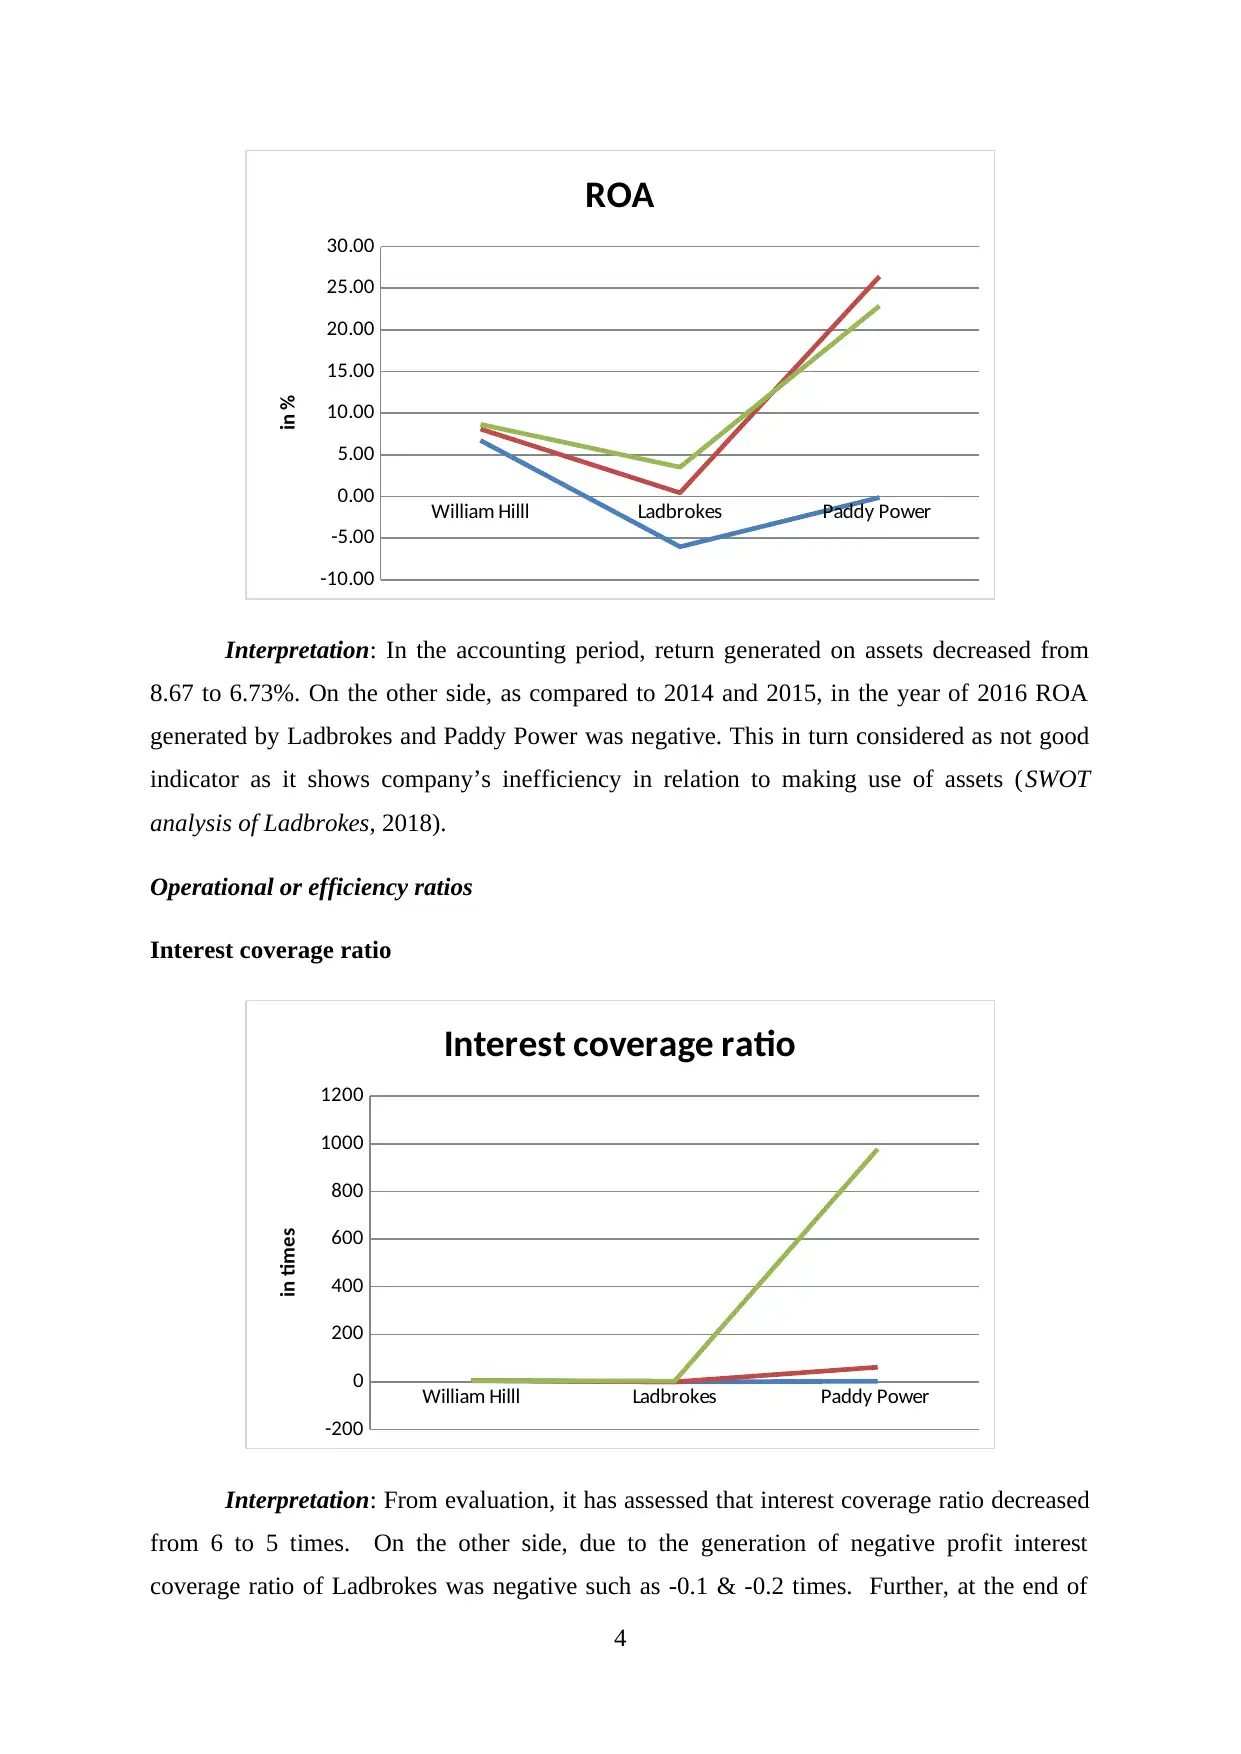
Interpretation: In the accounting period, return generated on assets decreased from
8.67 to 6.73%. On the other side, as compared to 2014 and 2015, in the year of 2016 ROA
generated by Ladbrokes and Paddy Power was negative. This in turn considered as not good
indicator as it shows company’s inefficiency in relation to making use of assets (SWOT
analysis of Ladbrokes, 2018).
Operational or efficiency ratios
Interest coverage ratio
William Hilll Ladbrokes Paddy Power
-200
0
200
400
600
800
1000
1200
Interest coverage ratio
in times
Interpretation: From evaluation, it has assessed that interest coverage ratio decreased
from 6 to 5 times. On the other side, due to the generation of negative profit interest
coverage ratio of Ladbrokes was negative such as -0.1 & -0.2 times. Further, at the end of
4
-10.00
-5.00
0.00
5.00
10.00
15.00
20.00
25.00
30.00
ROA
in %
Interpretation: In the accounting period, return generated on assets decreased from
8.67 to 6.73%. On the other side, as compared to 2014 and 2015, in the year of 2016 ROA
generated by Ladbrokes and Paddy Power was negative. This in turn considered as not good
indicator as it shows company’s inefficiency in relation to making use of assets (SWOT
analysis of Ladbrokes, 2018).
Operational or efficiency ratios
Interest coverage ratio
William Hilll Ladbrokes Paddy Power
-200
0
200
400
600
800
1000
1200
Interest coverage ratio
in times
Interpretation: From evaluation, it has assessed that interest coverage ratio decreased
from 6 to 5 times. On the other side, due to the generation of negative profit interest
coverage ratio of Ladbrokes was negative such as -0.1 & -0.2 times. Further, at the end of
4
⊘ This is a preview!⊘
Do you want full access?
Subscribe today to unlock all pages.
Trusted by 1+ million students worldwide
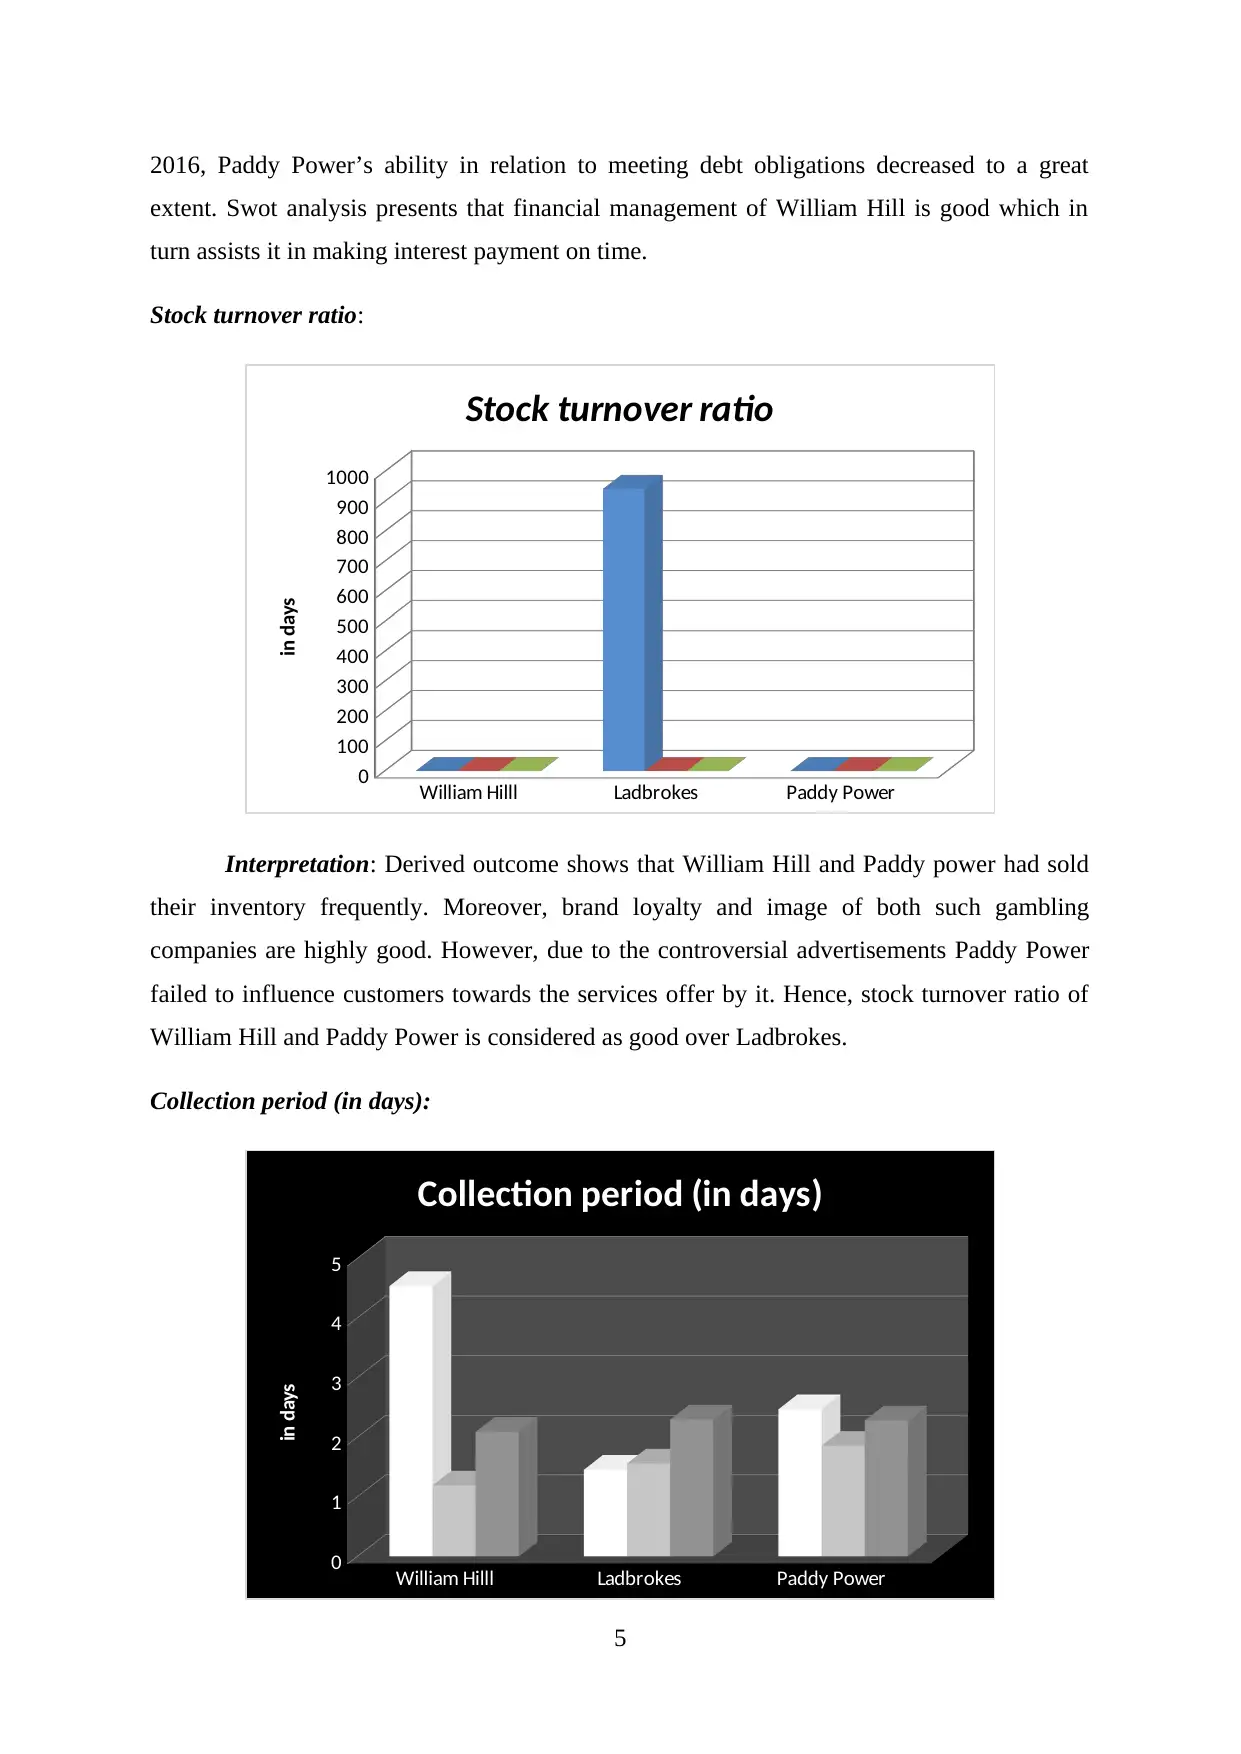
2016, Paddy Power’s ability in relation to meeting debt obligations decreased to a great
extent. Swot analysis presents that financial management of William Hill is good which in
turn assists it in making interest payment on time.
Stock turnover ratio:
William Hilll Ladbrokes Paddy Power
0
100
200
300
400
500
600
700
800
900
1000
Stock turnover ratio
in days
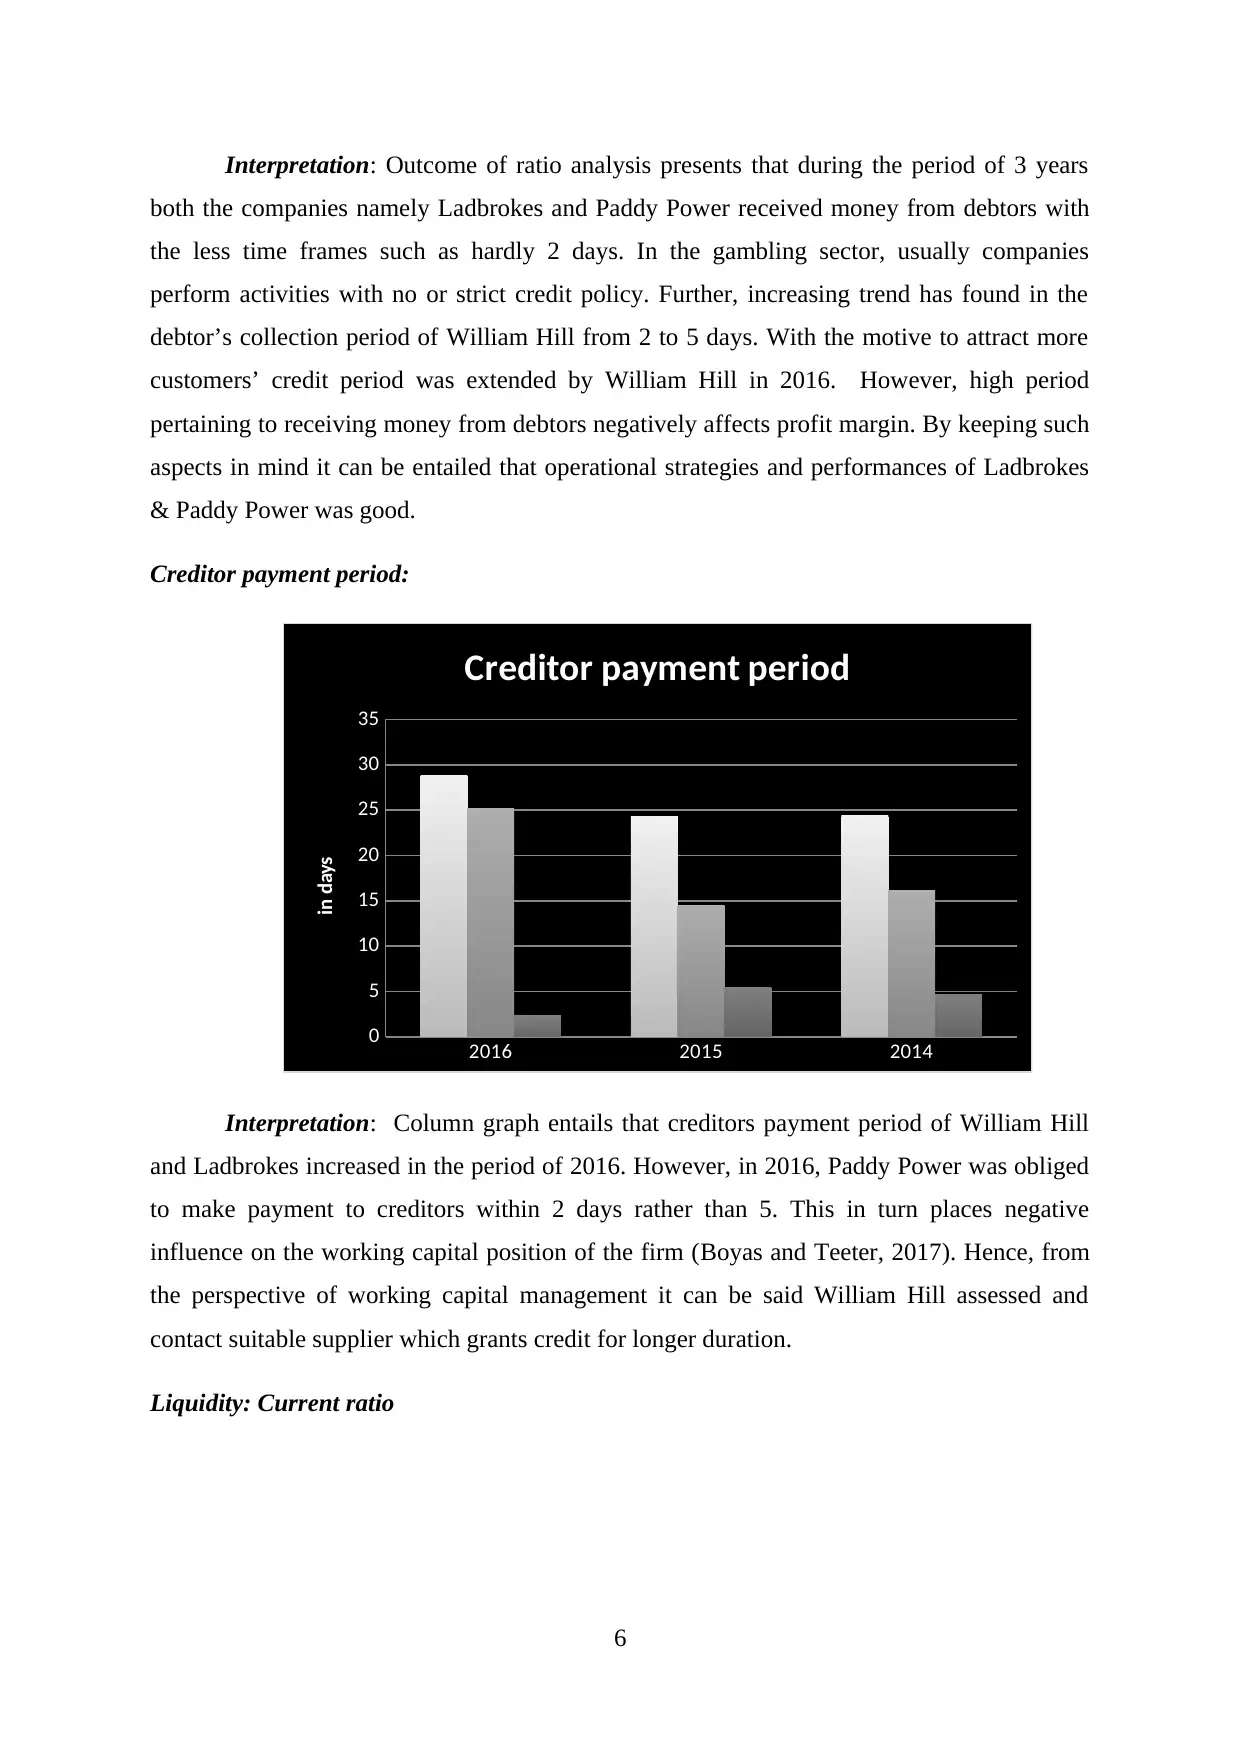
Interpretation: Derived outcome shows that William Hill and Paddy power had sold
their inventory frequently. Moreover, brand loyalty and image of both such gambling
companies are highly good. However, due to the controversial advertisements Paddy Power
failed to influence customers towards the services offer by it. Hence, stock turnover ratio of
William Hill and Paddy Power is considered as good over Ladbrokes.
Collection period (in days):
William Hilll Ladbrokes Paddy Power
0
1
2
3
4
5
Collection period (in days)
in days
5
extent. Swot analysis presents that financial management of William Hill is good which in
turn assists it in making interest payment on time.
Stock turnover ratio:
William Hilll Ladbrokes Paddy Power
0
100
200
300
400
500
600
700
800
900
1000
Stock turnover ratio
in days
Interpretation: Derived outcome shows that William Hill and Paddy power had sold
their inventory frequently. Moreover, brand loyalty and image of both such gambling
companies are highly good. However, due to the controversial advertisements Paddy Power
failed to influence customers towards the services offer by it. Hence, stock turnover ratio of
William Hill and Paddy Power is considered as good over Ladbrokes.
Collection period (in days):
William Hilll Ladbrokes Paddy Power
0
1
2
3
4
5
Collection period (in days)
in days
5
Paraphrase This Document
Need a fresh take? Get an instant paraphrase of this document with our AI Paraphraser
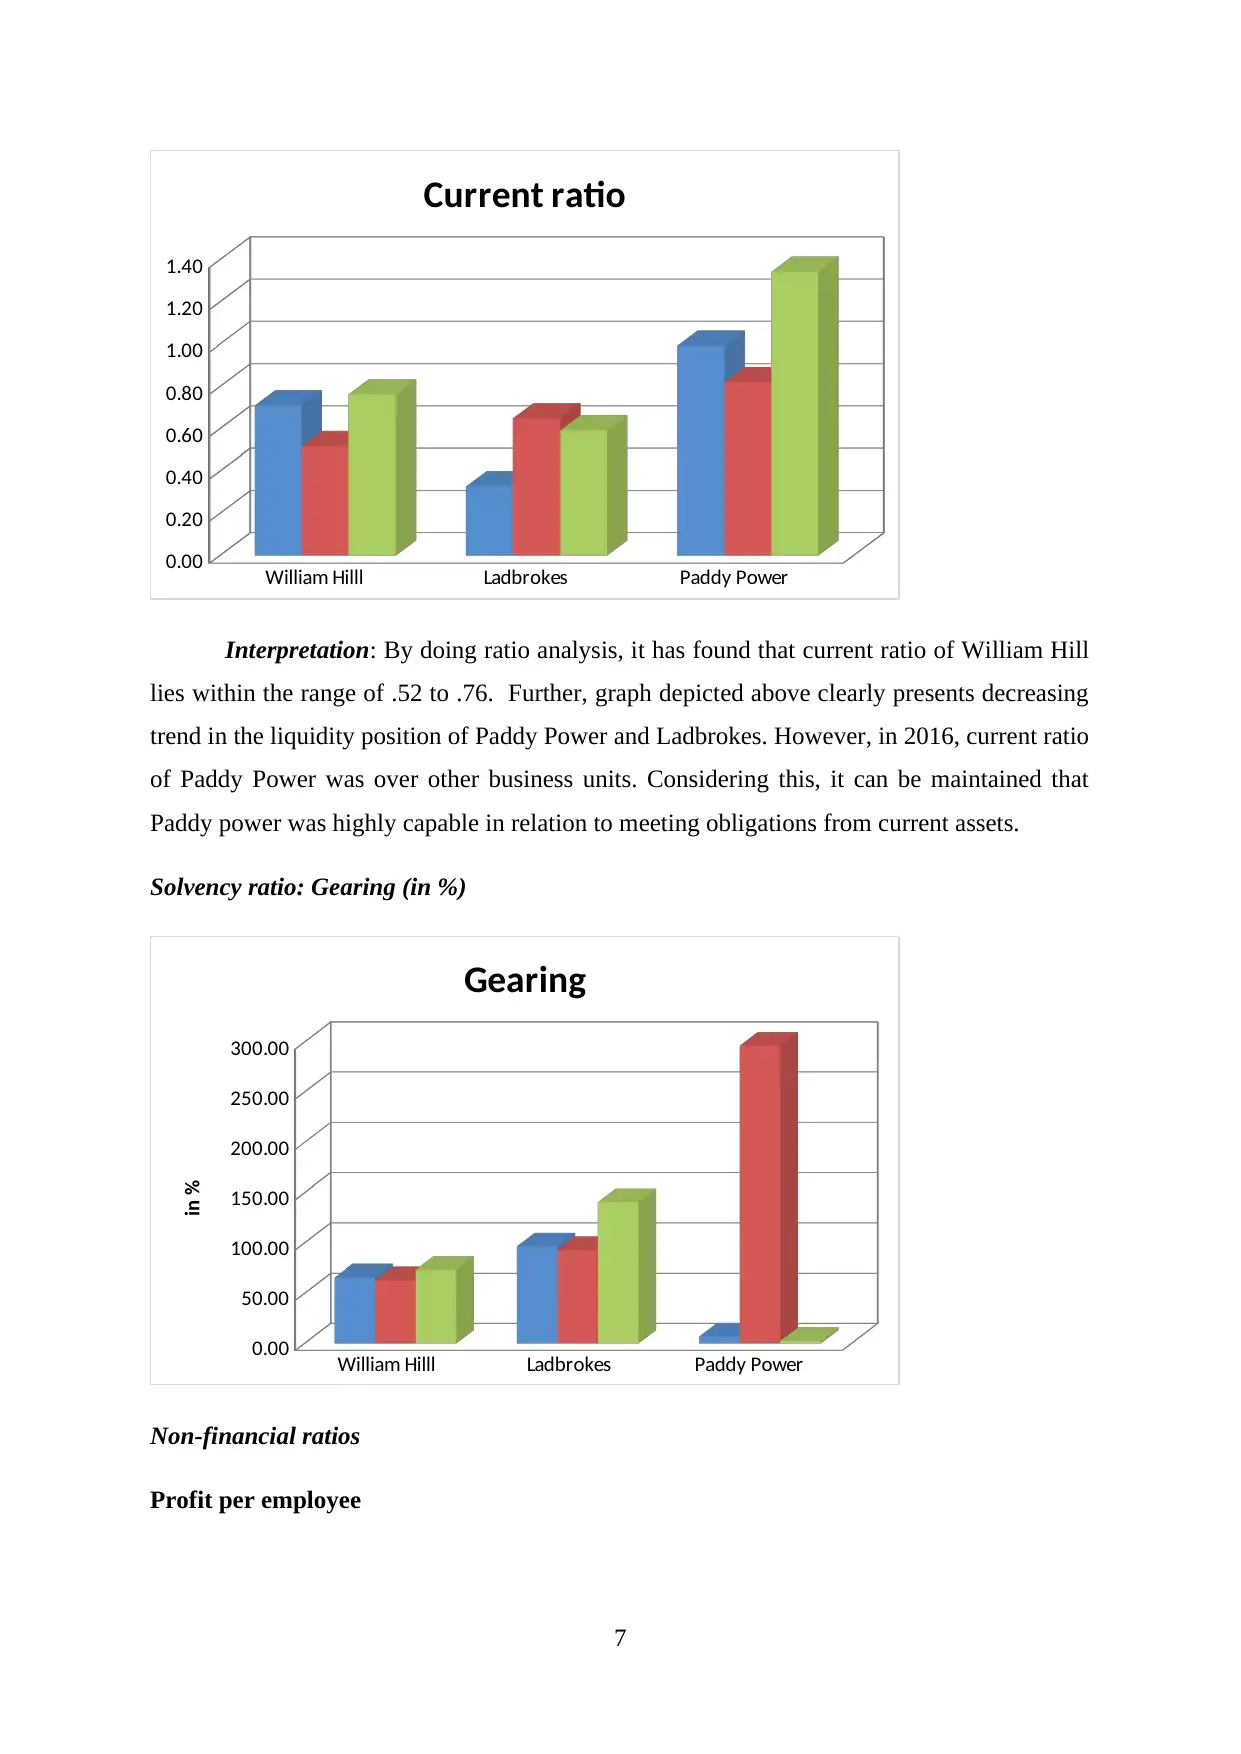
Interpretation: Outcome of ratio analysis presents that during the period of 3 years
both the companies namely Ladbrokes and Paddy Power received money from debtors with
the less time frames such as hardly 2 days. In the gambling sector, usually companies
perform activities with no or strict credit policy. Further, increasing trend has found in the
debtor’s collection period of William Hill from 2 to 5 days. With the motive to attract more
customers’ credit period was extended by William Hill in 2016. However, high period
pertaining to receiving money from debtors negatively affects profit margin. By keeping such
aspects in mind it can be entailed that operational strategies and performances of Ladbrokes
& Paddy Power was good.
Creditor payment period:
2016 2015 2014
0
5
10
15
20
25
30
35
Creditor payment period
in days
Interpretation: Column graph entails that creditors payment period of William Hill
and Ladbrokes increased in the period of 2016. However, in 2016, Paddy Power was obliged
to make payment to creditors within 2 days rather than 5. This in turn places negative
influence on the working capital position of the firm (Boyas and Teeter, 2017). Hence, from
the perspective of working capital management it can be said William Hill assessed and
contact suitable supplier which grants credit for longer duration.
Liquidity: Current ratio
6
William Hilll Ladbrokes Paddy Power
0.00
0.20
0.40
0.60
0.80
1.00
1.20
1.40
Current ratio
Interpretation: By doing ratio analysis, it has found that current ratio of William Hill
lies within the range of .52 to .76. Further, graph depicted above clearly presents decreasing
trend in the liquidity position of Paddy Power and Ladbrokes. However, in 2016, current ratio
of Paddy Power was over other business units. Considering this, it can be maintained that
Paddy power was highly capable in relation to meeting obligations from current assets.
Solvency ratio: Gearing (in %)
William Hilll Ladbrokes Paddy Power
0.00
50.00
100.00
150.00
200.00
250.00
300.00
Gearing
in %
Non-financial ratios
Profit per employee
7
0.00
0.20
0.40
0.60
0.80
1.00
1.20
1.40
Current ratio
Interpretation: By doing ratio analysis, it has found that current ratio of William Hill
lies within the range of .52 to .76. Further, graph depicted above clearly presents decreasing
trend in the liquidity position of Paddy Power and Ladbrokes. However, in 2016, current ratio
of Paddy Power was over other business units. Considering this, it can be maintained that
Paddy power was highly capable in relation to meeting obligations from current assets.
Solvency ratio: Gearing (in %)
William Hilll Ladbrokes Paddy Power
0.00
50.00
100.00
150.00
200.00
250.00
300.00
Gearing
in %
Non-financial ratios
Profit per employee
7
⊘ This is a preview!⊘
Do you want full access?
Subscribe today to unlock all pages.
Trusted by 1+ million students worldwide
William Hilll Ladbrokes Paddy Power
-10
-5
0
5
10
15
20
25
30
Profit per employee
in Th
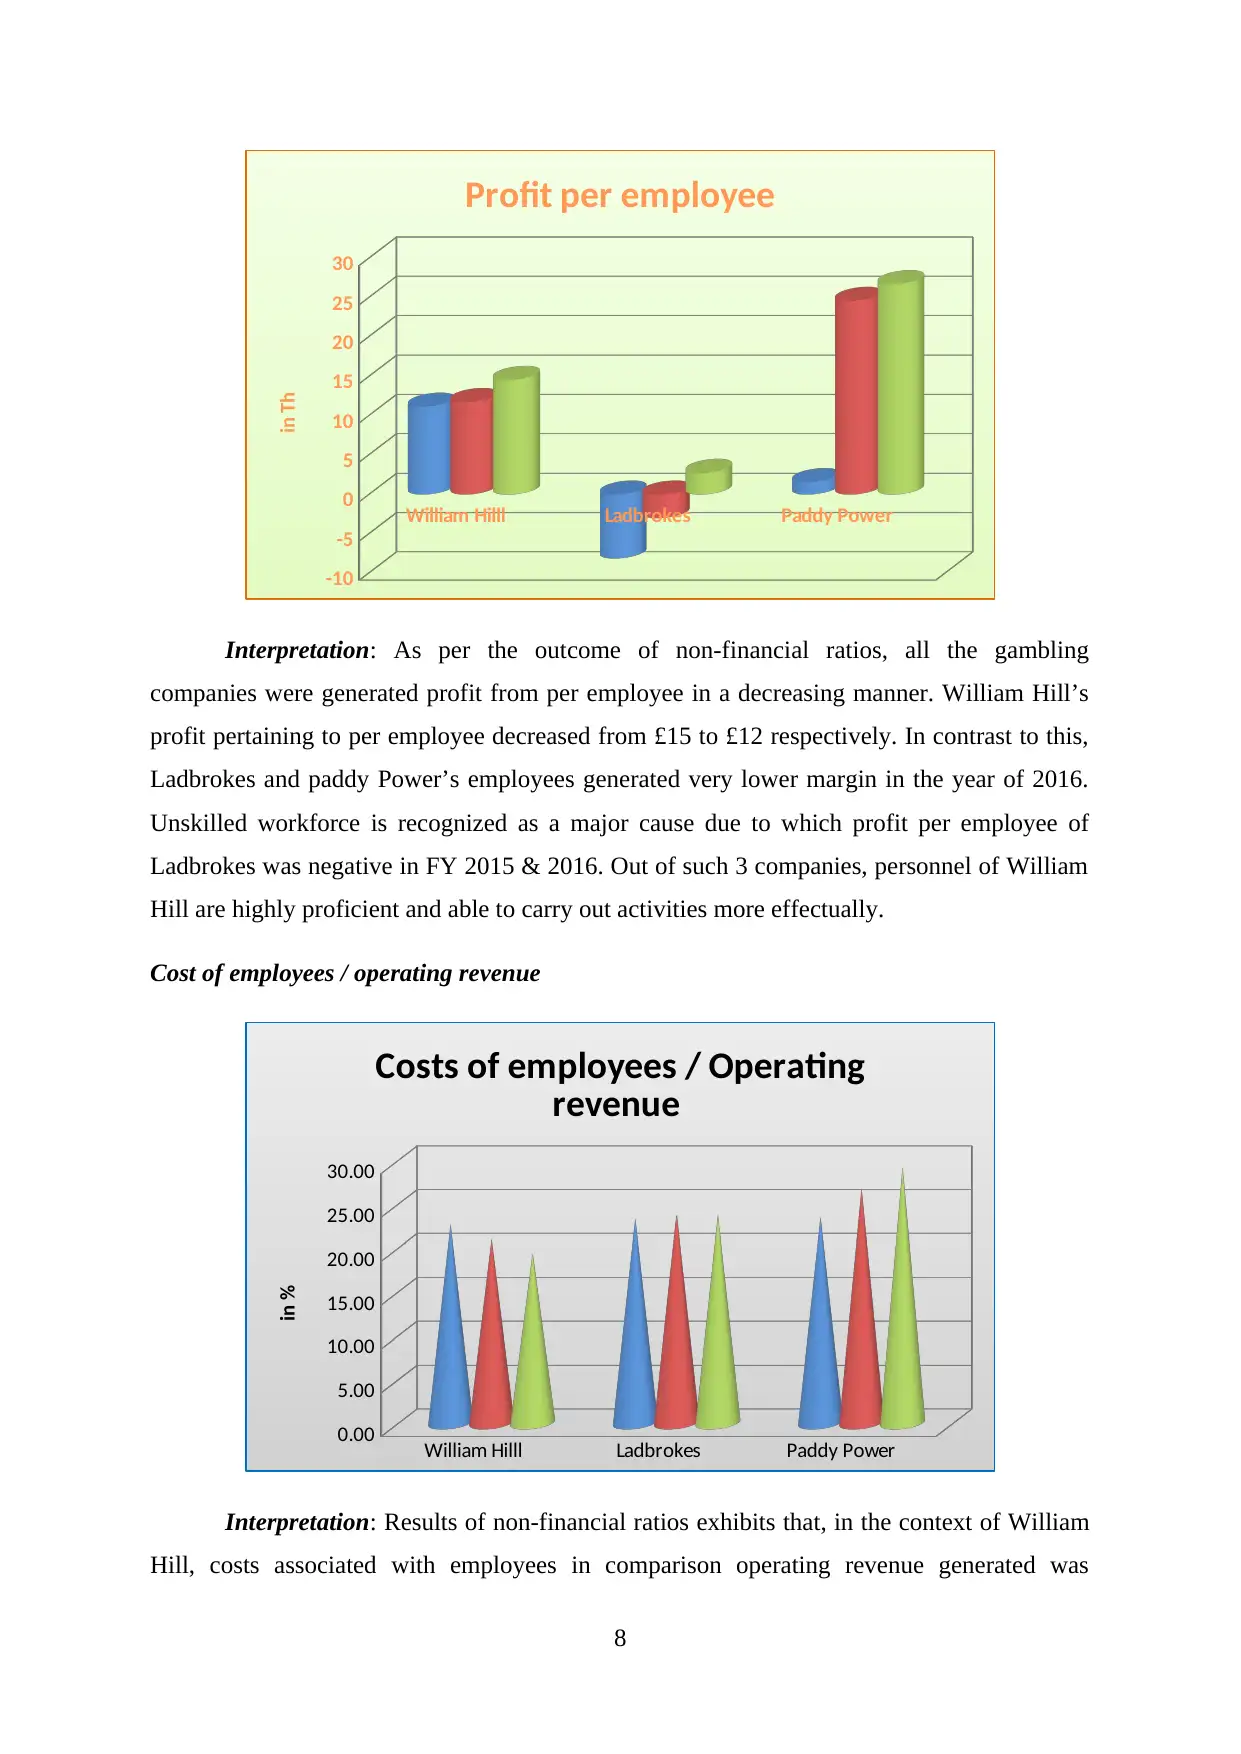
Interpretation: As per the outcome of non-financial ratios, all the gambling
companies were generated profit from per employee in a decreasing manner. William Hill’s
profit pertaining to per employee decreased from £15 to £12 respectively. In contrast to this,
Ladbrokes and paddy Power’s employees generated very lower margin in the year of 2016.
Unskilled workforce is recognized as a major cause due to which profit per employee of
Ladbrokes was negative in FY 2015 & 2016. Out of such 3 companies, personnel of William
Hill are highly proficient and able to carry out activities more effectually.
Cost of employees / operating revenue
William Hilll Ladbrokes Paddy Power
0.00
5.00
10.00
15.00
20.00
25.00
30.00
Costs of employees / Operating
revenue
in %
Interpretation: Results of non-financial ratios exhibits that, in the context of William
Hill, costs associated with employees in comparison operating revenue generated was
8
-10
-5
0
5
10
15
20
25
30
Profit per employee
in Th
Interpretation: As per the outcome of non-financial ratios, all the gambling
companies were generated profit from per employee in a decreasing manner. William Hill’s
profit pertaining to per employee decreased from £15 to £12 respectively. In contrast to this,
Ladbrokes and paddy Power’s employees generated very lower margin in the year of 2016.
Unskilled workforce is recognized as a major cause due to which profit per employee of
Ladbrokes was negative in FY 2015 & 2016. Out of such 3 companies, personnel of William
Hill are highly proficient and able to carry out activities more effectually.
Cost of employees / operating revenue
William Hilll Ladbrokes Paddy Power
0.00
5.00
10.00
15.00
20.00
25.00
30.00
Costs of employees / Operating
revenue
in %
Interpretation: Results of non-financial ratios exhibits that, in the context of William
Hill, costs associated with employees in comparison operating revenue generated was
8
Paraphrase This Document
Need a fresh take? Get an instant paraphrase of this document with our AI Paraphraser
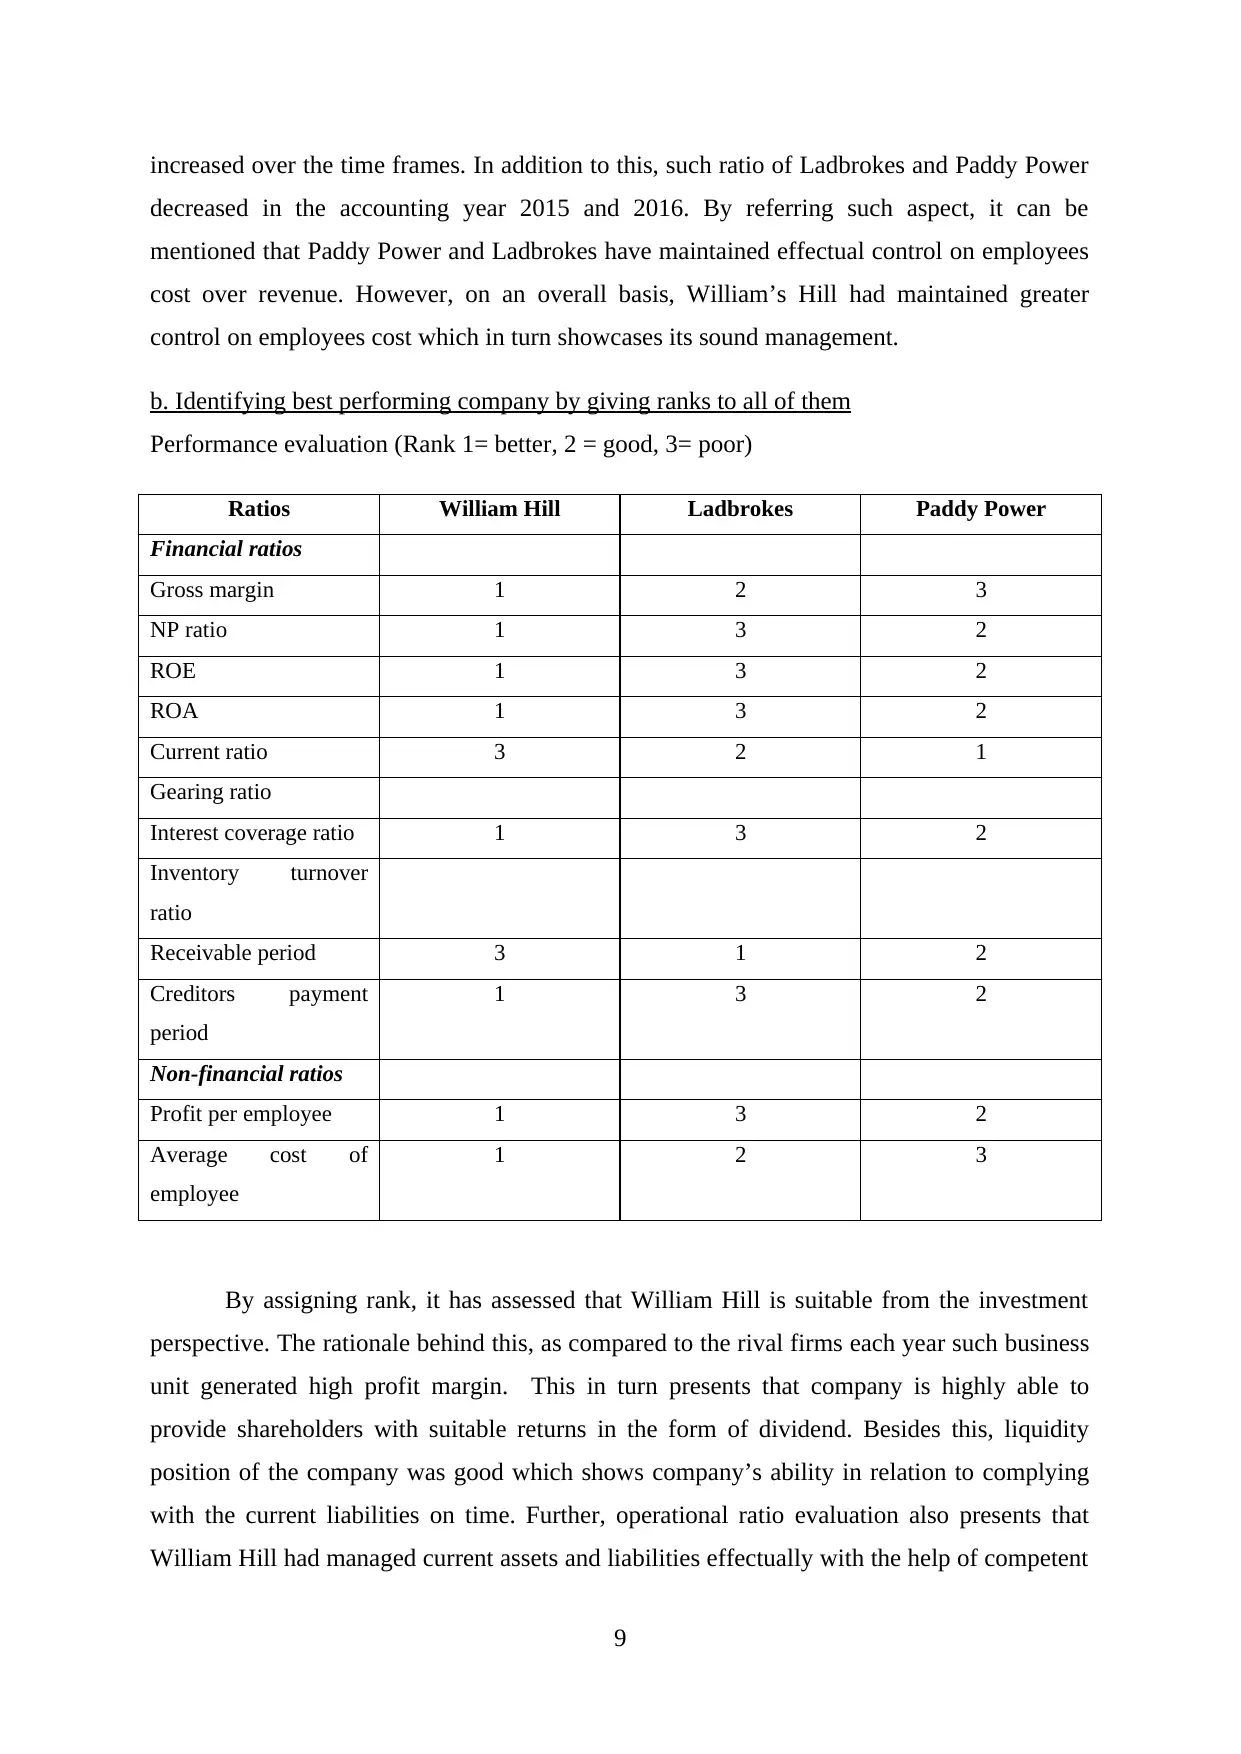
increased over the time frames. In addition to this, such ratio of Ladbrokes and Paddy Power
decreased in the accounting year 2015 and 2016. By referring such aspect, it can be
mentioned that Paddy Power and Ladbrokes have maintained effectual control on employees
cost over revenue. However, on an overall basis, William’s Hill had maintained greater
control on employees cost which in turn showcases its sound management.
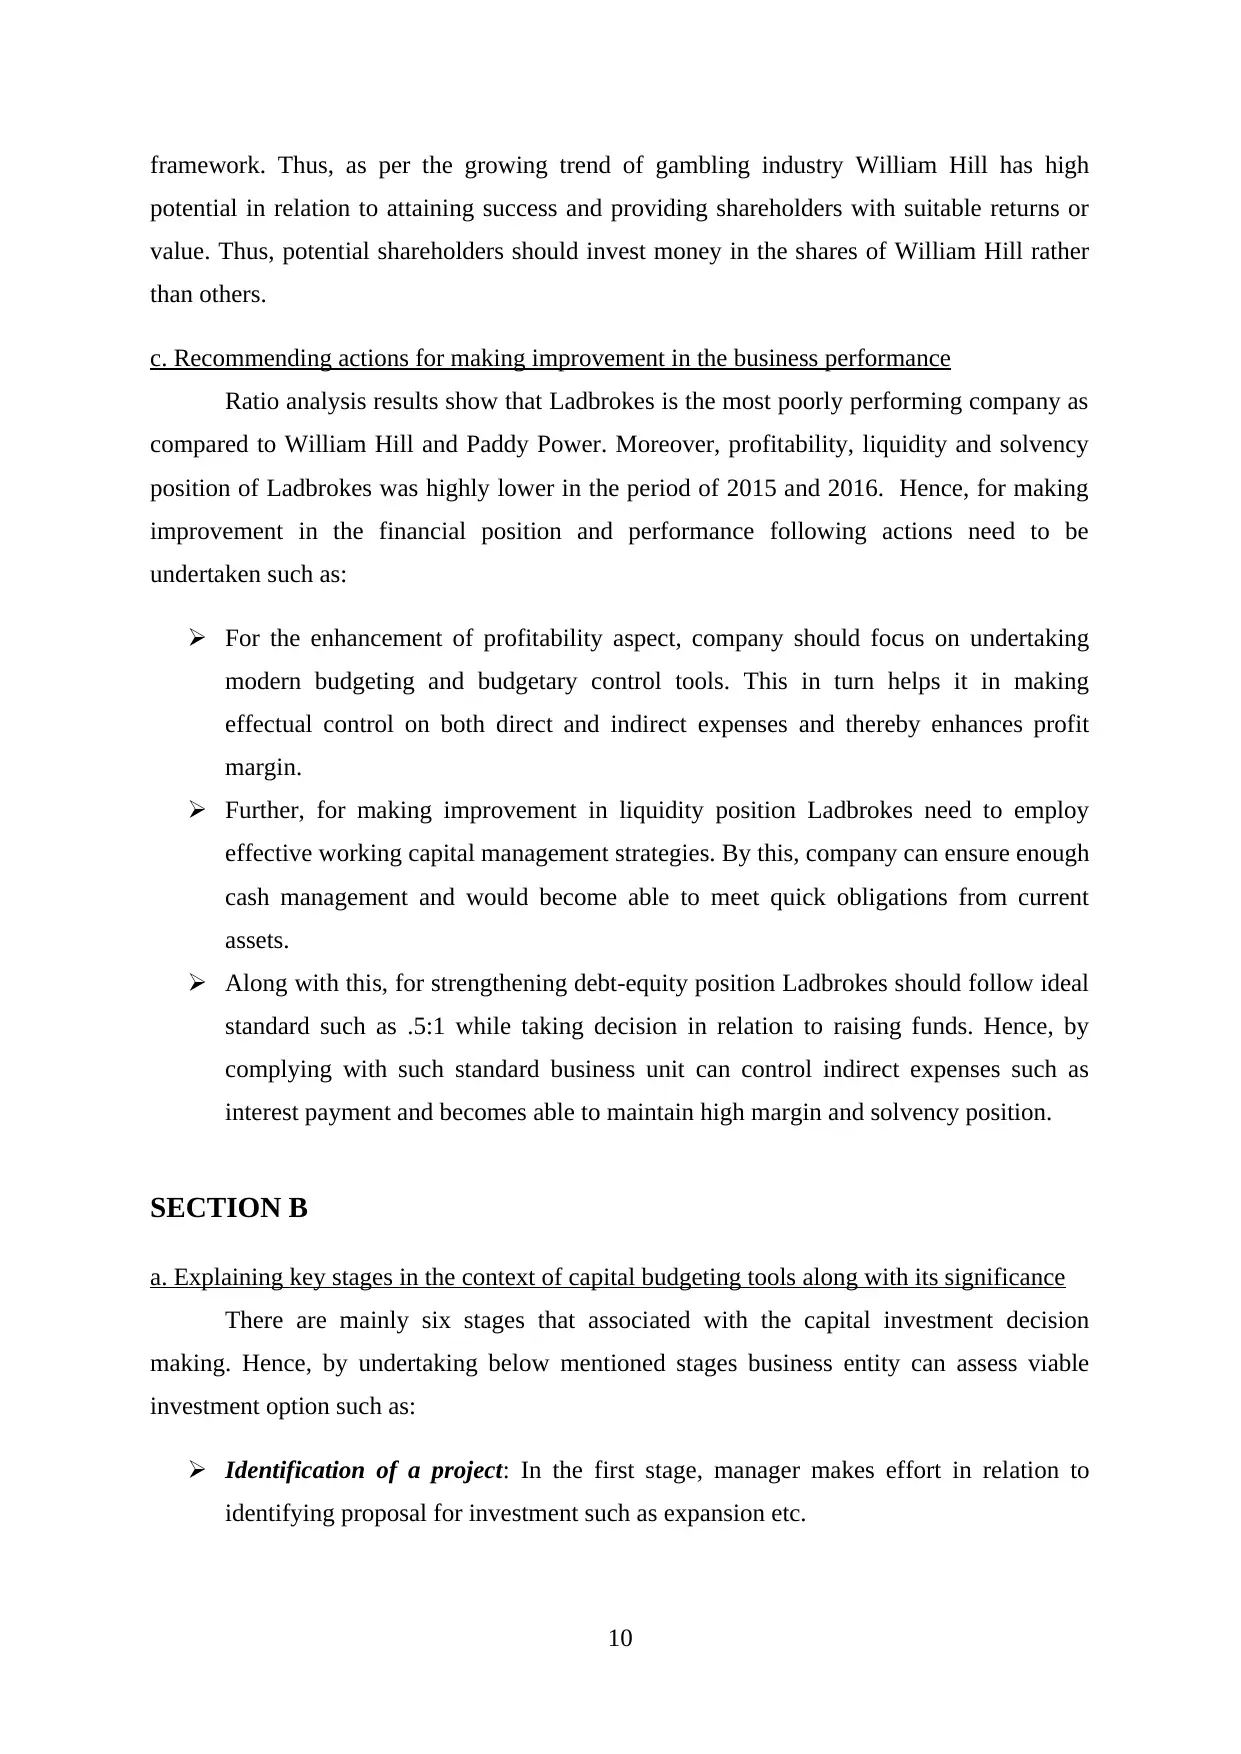
b. Identifying best performing company by giving ranks to all of them
Performance evaluation (Rank 1= better, 2 = good, 3= poor)
Ratios William Hill Ladbrokes Paddy Power
Financial ratios
Gross margin 1 2 3
NP ratio 1 3 2
ROE 1 3 2
ROA 1 3 2
Current ratio 3 2 1
Gearing ratio
Interest coverage ratio 1 3 2
Inventory turnover
ratio
Receivable period 3 1 2
Creditors payment
period
1 3 2
Non-financial ratios
Profit per employee 1 3 2
Average cost of
employee
1 2 3
By assigning rank, it has assessed that William Hill is suitable from the investment
perspective. The rationale behind this, as compared to the rival firms each year such business
unit generated high profit margin. This in turn presents that company is highly able to
provide shareholders with suitable returns in the form of dividend. Besides this, liquidity
position of the company was good which shows company’s ability in relation to complying
with the current liabilities on time. Further, operational ratio evaluation also presents that
William Hill had managed current assets and liabilities effectually with the help of competent
9
decreased in the accounting year 2015 and 2016. By referring such aspect, it can be
mentioned that Paddy Power and Ladbrokes have maintained effectual control on employees
cost over revenue. However, on an overall basis, William’s Hill had maintained greater
control on employees cost which in turn showcases its sound management.
b. Identifying best performing company by giving ranks to all of them
Performance evaluation (Rank 1= better, 2 = good, 3= poor)
Ratios William Hill Ladbrokes Paddy Power
Financial ratios
Gross margin 1 2 3
NP ratio 1 3 2
ROE 1 3 2
ROA 1 3 2
Current ratio 3 2 1
Gearing ratio
Interest coverage ratio 1 3 2
Inventory turnover
ratio
Receivable period 3 1 2
Creditors payment
period
1 3 2
Non-financial ratios
Profit per employee 1 3 2
Average cost of
employee
1 2 3
By assigning rank, it has assessed that William Hill is suitable from the investment
perspective. The rationale behind this, as compared to the rival firms each year such business
unit generated high profit margin. This in turn presents that company is highly able to
provide shareholders with suitable returns in the form of dividend. Besides this, liquidity
position of the company was good which shows company’s ability in relation to complying
with the current liabilities on time. Further, operational ratio evaluation also presents that
William Hill had managed current assets and liabilities effectually with the help of competent
9
framework. Thus, as per the growing trend of gambling industry William Hill has high
potential in relation to attaining success and providing shareholders with suitable returns or
value. Thus, potential shareholders should invest money in the shares of William Hill rather
than others.
c. Recommending actions for making improvement in the business performance
Ratio analysis results show that Ladbrokes is the most poorly performing company as
compared to William Hill and Paddy Power. Moreover, profitability, liquidity and solvency
position of Ladbrokes was highly lower in the period of 2015 and 2016. Hence, for making
improvement in the financial position and performance following actions need to be
undertaken such as:
For the enhancement of profitability aspect, company should focus on undertaking
modern budgeting and budgetary control tools. This in turn helps it in making
effectual control on both direct and indirect expenses and thereby enhances profit
margin.
Further, for making improvement in liquidity position Ladbrokes need to employ
effective working capital management strategies. By this, company can ensure enough
cash management and would become able to meet quick obligations from current
assets.
Along with this, for strengthening debt-equity position Ladbrokes should follow ideal
standard such as .5:1 while taking decision in relation to raising funds. Hence, by
complying with such standard business unit can control indirect expenses such as
interest payment and becomes able to maintain high margin and solvency position.
SECTION B
a. Explaining key stages in the context of capital budgeting tools along with its significance
There are mainly six stages that associated with the capital investment decision
making. Hence, by undertaking below mentioned stages business entity can assess viable
investment option such as:
Identification of a project: In the first stage, manager makes effort in relation to
identifying proposal for investment such as expansion etc.
10
⊘ This is a preview!⊘
Do you want full access?
Subscribe today to unlock all pages.
Trusted by 1+ million students worldwide
1 out of 17
Related Documents


Your All-in-One AI-Powered Toolkit for Academic Success.
+13062052269
info@desklib.com
Available 24*7 on WhatsApp / Email
![[object Object]](/_next/static/media/star-bottom.7253800d.svg)
Unlock your academic potential
Copyright © 2020–2026 A2Z Services. All Rights Reserved. Developed and managed by ZUCOL.