7COM1079 Team Research Project: Video Game Sales and Ratings
VerifiedAdded on 2022/09/10
|13
|1855
|29
Project
AI Summary
This project investigates the relationship between video game sales and critic/user ratings. The research employs correlation analysis to determine the strength and type of relationship between game sales and the ratings globally and in different regions. The findings indicate a weak, directly proportional relationship between sales and critic ratings, and a stronger relationship between user and critic ratings. The study uses data from 16720 games, examining sales figures, critic scores, user scores, and other relevant variables. The project explores the impact of both critic and user reviews on sales, providing insights into the video game industry's revenue generation. The project also highlights the importance of critic scores and user reviews for video game developers.
Relationship between Performance Ratings and Sales of Video Games (Team Research and
Development)
Development)
Paraphrase This Document
Need a fresh take? Get an instant paraphrase of this document with our AI Paraphraser
Relationship between Performance Ratings and Sales of Video Games (Team Research and
Development)
Abstract
The research in this study aims at determining the relationship between the video games’ sales
and, the critic and gamer ratings of the games. The correlation analysis statistical technique is
applied in this research to obtain the strength and type of relationship between sales and the
ratings globally and in different regions across the world. The analysis in this study infer that
there is a weak directly proportional relationship between the sales and ratings of the video
games, with the relationship stronger for the case of the critic ratings both globally and in
different regions around the world. The analysis also reveal that there is a strong directly
proportional relationship between the user and gamer ratings.
Introduction
Video gaming has increasingly become a profitable industry with the spread of access to internet
and technology across the world (Laudon & Guercio, 2014). This spread has enabled video
gaming to move from single and two gamers to multi gamers irrespective of locations. The
technology has enabled huge improvements in graphics as well as the hardware for better user
experience while the internet is responsible for allowing a multi user interface in the video
games, which make it possible for players in completely different locations around the world to
play in the same video game (Pursell, 2015; Trottier, 2017). A better user experience and global
exposure of video games has resulted in increased revenues for the video gaming industry.
Revenue generating avenues within the industry such as professional gaming that attracts
advertisements, sponsorships and TV rights for airing have been the major drivers of the success
2
Relationship between Performance Ratings and Sales of Video Games (Team Research and
Development)
in the industry (Pursell, 2015). This exponential growth in the industry necessitates research into
how to better the user experience and understanding the relationship between the user experience
and the revenues generated in the industry.
Background
Ian, Lennart & Regan (2011) explores the implied effect of reviews and ratings of video games
on the sales by looking at their effect on the user experience. The research applies both Mann-
Whitney Test and Wilcoxon Signed Rank Test to investigate the user experience with respect to
the reviews that ratings observed for the video game. Ian, Lennart & Regan (2011) finds that
both professional and user reviews had a significant effect on the user experience in the video
games, hence implying an impact on the sales. Christy, et al (2015) focuses on how best video
gaming companies can improve their sales for online games. The research conducts empirical
analysis on what would attract users to play more online games. Applying psychological into
developing experiences that are more attractive for gamers is an important part of customer
retention in the video gaming industry (Christy, et al., 2015). This study investigates how ratings
by critics and gamers of video games directly relates with the sales by drawing on the research in
the above studies.
Research Question
This research assesses the following research questions:
3
⊘ This is a preview!⊘
Do you want full access?
Subscribe today to unlock all pages.
Trusted by 1+ million students worldwide
Relationship between Performance Ratings and Sales of Video Games (Team Research and
Development)
1. Is there a relationship between global video game sales and the critic scores of the video
games?
2. Is the relationship between video game sales and the critic scores of the video games
similar in different regions?
3. Is there any relationship between video games’ critic scores and user scores?
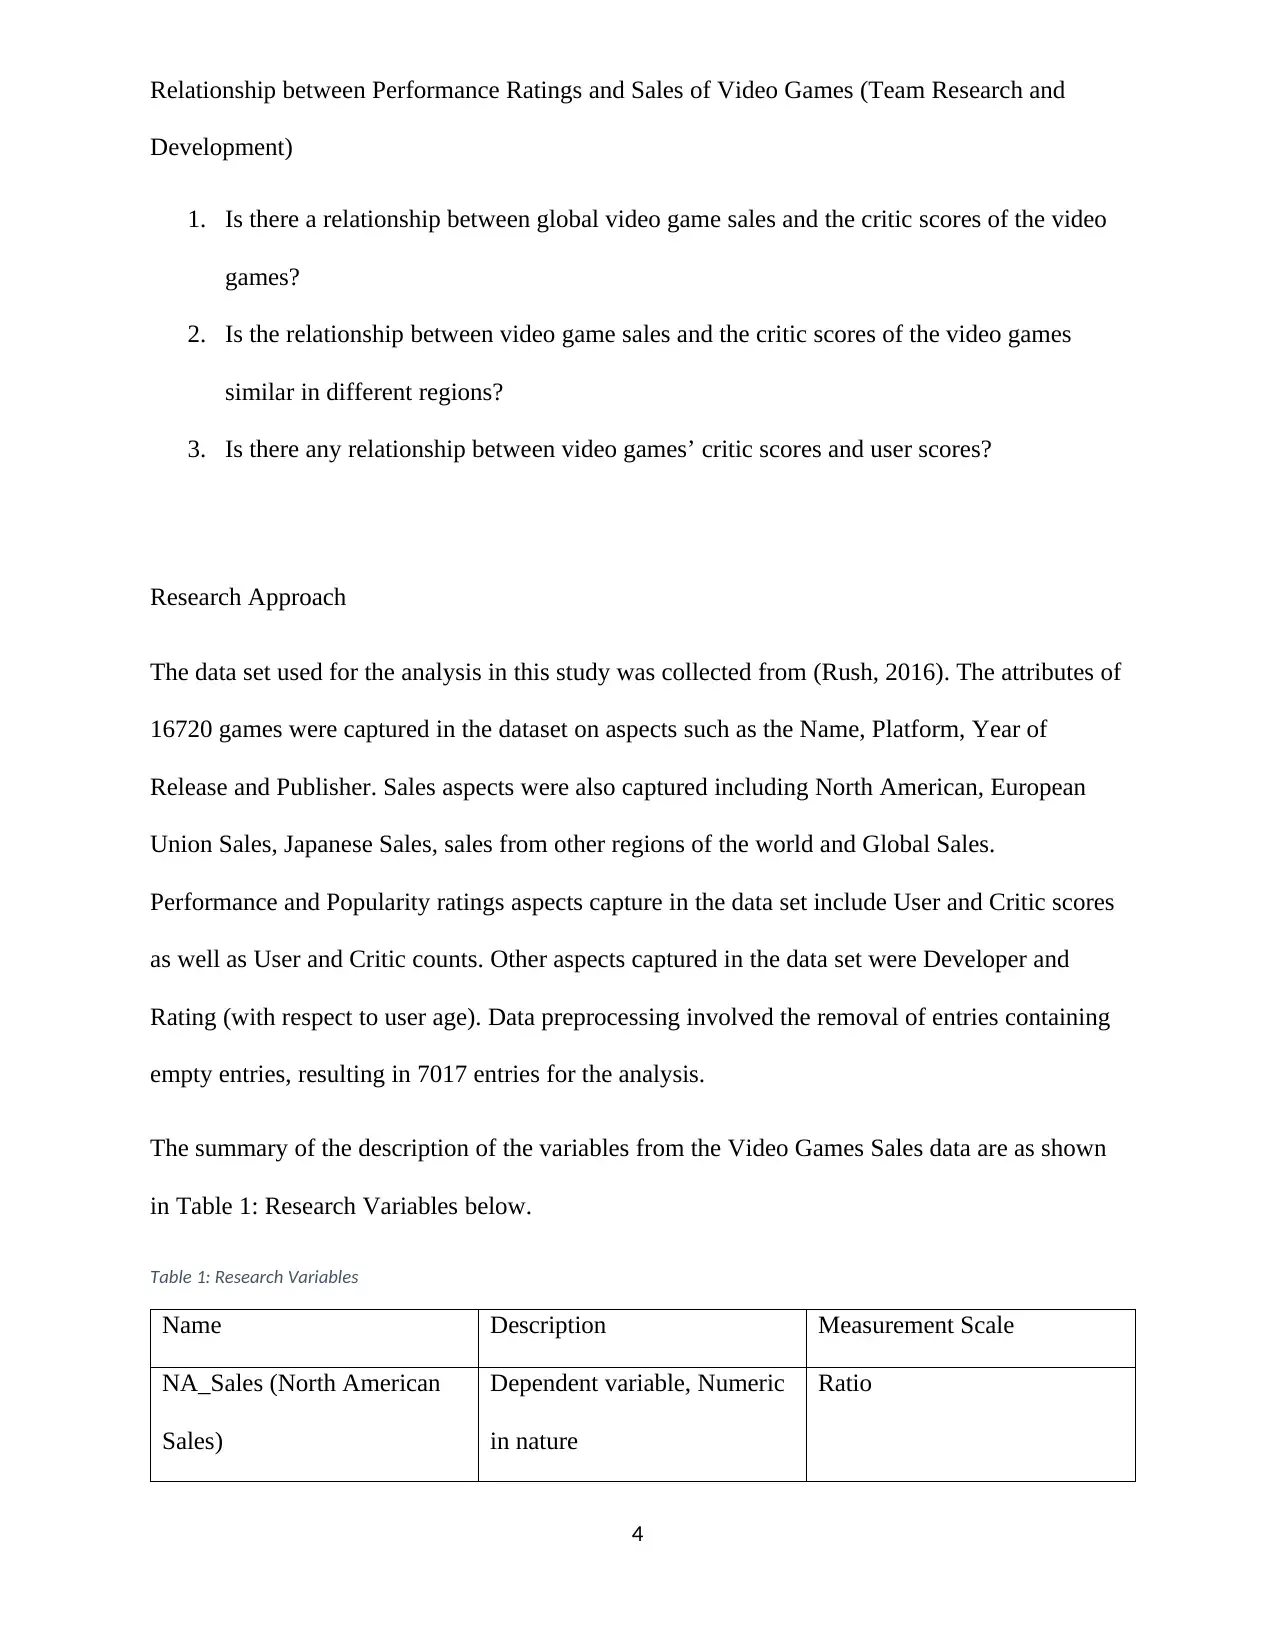
Research Approach
The data set used for the analysis in this study was collected from (Rush, 2016). The attributes of
16720 games were captured in the dataset on aspects such as the Name, Platform, Year of
Release and Publisher. Sales aspects were also captured including North American, European
Union Sales, Japanese Sales, sales from other regions of the world and Global Sales.
Performance and Popularity ratings aspects capture in the data set include User and Critic scores
as well as User and Critic counts. Other aspects captured in the data set were Developer and
Rating (with respect to user age). Data preprocessing involved the removal of entries containing
empty entries, resulting in 7017 entries for the analysis.
The summary of the description of the variables from the Video Games Sales data are as shown
in Table 1: Research Variables below.
Table 1: Research Variables
Name Description Measurement Scale
NA_Sales (North American
Sales)
Dependent variable, Numeric
in nature
Ratio
4
Development)
1. Is there a relationship between global video game sales and the critic scores of the video
games?
2. Is the relationship between video game sales and the critic scores of the video games
similar in different regions?
3. Is there any relationship between video games’ critic scores and user scores?
Research Approach
The data set used for the analysis in this study was collected from (Rush, 2016). The attributes of
16720 games were captured in the dataset on aspects such as the Name, Platform, Year of
Release and Publisher. Sales aspects were also captured including North American, European
Union Sales, Japanese Sales, sales from other regions of the world and Global Sales.
Performance and Popularity ratings aspects capture in the data set include User and Critic scores
as well as User and Critic counts. Other aspects captured in the data set were Developer and
Rating (with respect to user age). Data preprocessing involved the removal of entries containing
empty entries, resulting in 7017 entries for the analysis.
The summary of the description of the variables from the Video Games Sales data are as shown
in Table 1: Research Variables below.
Table 1: Research Variables
Name Description Measurement Scale
NA_Sales (North American
Sales)
Dependent variable, Numeric
in nature
Ratio
4
Paraphrase This Document
Need a fresh take? Get an instant paraphrase of this document with our AI Paraphraser
Relationship between Performance Ratings and Sales of Video Games (Team Research and
Development)
EU_Sales (European Union
Sales)
Dependent variable, Numeric
in nature
Ratio
JP_Sales (Japanese Sales) Dependent variable, Numeric
in nature
Ratio
Other_Sales (Sales from other
regions around the world)
Dependent variable, Numeric
in nature
Ratio
Global_Sales Dependent variable, Numeric
in nature
Ratio
Critic_Score Independent variable,
Numeric in nature
Ratio
User_Score Dependent variable, Numeric
in nature
Ratio
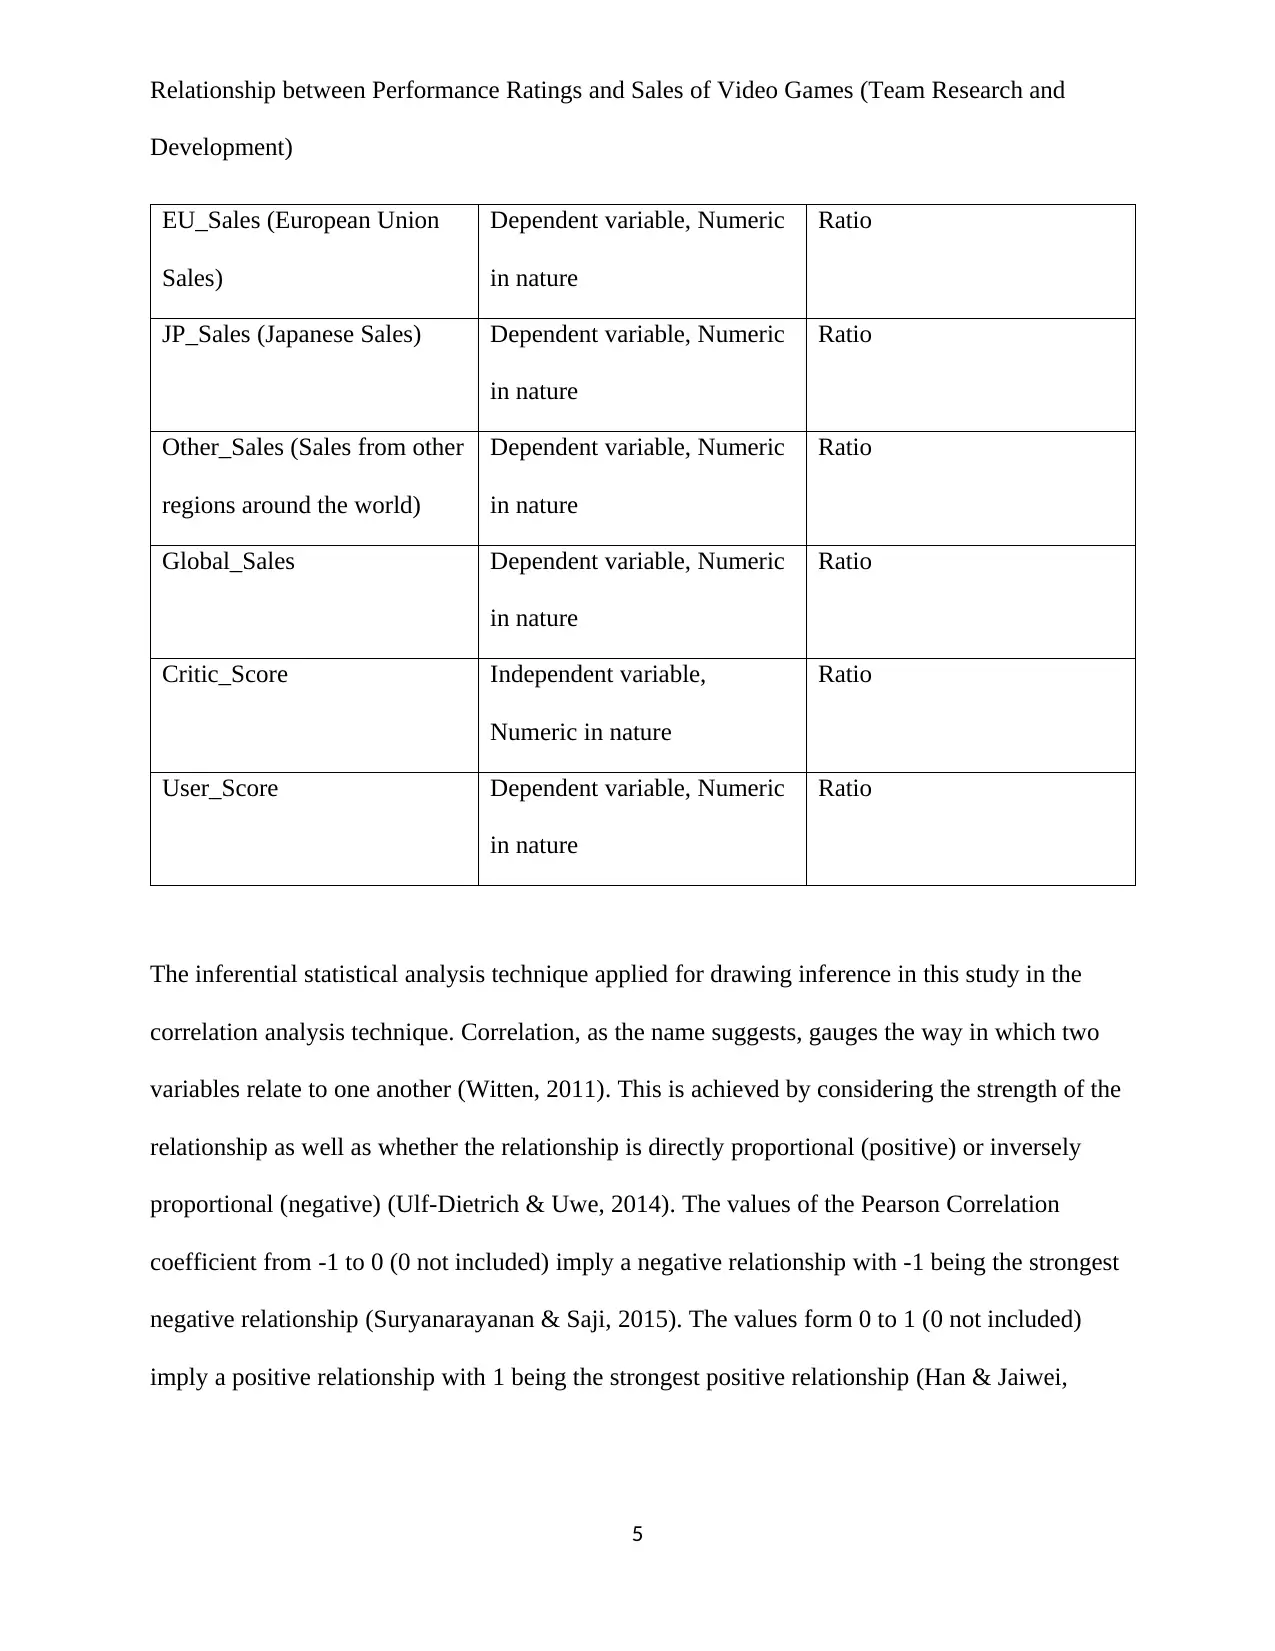
The inferential statistical analysis technique applied for drawing inference in this study in the
correlation analysis technique. Correlation, as the name suggests, gauges the way in which two
variables relate to one another (Witten, 2011). This is achieved by considering the strength of the
relationship as well as whether the relationship is directly proportional (positive) or inversely
proportional (negative) (Ulf-Dietrich & Uwe, 2014). The values of the Pearson Correlation
coefficient from -1 to 0 (0 not included) imply a negative relationship with -1 being the strongest
negative relationship (Suryanarayanan & Saji, 2015). The values form 0 to 1 (0 not included)
imply a positive relationship with 1 being the strongest positive relationship (Han & Jaiwei,
5
Development)
EU_Sales (European Union
Sales)
Dependent variable, Numeric
in nature
Ratio
JP_Sales (Japanese Sales) Dependent variable, Numeric
in nature
Ratio
Other_Sales (Sales from other
regions around the world)
Dependent variable, Numeric
in nature
Ratio
Global_Sales Dependent variable, Numeric
in nature
Ratio
Critic_Score Independent variable,
Numeric in nature
Ratio
User_Score Dependent variable, Numeric
in nature
Ratio
The inferential statistical analysis technique applied for drawing inference in this study in the
correlation analysis technique. Correlation, as the name suggests, gauges the way in which two
variables relate to one another (Witten, 2011). This is achieved by considering the strength of the
relationship as well as whether the relationship is directly proportional (positive) or inversely
proportional (negative) (Ulf-Dietrich & Uwe, 2014). The values of the Pearson Correlation
coefficient from -1 to 0 (0 not included) imply a negative relationship with -1 being the strongest
negative relationship (Suryanarayanan & Saji, 2015). The values form 0 to 1 (0 not included)
imply a positive relationship with 1 being the strongest positive relationship (Han & Jaiwei,
5
Relationship between Performance Ratings and Sales of Video Games (Team Research and
Development)
2011). A value of 0 implies absence of any relationship between the variables (Han & Jaiwei,
2011).
Results and Discussion
Descriptive Statistics
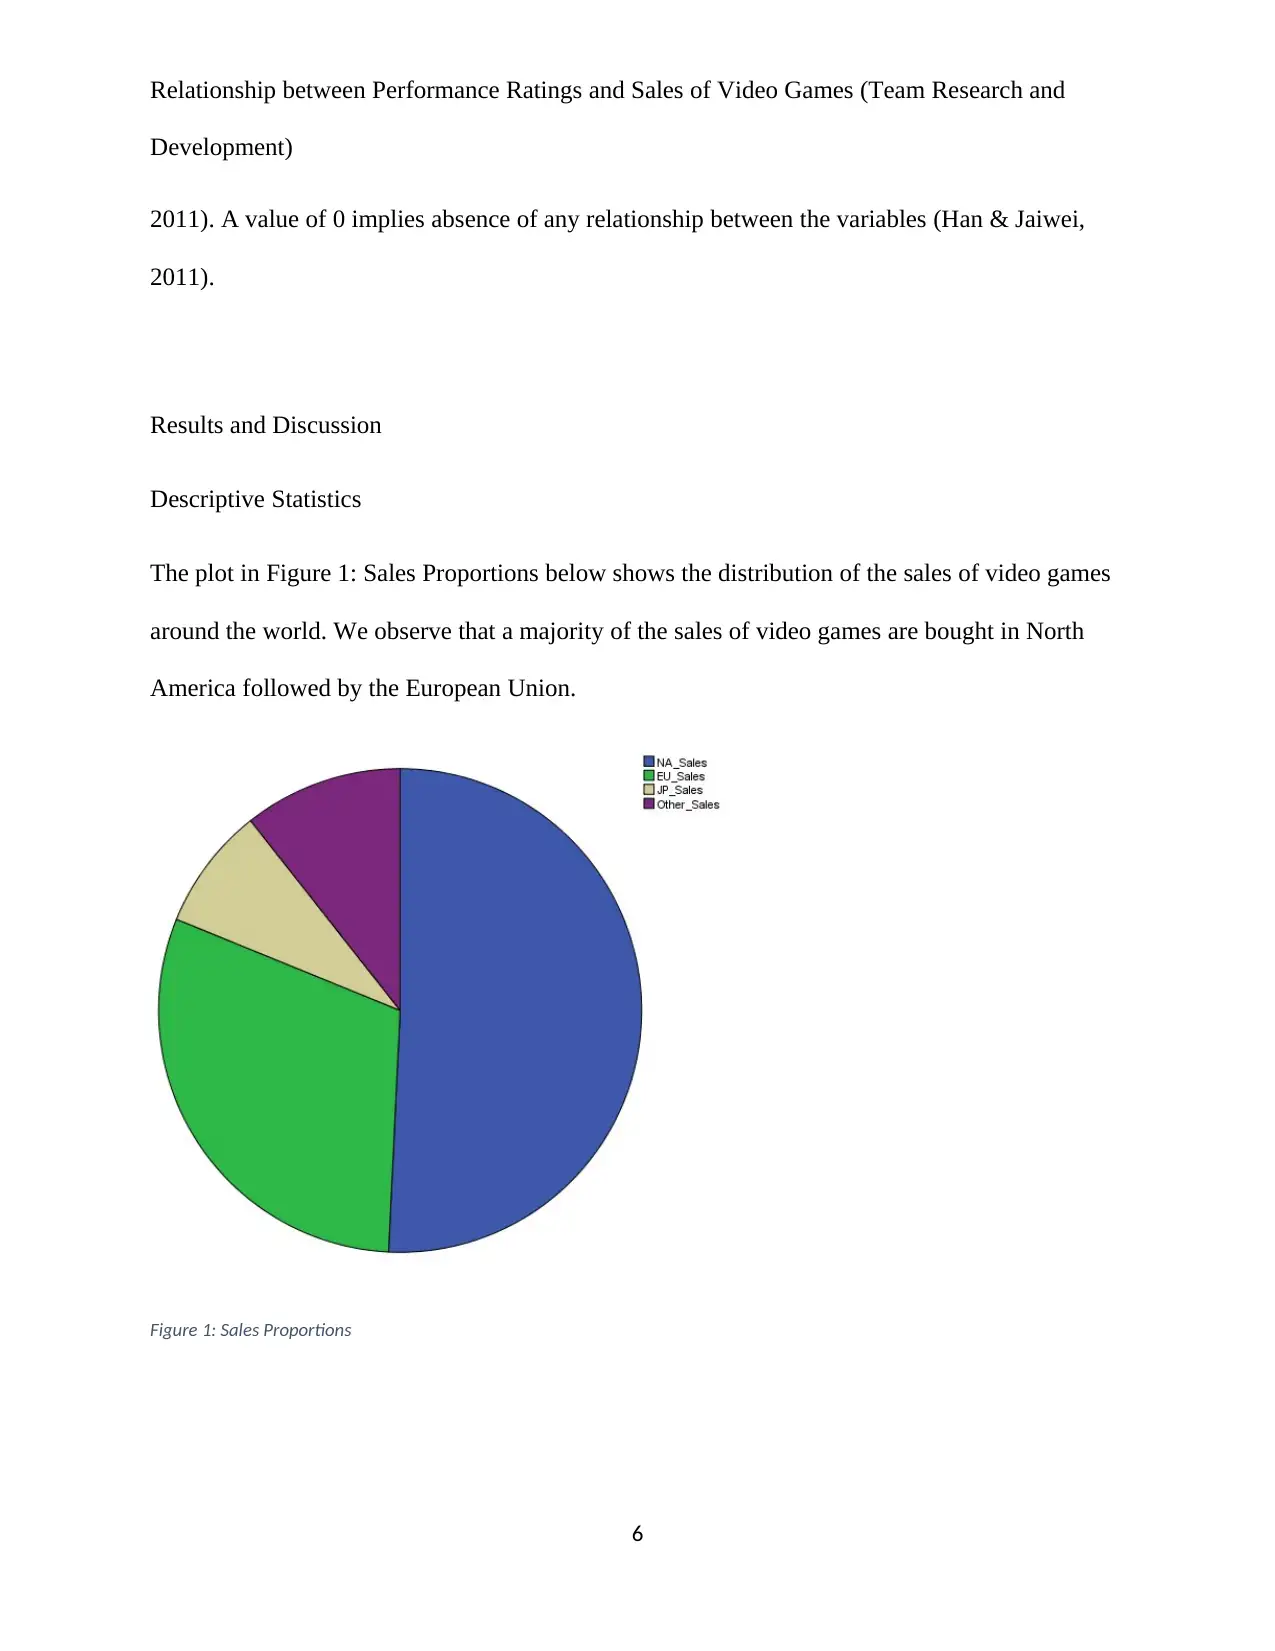
The plot in Figure 1: Sales Proportions below shows the distribution of the sales of video games
around the world. We observe that a majority of the sales of video games are bought in North
America followed by the European Union.
Figure 1: Sales Proportions
6
Development)
2011). A value of 0 implies absence of any relationship between the variables (Han & Jaiwei,
2011).
Results and Discussion
Descriptive Statistics
The plot in Figure 1: Sales Proportions below shows the distribution of the sales of video games
around the world. We observe that a majority of the sales of video games are bought in North
America followed by the European Union.
Figure 1: Sales Proportions
6
⊘ This is a preview!⊘
Do you want full access?
Subscribe today to unlock all pages.
Trusted by 1+ million students worldwide
Relationship between Performance Ratings and Sales of Video Games (Team Research and
Development)
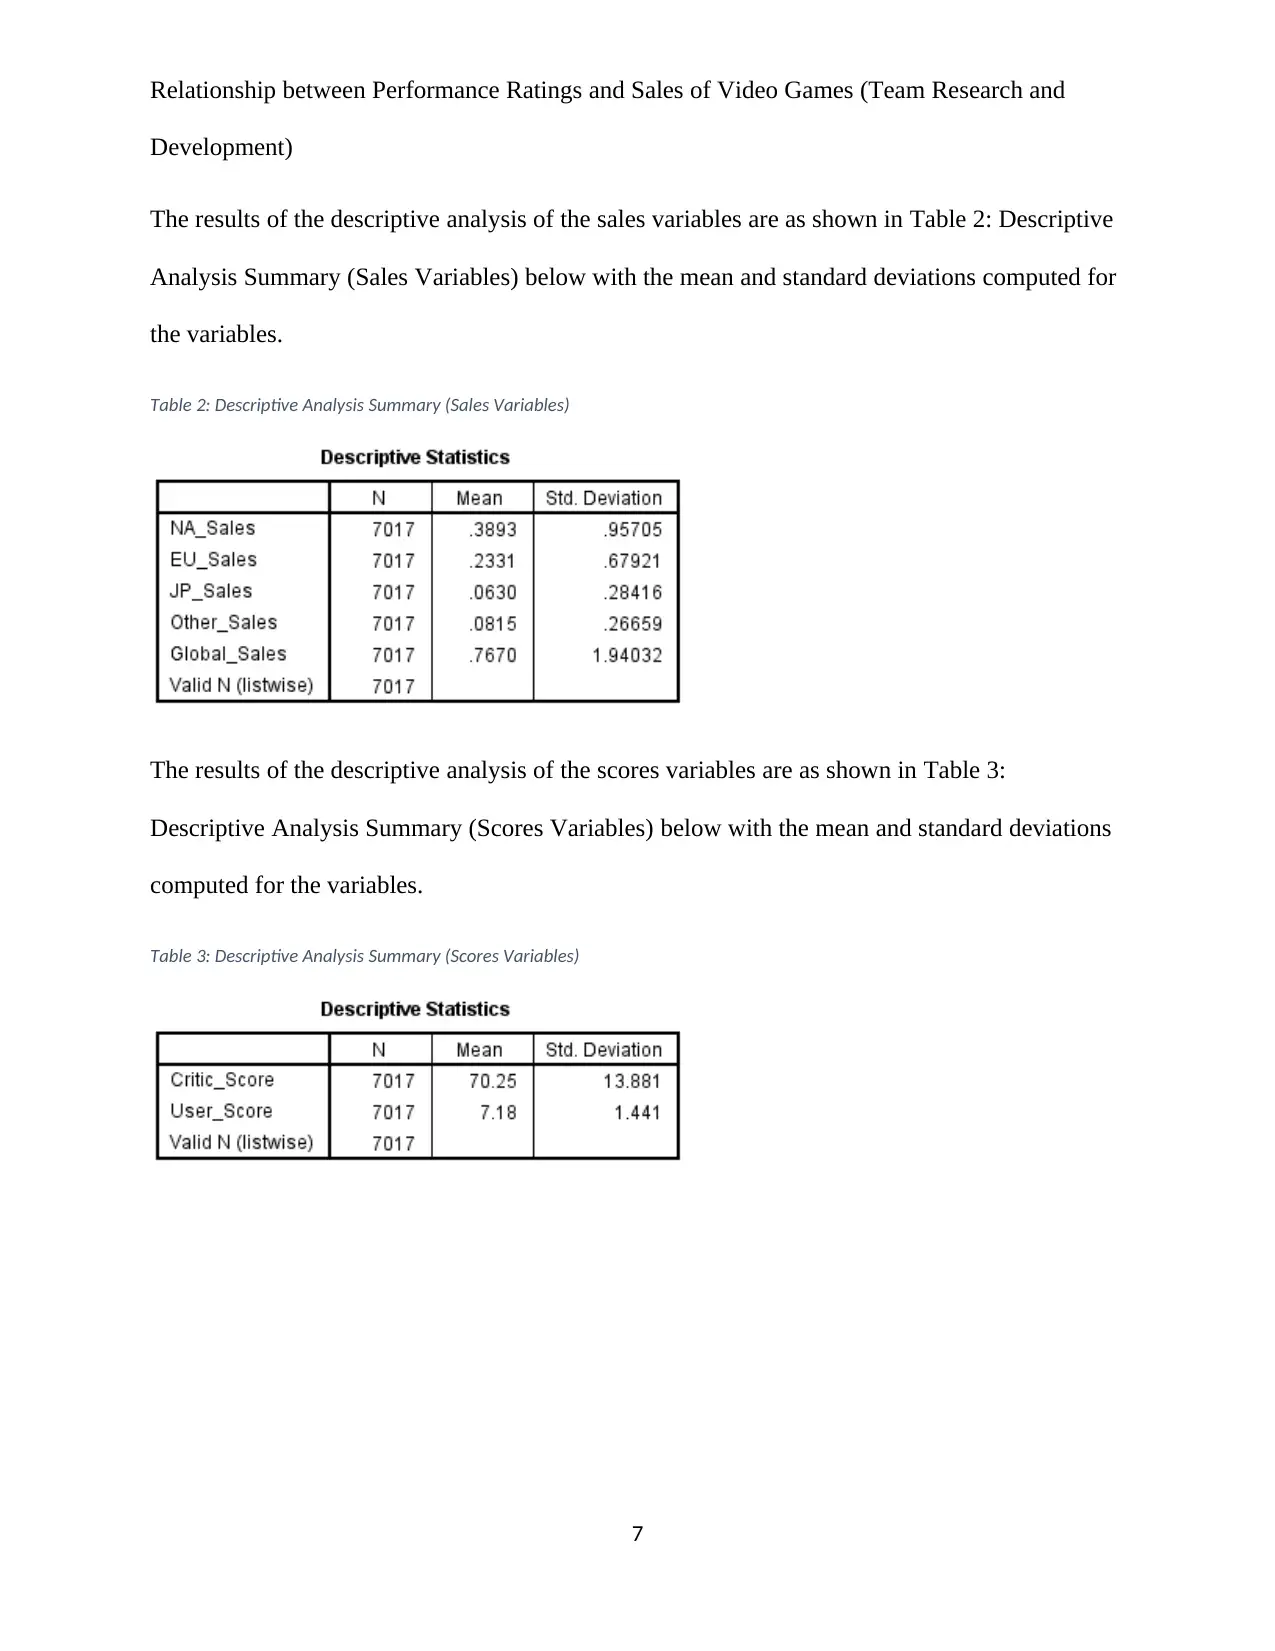
The results of the descriptive analysis of the sales variables are as shown in Table 2: Descriptive
Analysis Summary (Sales Variables) below with the mean and standard deviations computed for
the variables.
Table 2: Descriptive Analysis Summary (Sales Variables)
The results of the descriptive analysis of the scores variables are as shown in Table 3:
Descriptive Analysis Summary (Scores Variables) below with the mean and standard deviations
computed for the variables.
Table 3: Descriptive Analysis Summary (Scores Variables)
7
Development)
The results of the descriptive analysis of the sales variables are as shown in Table 2: Descriptive
Analysis Summary (Sales Variables) below with the mean and standard deviations computed for
the variables.
Table 2: Descriptive Analysis Summary (Sales Variables)
The results of the descriptive analysis of the scores variables are as shown in Table 3:
Descriptive Analysis Summary (Scores Variables) below with the mean and standard deviations
computed for the variables.
Table 3: Descriptive Analysis Summary (Scores Variables)
7
Paraphrase This Document
Need a fresh take? Get an instant paraphrase of this document with our AI Paraphraser
Relationship between Performance Ratings and Sales of Video Games (Team Research and
Development)
Inferential Statistics
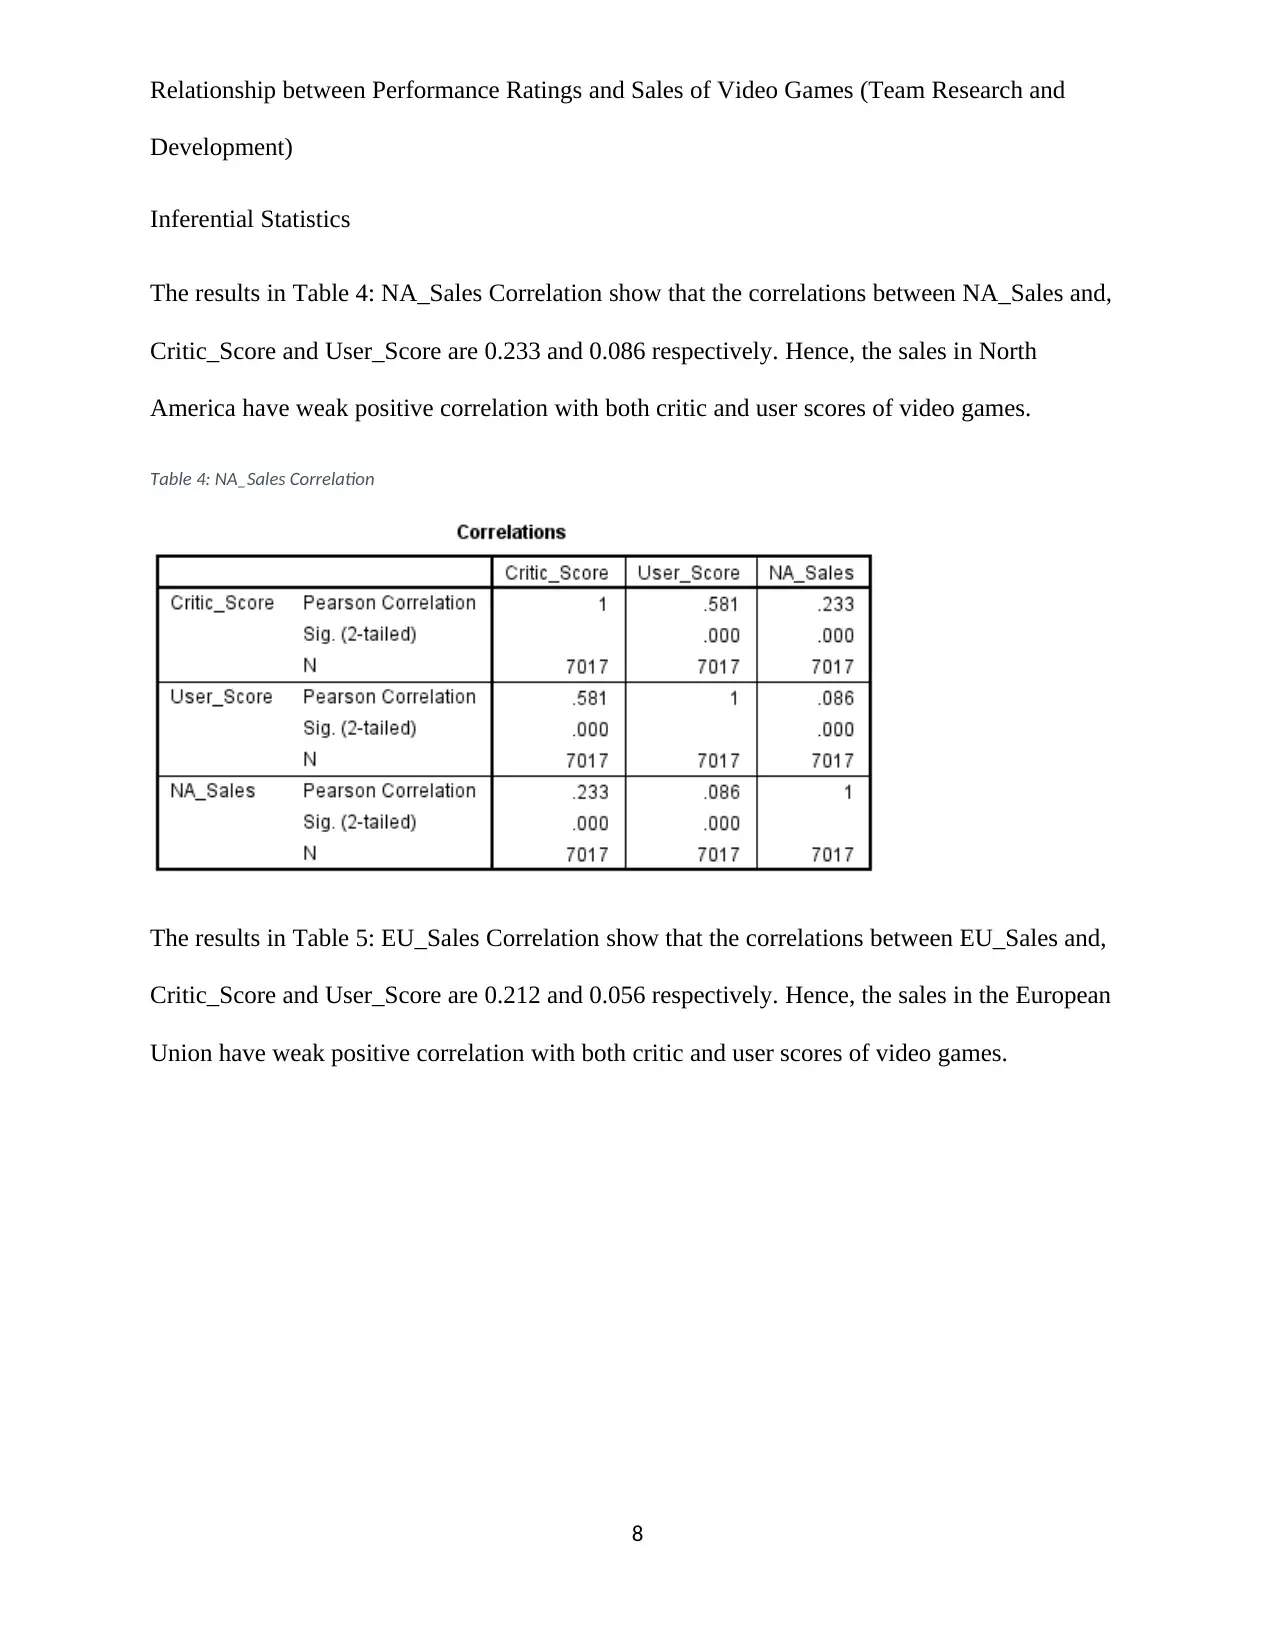
The results in Table 4: NA_Sales Correlation show that the correlations between NA_Sales and,
Critic_Score and User_Score are 0.233 and 0.086 respectively. Hence, the sales in North
America have weak positive correlation with both critic and user scores of video games.
Table 4: NA_Sales Correlation
The results in Table 5: EU_Sales Correlation show that the correlations between EU_Sales and,
Critic_Score and User_Score are 0.212 and 0.056 respectively. Hence, the sales in the European
Union have weak positive correlation with both critic and user scores of video games.
8
Development)
Inferential Statistics
The results in Table 4: NA_Sales Correlation show that the correlations between NA_Sales and,
Critic_Score and User_Score are 0.233 and 0.086 respectively. Hence, the sales in North
America have weak positive correlation with both critic and user scores of video games.
Table 4: NA_Sales Correlation
The results in Table 5: EU_Sales Correlation show that the correlations between EU_Sales and,
Critic_Score and User_Score are 0.212 and 0.056 respectively. Hence, the sales in the European
Union have weak positive correlation with both critic and user scores of video games.
8
Relationship between Performance Ratings and Sales of Video Games (Team Research and
Development)
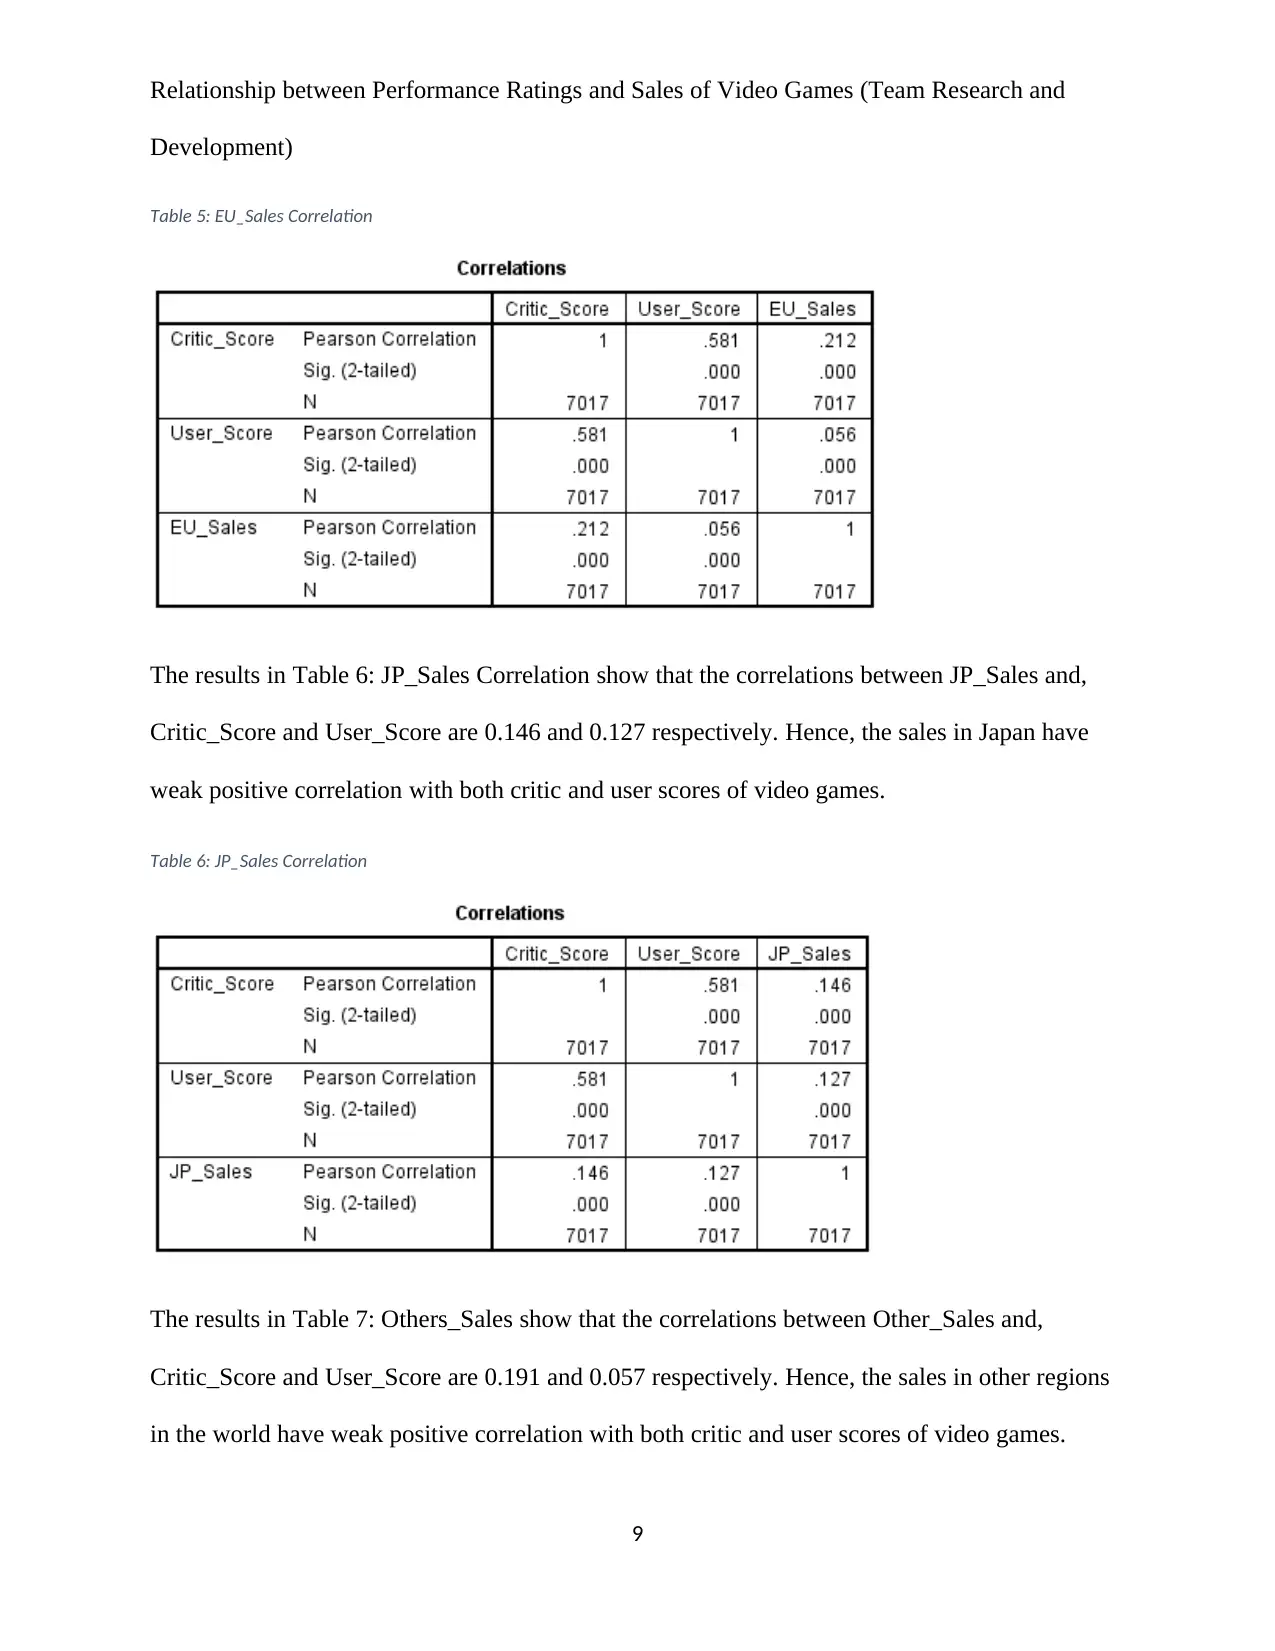
Table 5: EU_Sales Correlation
The results in Table 6: JP_Sales Correlation show that the correlations between JP_Sales and,
Critic_Score and User_Score are 0.146 and 0.127 respectively. Hence, the sales in Japan have
weak positive correlation with both critic and user scores of video games.
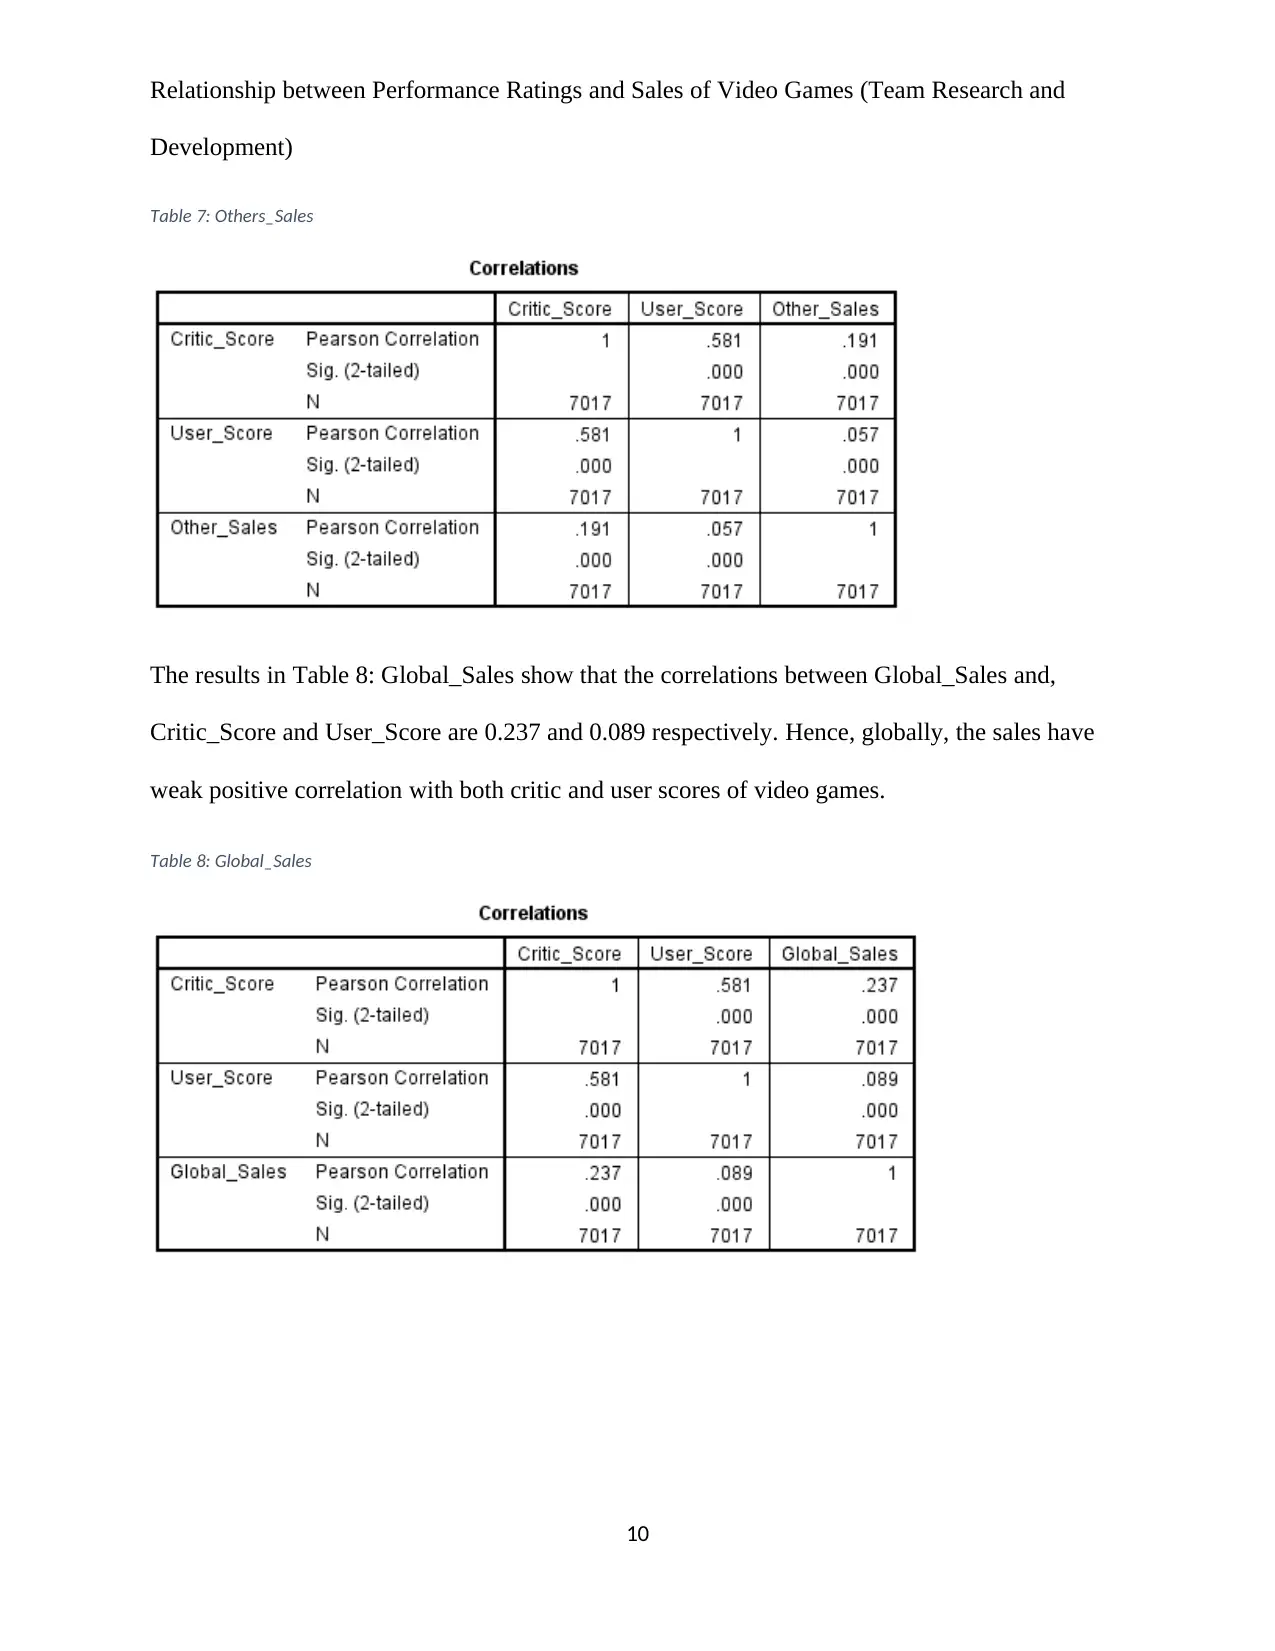
Table 6: JP_Sales Correlation
The results in Table 7: Others_Sales show that the correlations between Other_Sales and,
Critic_Score and User_Score are 0.191 and 0.057 respectively. Hence, the sales in other regions
in the world have weak positive correlation with both critic and user scores of video games.
9
Development)
Table 5: EU_Sales Correlation
The results in Table 6: JP_Sales Correlation show that the correlations between JP_Sales and,
Critic_Score and User_Score are 0.146 and 0.127 respectively. Hence, the sales in Japan have
weak positive correlation with both critic and user scores of video games.
Table 6: JP_Sales Correlation
The results in Table 7: Others_Sales show that the correlations between Other_Sales and,
Critic_Score and User_Score are 0.191 and 0.057 respectively. Hence, the sales in other regions
in the world have weak positive correlation with both critic and user scores of video games.
9
⊘ This is a preview!⊘
Do you want full access?
Subscribe today to unlock all pages.
Trusted by 1+ million students worldwide
Relationship between Performance Ratings and Sales of Video Games (Team Research and
Development)
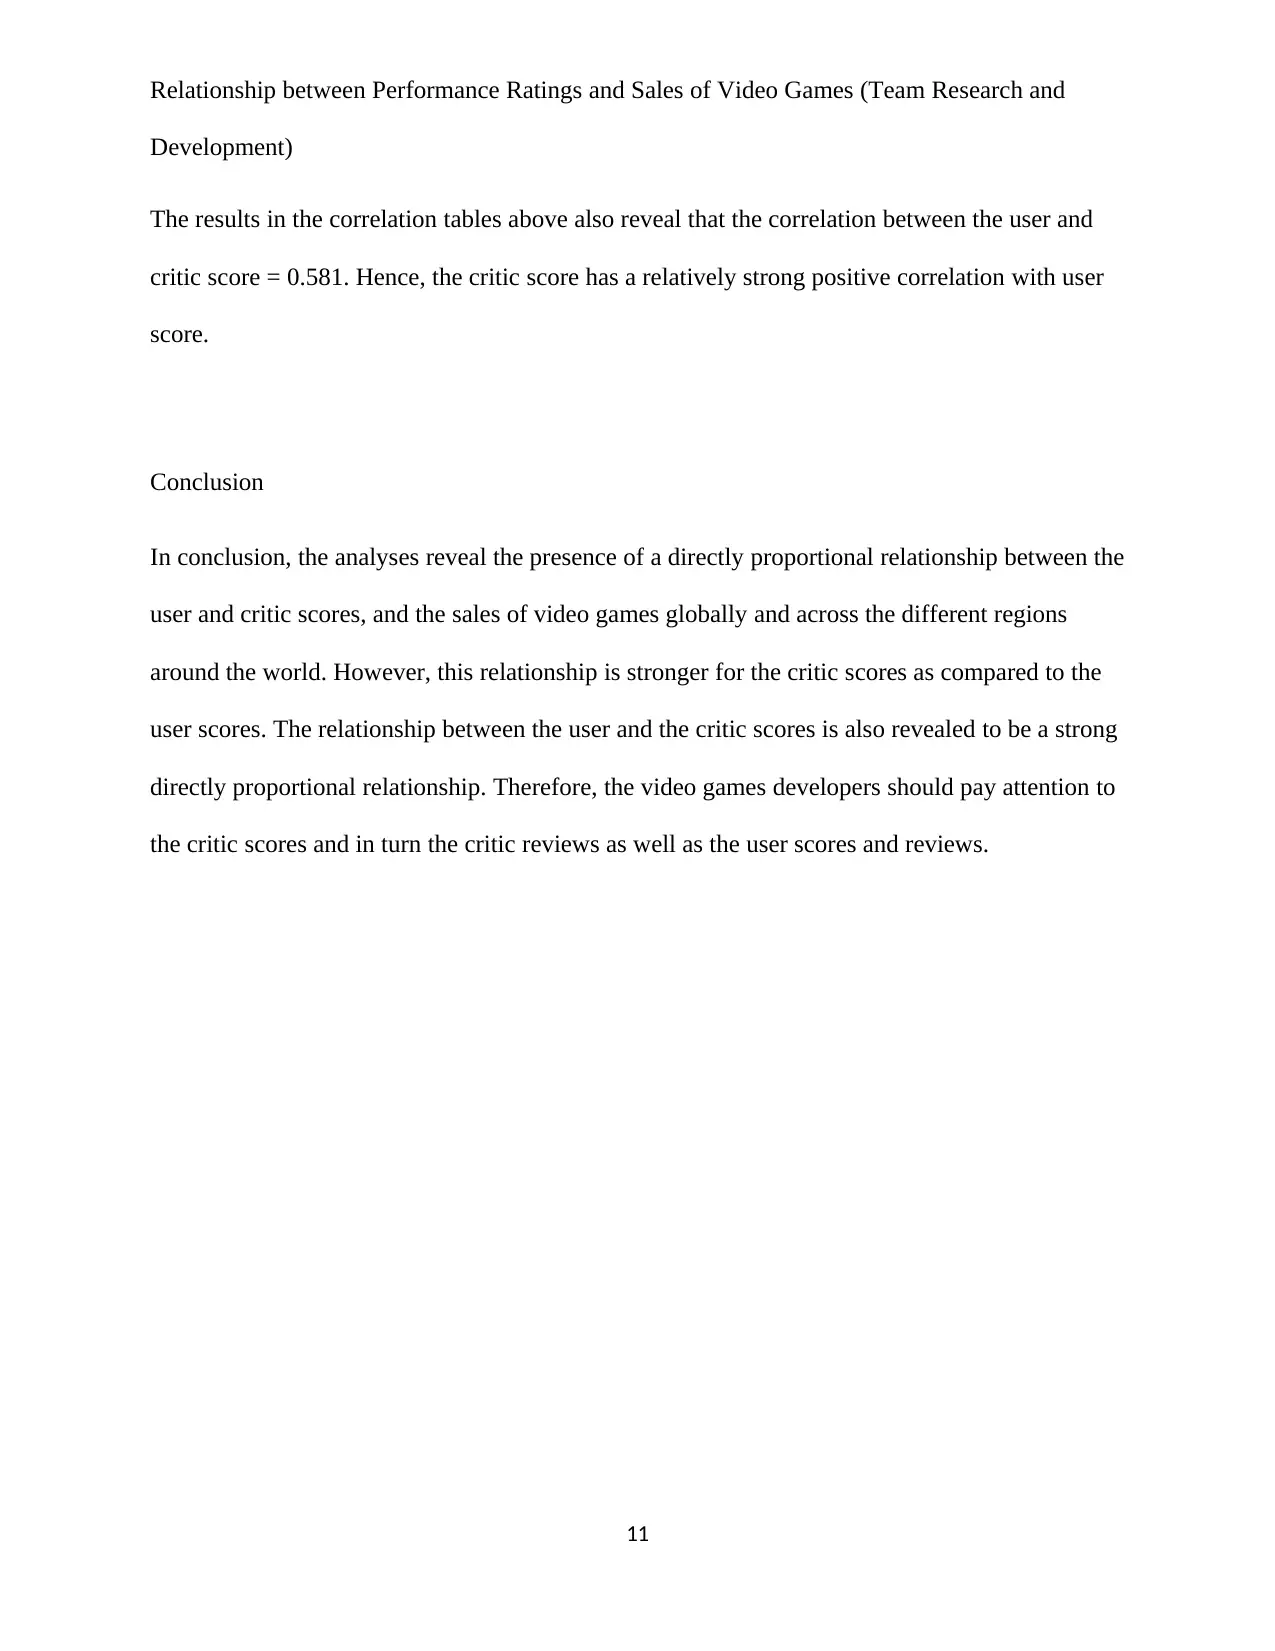
Table 7: Others_Sales
The results in Table 8: Global_Sales show that the correlations between Global_Sales and,
Critic_Score and User_Score are 0.237 and 0.089 respectively. Hence, globally, the sales have
weak positive correlation with both critic and user scores of video games.
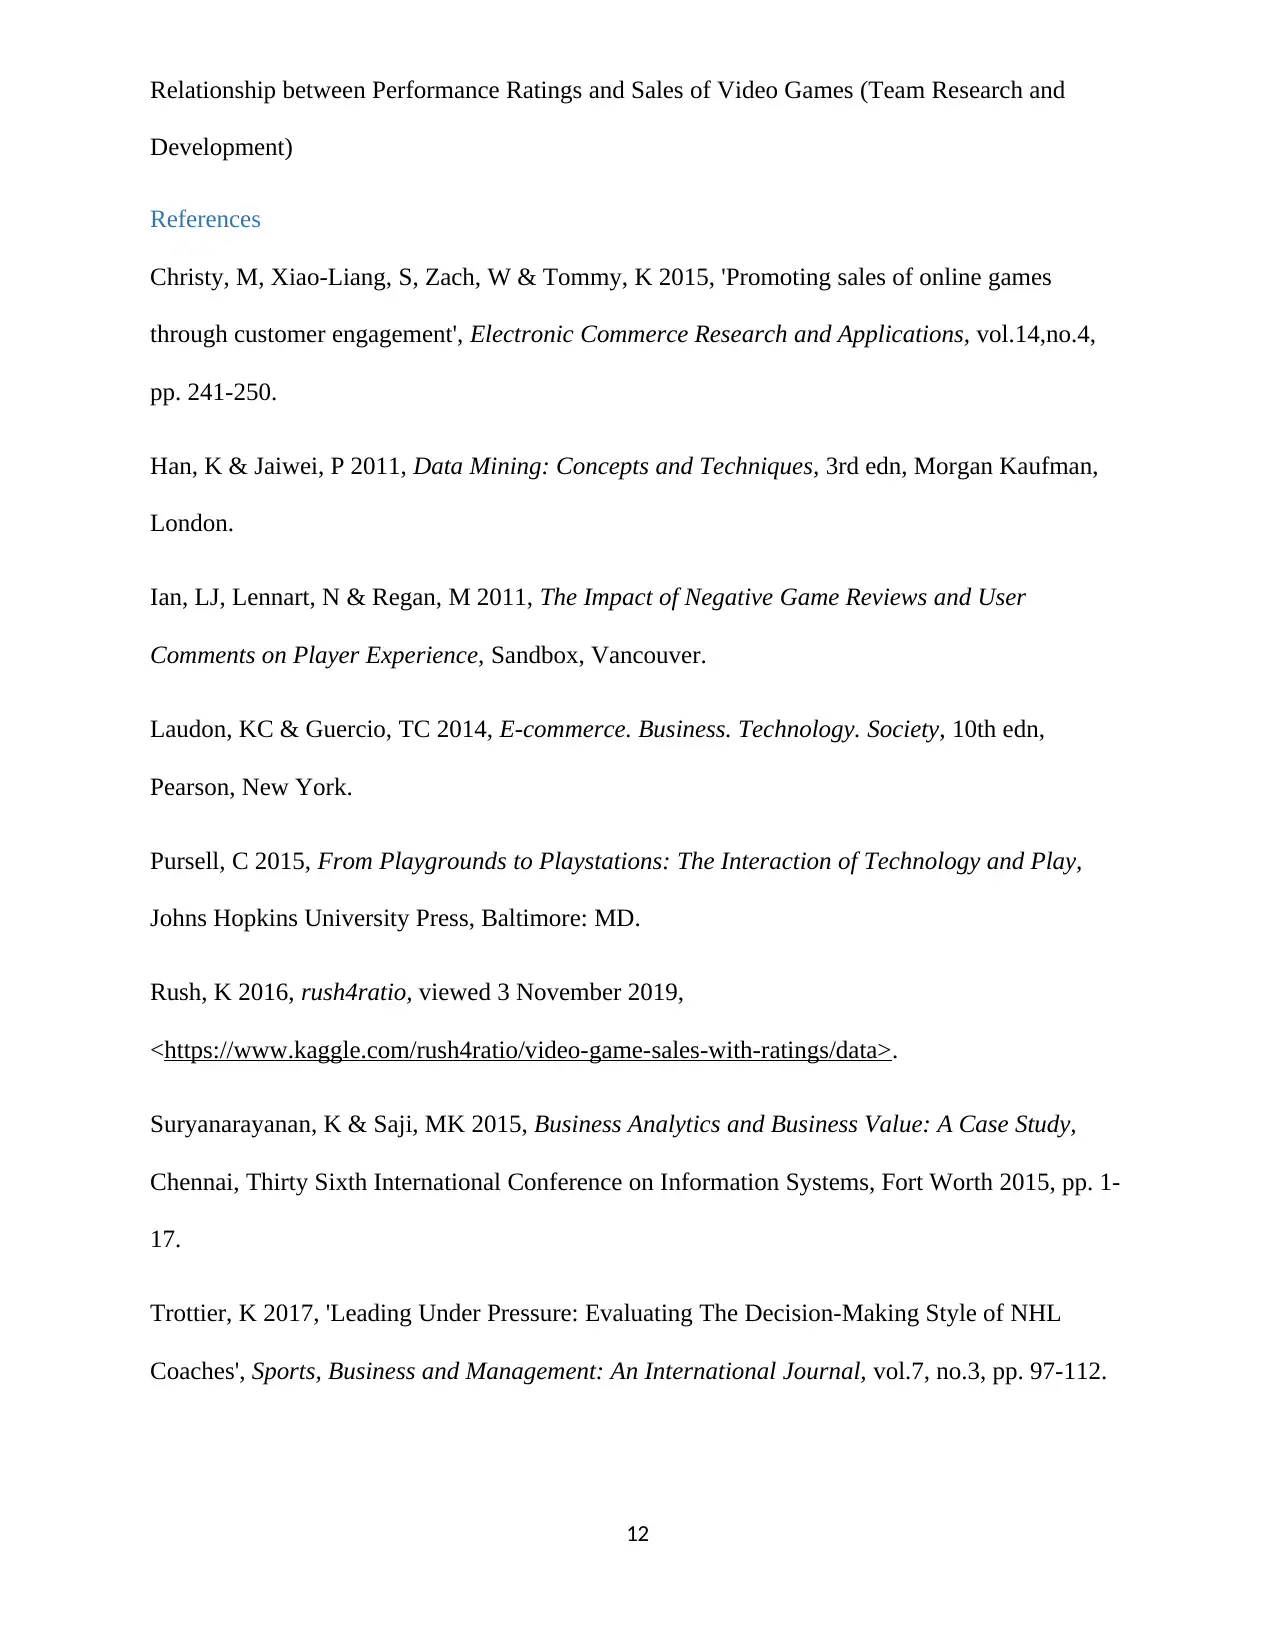
Table 8: Global_Sales
10
Development)
Table 7: Others_Sales
The results in Table 8: Global_Sales show that the correlations between Global_Sales and,
Critic_Score and User_Score are 0.237 and 0.089 respectively. Hence, globally, the sales have
weak positive correlation with both critic and user scores of video games.
Table 8: Global_Sales
10
Paraphrase This Document
Need a fresh take? Get an instant paraphrase of this document with our AI Paraphraser
Relationship between Performance Ratings and Sales of Video Games (Team Research and
Development)
The results in the correlation tables above also reveal that the correlation between the user and
critic score = 0.581. Hence, the critic score has a relatively strong positive correlation with user
score.
Conclusion
In conclusion, the analyses reveal the presence of a directly proportional relationship between the
user and critic scores, and the sales of video games globally and across the different regions
around the world. However, this relationship is stronger for the critic scores as compared to the
user scores. The relationship between the user and the critic scores is also revealed to be a strong
directly proportional relationship. Therefore, the video games developers should pay attention to
the critic scores and in turn the critic reviews as well as the user scores and reviews.
11
Relationship between Performance Ratings and Sales of Video Games (Team Research and
Development)
References
Christy, M, Xiao-Liang, S, Zach, W & Tommy, K 2015, 'Promoting sales of online games
through customer engagement', Electronic Commerce Research and Applications, vol.14,no.4,
pp. 241-250.
Han, K & Jaiwei, P 2011, Data Mining: Concepts and Techniques, 3rd edn, Morgan Kaufman,
London.
Ian, LJ, Lennart, N & Regan, M 2011, The Impact of Negative Game Reviews and User
Comments on Player Experience, Sandbox, Vancouver.
Laudon, KC & Guercio, TC 2014, E-commerce. Business. Technology. Society, 10th edn,
Pearson, New York.
Pursell, C 2015, From Playgrounds to Playstations: The Interaction of Technology and Play,
Johns Hopkins University Press, Baltimore: MD.
Rush, K 2016, rush4ratio, viewed 3 November 2019,
<https://www.kaggle.com/rush4ratio/video-game-sales-with-ratings/data>.
Suryanarayanan, K & Saji, MK 2015, Business Analytics and Business Value: A Case Study,
Chennai, Thirty Sixth International Conference on Information Systems, Fort Worth 2015, pp. 1-
17.
Trottier, K 2017, 'Leading Under Pressure: Evaluating The Decision-Making Style of NHL
Coaches', Sports, Business and Management: An International Journal, vol.7, no.3, pp. 97-112.
12
⊘ This is a preview!⊘
Do you want full access?
Subscribe today to unlock all pages.
Trusted by 1+ million students worldwide
1 out of 13

Your All-in-One AI-Powered Toolkit for Academic Success.
+13062052269
info@desklib.com
Available 24*7 on WhatsApp / Email
![[object Object]](/_next/static/media/star-bottom.7253800d.svg)
Unlock your academic potential
Copyright © 2020–2026 A2Z Services. All Rights Reserved. Developed and managed by ZUCOL.