Analysis of Magic Quadrant for Analytics and BI Platforms Report
VerifiedAdded on 2022/12/15
|10
|2030
|274
Report
AI Summary
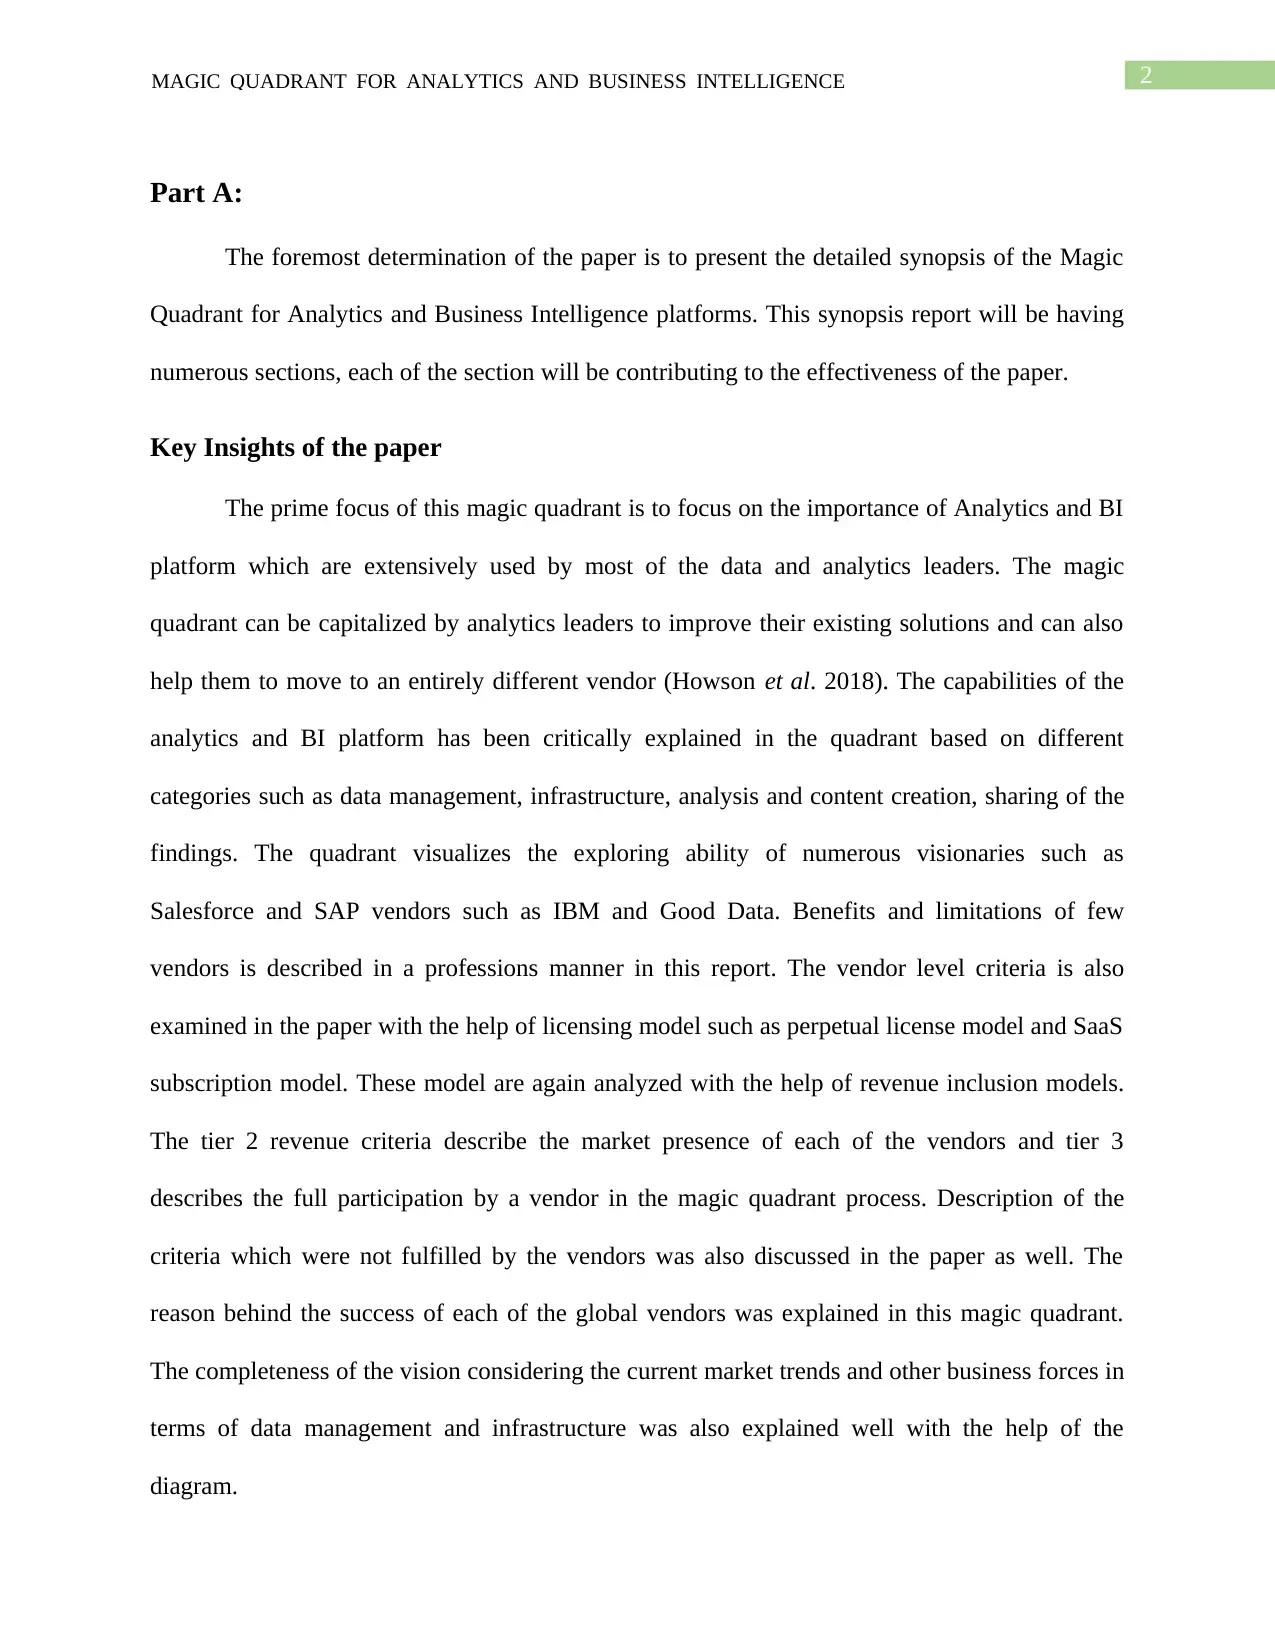
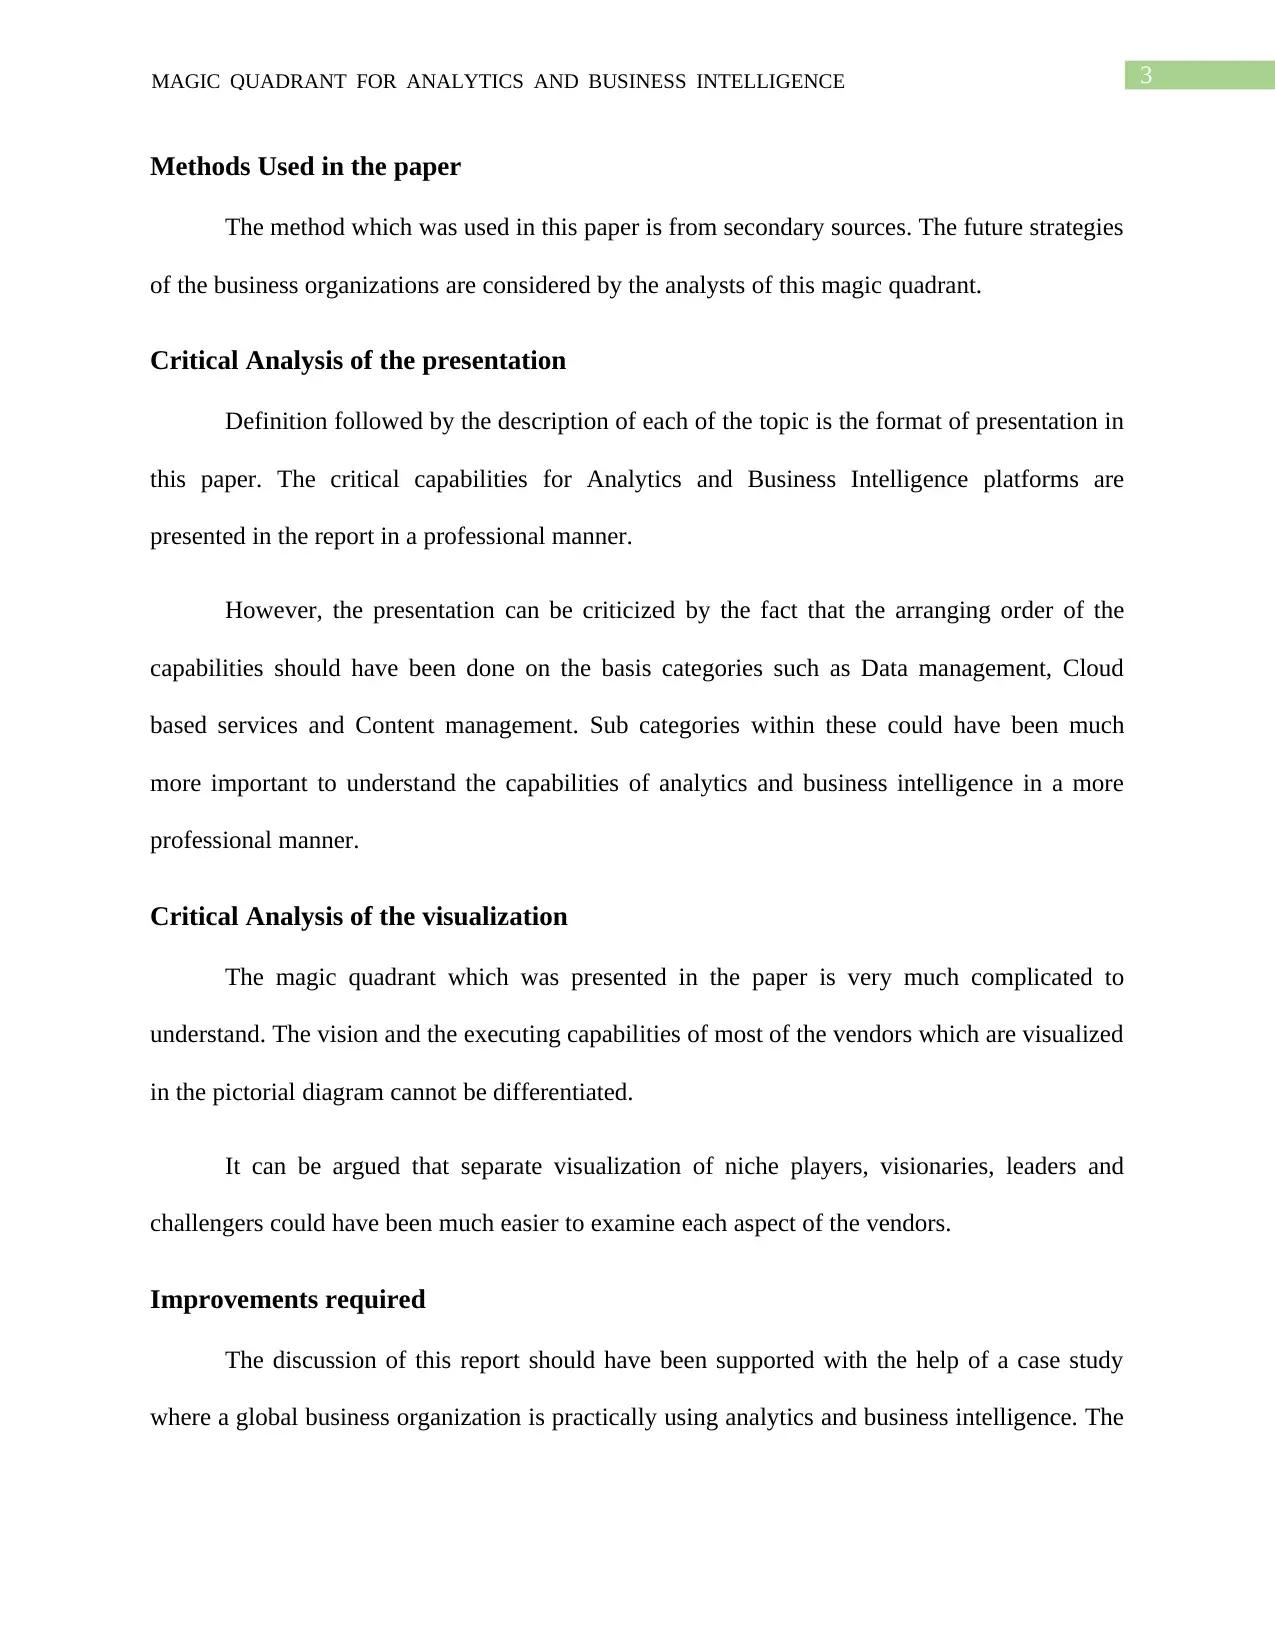
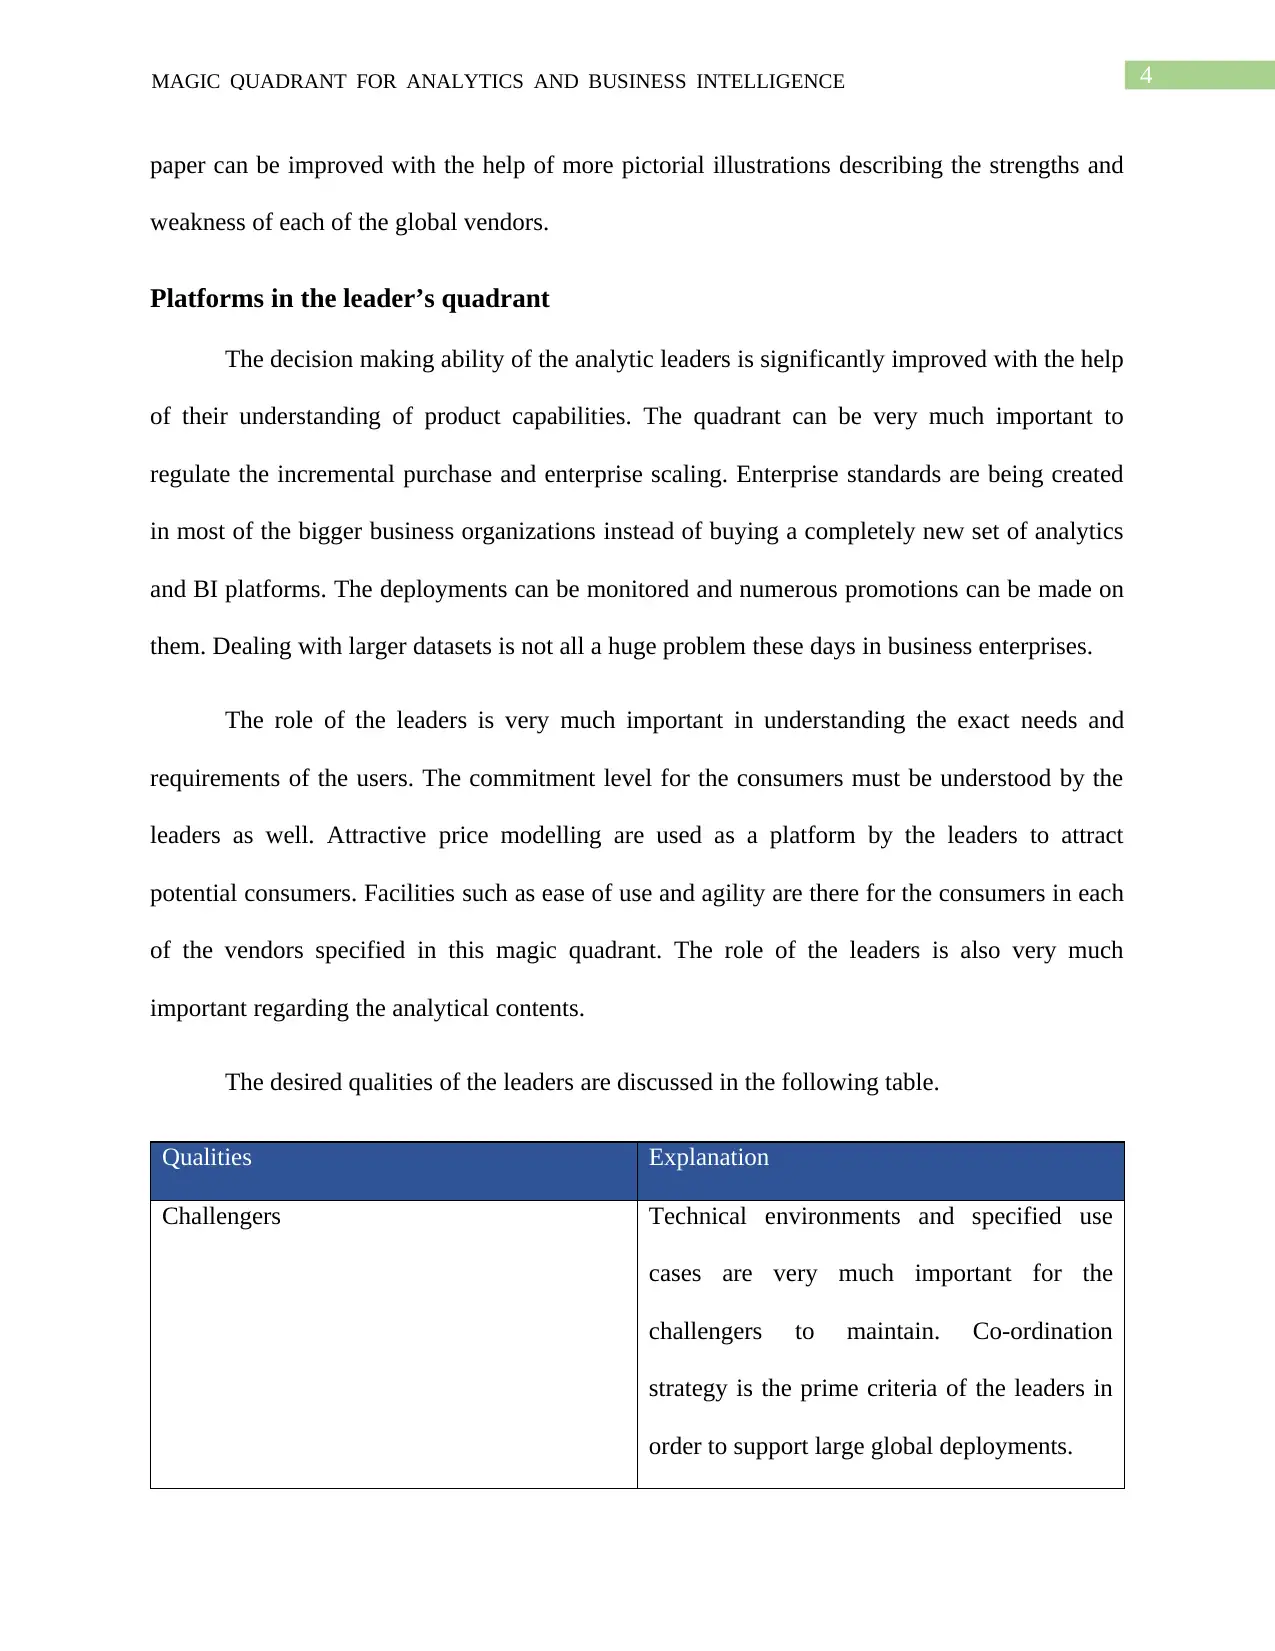
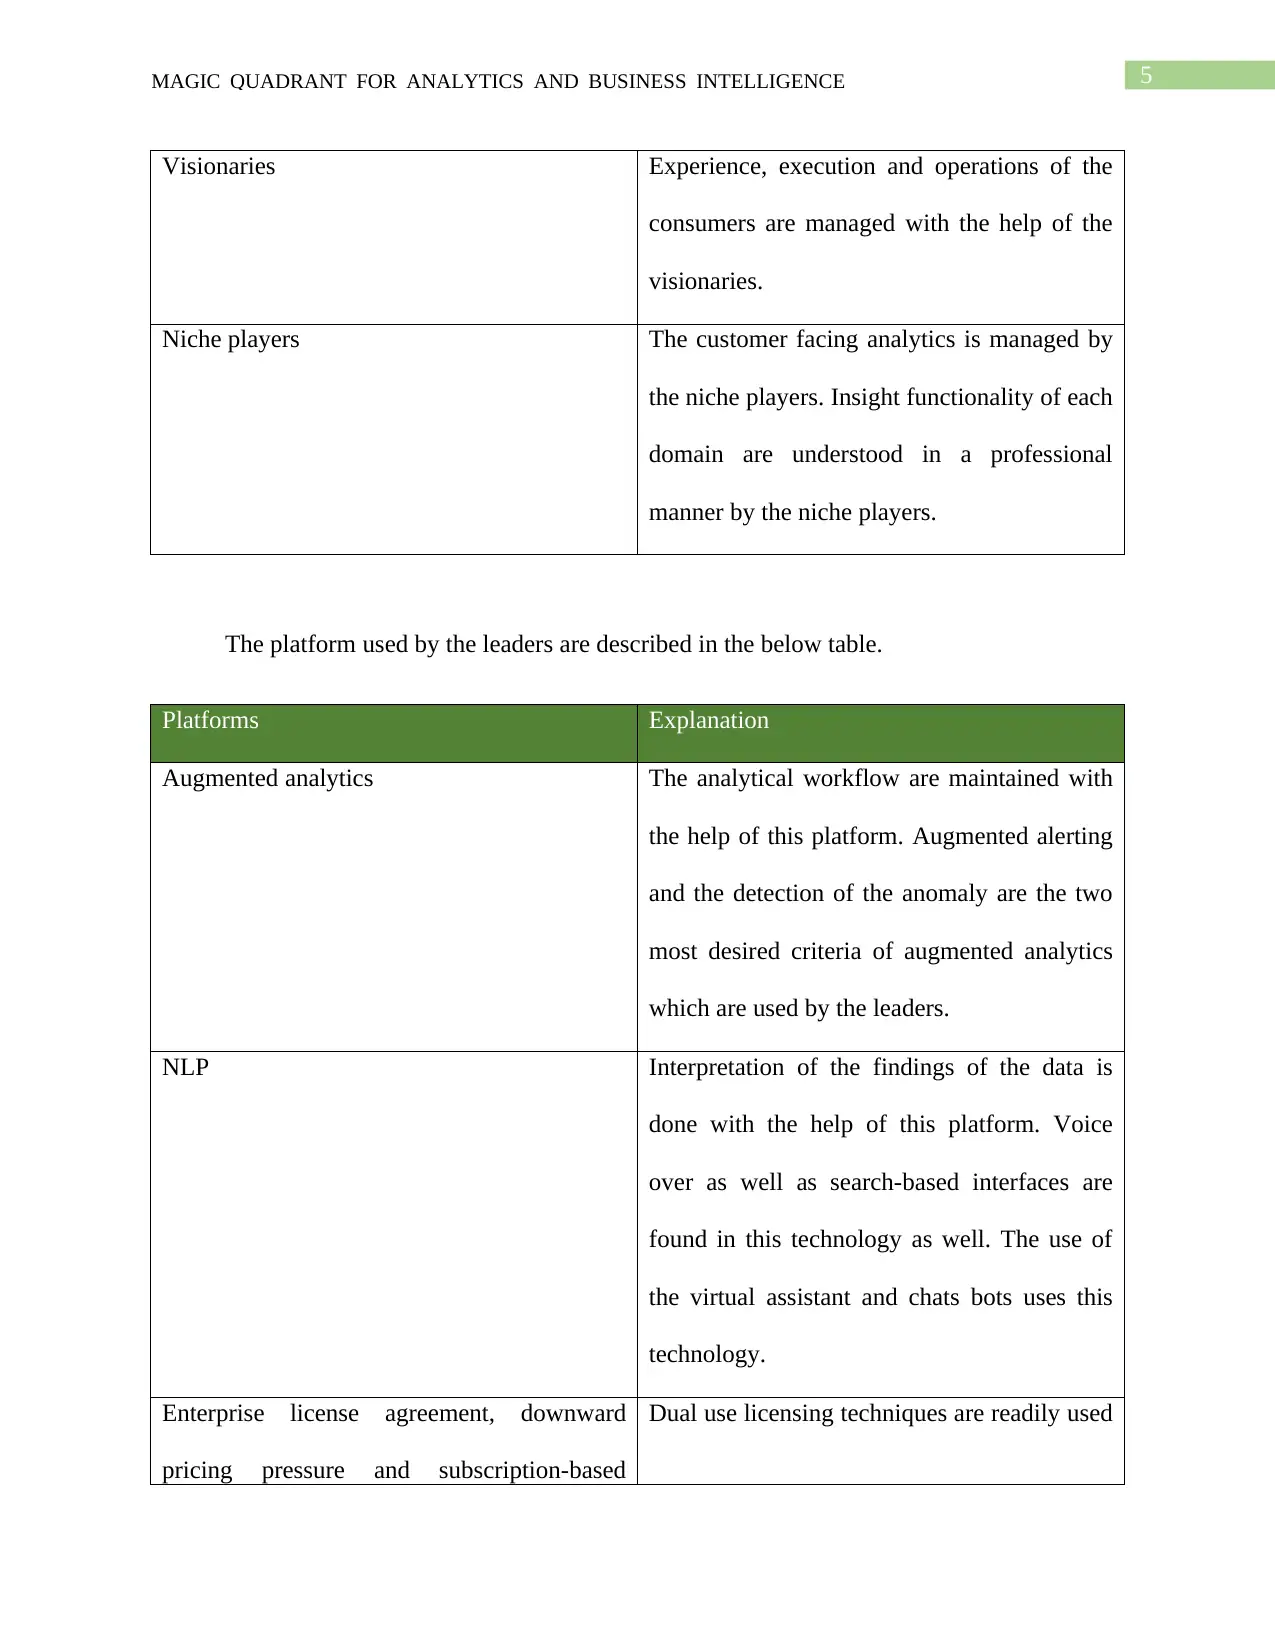
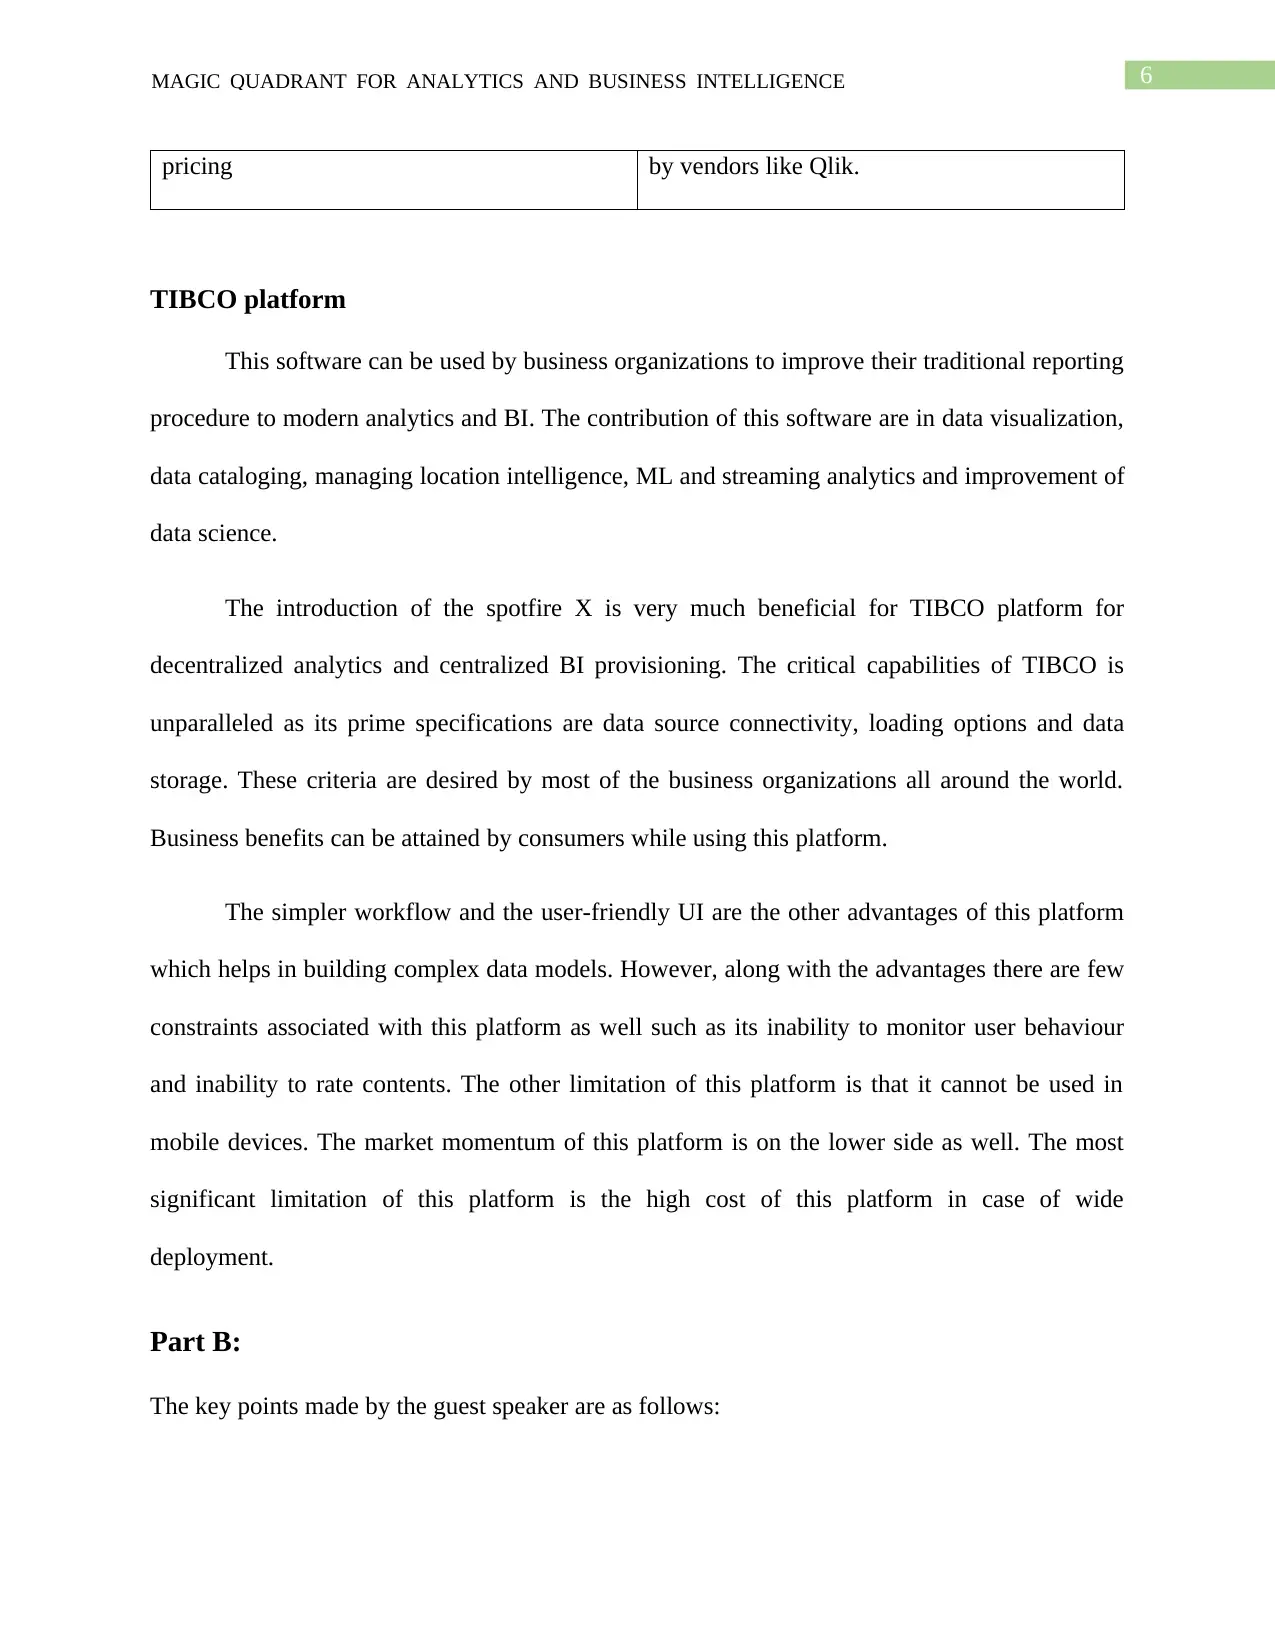
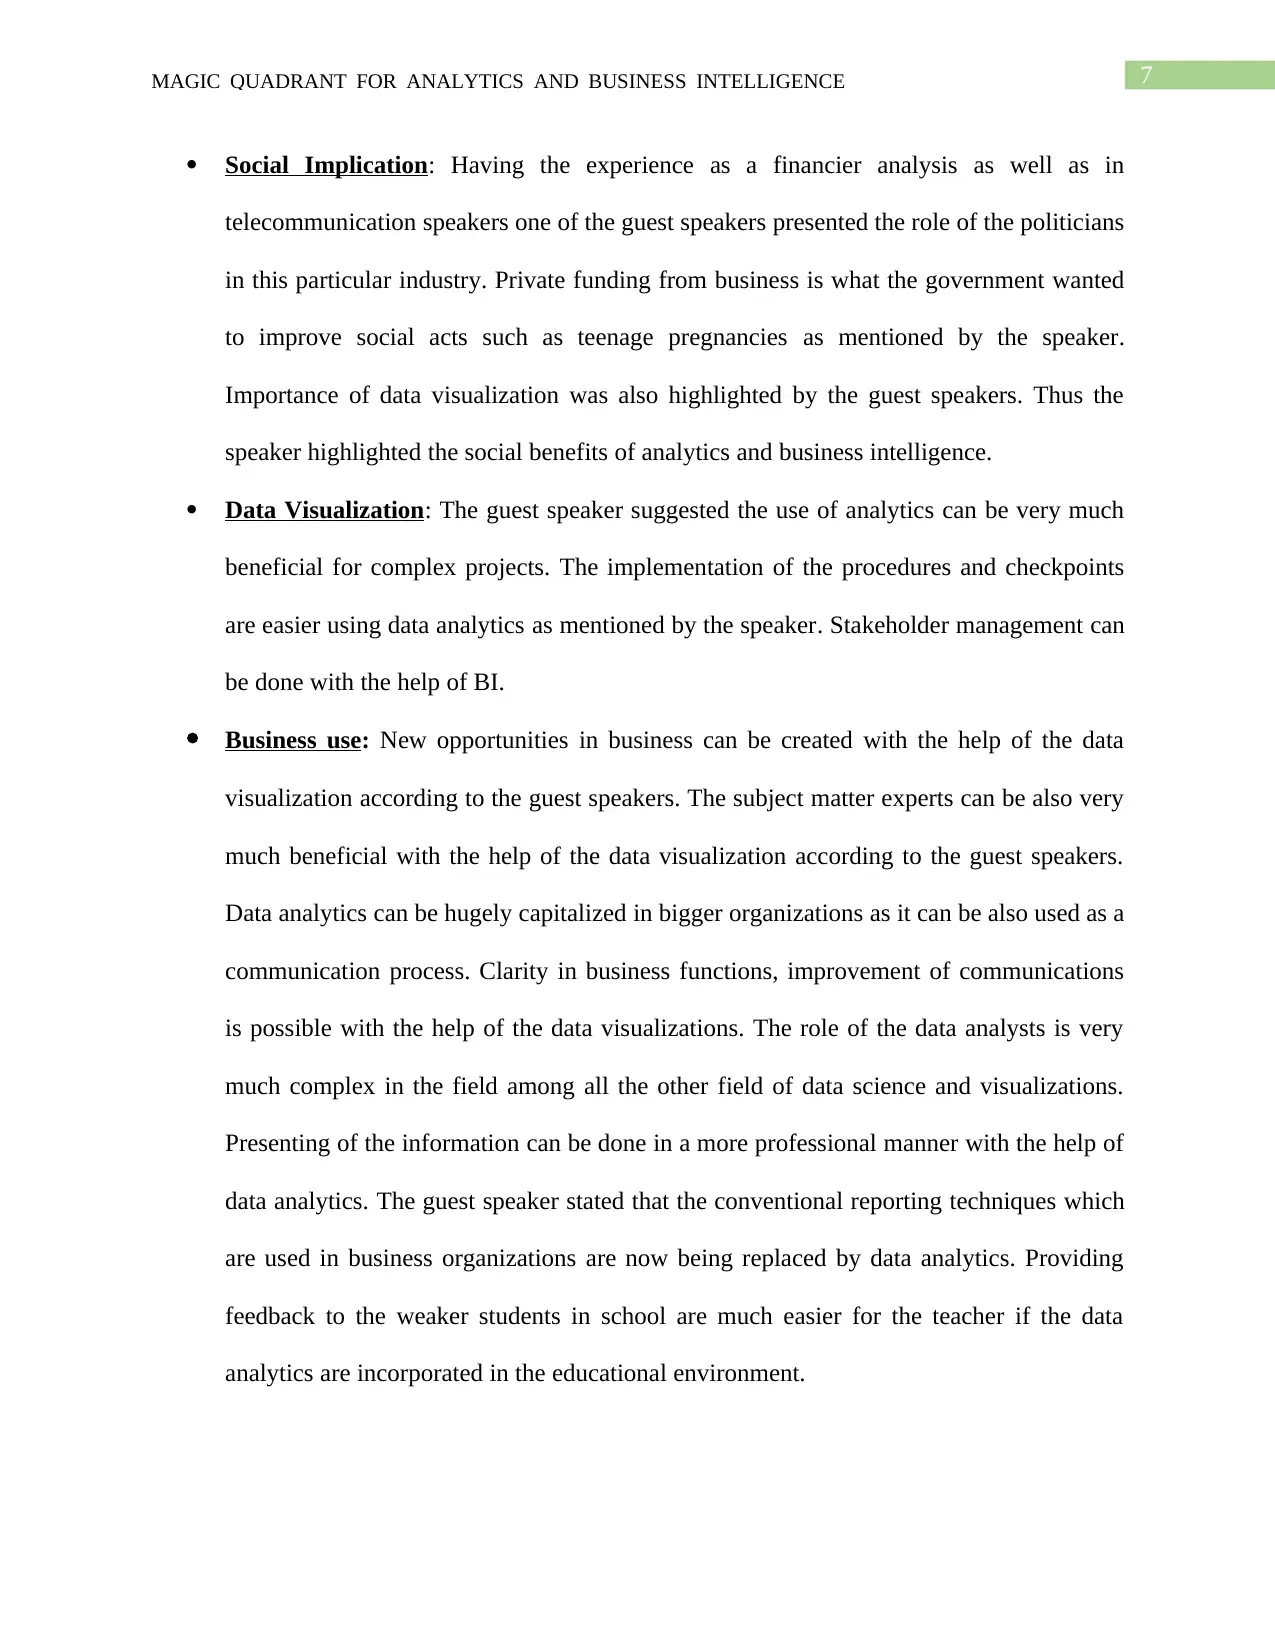
This report presents an analysis of the Magic Quadrant for Analytics and Business Intelligence platforms, focusing on key insights, methods used, and critical evaluations of the presentation and visualization. The report examines platforms in the leader's quadrant, including a detailed look at TIBCO. It also includes a discussion of the benefits and limitations of various vendors, along with an analysis of vendor-level criteria. The report explores the significance of analytics and BI platforms, their capabilities, and the methods used in the analysis. It also critiques the presentation and visualization of the magic quadrant, offering suggestions for improvements. Furthermore, the report highlights the qualities of leaders, platforms used, and discusses the guest speaker's key points on social implications, data visualization, business use, software development, and ethical considerations. The report provides a comprehensive overview of the analytics and business intelligence landscape, offering valuable insights for understanding market trends and vendor performance. It is contributed by a student and is available on Desklib for students to aid their studies.

Running head: MAGIC QUADRANT FOR ANALYTICS AND BUSINESS INTELLIGENCE PLATFORMS
Magic Quadrant for Analytics and Business Intelligence Platforms
Name of the Student
Name of the University
Author Note:
Magic Quadrant for Analytics and Business Intelligence Platforms
Name of the Student
Name of the University
Author Note:
Paraphrase This Document
Need a fresh take? Get an instant paraphrase of this document with our AI Paraphraser

1MAGIC QUADRANT FOR ANALYTICS AND BUSINESS INTELLIGENCE
Table of Contents
Part A:..............................................................................................................................................2
Key Insights of the paper.............................................................................................................2
Methods Used in the paper..........................................................................................................3
Critical Analysis of the presentation............................................................................................3
Critical Analysis of the visualization...........................................................................................3
Improvements required................................................................................................................3
Platforms in the leader’s quadrant...............................................................................................4
TIBCO platform...........................................................................................................................6
Part B:..............................................................................................................................................6
Reference.........................................................................................................................................9

2MAGIC QUADRANT FOR ANALYTICS AND BUSINESS INTELLIGENCE
Part A:
The foremost determination of the paper is to present the detailed synopsis of the Magic
Quadrant for Analytics and Business Intelligence platforms. This synopsis report will be having
numerous sections, each of the section will be contributing to the effectiveness of the paper.
Key Insights of the paper
The prime focus of this magic quadrant is to focus on the importance of Analytics and BI
platform which are extensively used by most of the data and analytics leaders. The magic
quadrant can be capitalized by analytics leaders to improve their existing solutions and can also
help them to move to an entirely different vendor (Howson et al. 2018). The capabilities of the
analytics and BI platform has been critically explained in the quadrant based on different
categories such as data management, infrastructure, analysis and content creation, sharing of the
findings. The quadrant visualizes the exploring ability of numerous visionaries such as
Salesforce and SAP vendors such as IBM and Good Data. Benefits and limitations of few
vendors is described in a professions manner in this report. The vendor level criteria is also
examined in the paper with the help of licensing model such as perpetual license model and SaaS
subscription model. These model are again analyzed with the help of revenue inclusion models.
The tier 2 revenue criteria describe the market presence of each of the vendors and tier 3
describes the full participation by a vendor in the magic quadrant process. Description of the
criteria which were not fulfilled by the vendors was also discussed in the paper as well. The
reason behind the success of each of the global vendors was explained in this magic quadrant.
The completeness of the vision considering the current market trends and other business forces in
terms of data management and infrastructure was also explained well with the help of the
diagram.
⊘ This is a preview!⊘
Do you want full access?
Subscribe today to unlock all pages.

Trusted by 1+ million students worldwide

3MAGIC QUADRANT FOR ANALYTICS AND BUSINESS INTELLIGENCE
Methods Used in the paper
The method which was used in this paper is from secondary sources. The future strategies
of the business organizations are considered by the analysts of this magic quadrant.
Critical Analysis of the presentation
Definition followed by the description of each of the topic is the format of presentation in
this paper. The critical capabilities for Analytics and Business Intelligence platforms are
presented in the report in a professional manner.
However, the presentation can be criticized by the fact that the arranging order of the
capabilities should have been done on the basis categories such as Data management, Cloud
based services and Content management. Sub categories within these could have been much
more important to understand the capabilities of analytics and business intelligence in a more
professional manner.
Critical Analysis of the visualization
The magic quadrant which was presented in the paper is very much complicated to
understand. The vision and the executing capabilities of most of the vendors which are visualized
in the pictorial diagram cannot be differentiated.
It can be argued that separate visualization of niche players, visionaries, leaders and
challengers could have been much easier to examine each aspect of the vendors.
Improvements required
The discussion of this report should have been supported with the help of a case study
where a global business organization is practically using analytics and business intelligence. The
Paraphrase This Document
Need a fresh take? Get an instant paraphrase of this document with our AI Paraphraser

4MAGIC QUADRANT FOR ANALYTICS AND BUSINESS INTELLIGENCE
paper can be improved with the help of more pictorial illustrations describing the strengths and
weakness of each of the global vendors.
Platforms in the leader’s quadrant
The decision making ability of the analytic leaders is significantly improved with the help
of their understanding of product capabilities. The quadrant can be very much important to
regulate the incremental purchase and enterprise scaling. Enterprise standards are being created
in most of the bigger business organizations instead of buying a completely new set of analytics
and BI platforms. The deployments can be monitored and numerous promotions can be made on
them. Dealing with larger datasets is not all a huge problem these days in business enterprises.
The role of the leaders is very much important in understanding the exact needs and
requirements of the users. The commitment level for the consumers must be understood by the
leaders as well. Attractive price modelling are used as a platform by the leaders to attract
potential consumers. Facilities such as ease of use and agility are there for the consumers in each
of the vendors specified in this magic quadrant. The role of the leaders is also very much
important regarding the analytical contents.
The desired qualities of the leaders are discussed in the following table.
Qualities Explanation
Challengers Technical environments and specified use
cases are very much important for the
challengers to maintain. Co-ordination
strategy is the prime criteria of the leaders in
order to support large global deployments.

5MAGIC QUADRANT FOR ANALYTICS AND BUSINESS INTELLIGENCE
Visionaries Experience, execution and operations of the
consumers are managed with the help of the
visionaries.
Niche players The customer facing analytics is managed by
the niche players. Insight functionality of each
domain are understood in a professional
manner by the niche players.
The platform used by the leaders are described in the below table.
Platforms Explanation
Augmented analytics The analytical workflow are maintained with
the help of this platform. Augmented alerting
and the detection of the anomaly are the two
most desired criteria of augmented analytics
which are used by the leaders.
NLP Interpretation of the findings of the data is
done with the help of this platform. Voice
over as well as search-based interfaces are
found in this technology as well. The use of
the virtual assistant and chats bots uses this
technology.
Enterprise license agreement, downward
pricing pressure and subscription-based
Dual use licensing techniques are readily used
⊘ This is a preview!⊘
Do you want full access?
Subscribe today to unlock all pages.

Trusted by 1+ million students worldwide

6MAGIC QUADRANT FOR ANALYTICS AND BUSINESS INTELLIGENCE
pricing by vendors like Qlik.
TIBCO platform
This software can be used by business organizations to improve their traditional reporting
procedure to modern analytics and BI. The contribution of this software are in data visualization,
data cataloging, managing location intelligence, ML and streaming analytics and improvement of
data science.
The introduction of the spotfire X is very much beneficial for TIBCO platform for
decentralized analytics and centralized BI provisioning. The critical capabilities of TIBCO is
unparalleled as its prime specifications are data source connectivity, loading options and data
storage. These criteria are desired by most of the business organizations all around the world.
Business benefits can be attained by consumers while using this platform.
The simpler workflow and the user-friendly UI are the other advantages of this platform
which helps in building complex data models. However, along with the advantages there are few
constraints associated with this platform as well such as its inability to monitor user behaviour
and inability to rate contents. The other limitation of this platform is that it cannot be used in
mobile devices. The market momentum of this platform is on the lower side as well. The most
significant limitation of this platform is the high cost of this platform in case of wide
deployment.
Part B:
The key points made by the guest speaker are as follows:
Paraphrase This Document
Need a fresh take? Get an instant paraphrase of this document with our AI Paraphraser

7MAGIC QUADRANT FOR ANALYTICS AND BUSINESS INTELLIGENCE
Social Implication: Having the experience as a financier analysis as well as in
telecommunication speakers one of the guest speakers presented the role of the politicians
in this particular industry. Private funding from business is what the government wanted
to improve social acts such as teenage pregnancies as mentioned by the speaker.
Importance of data visualization was also highlighted by the guest speakers. Thus the
speaker highlighted the social benefits of analytics and business intelligence.
Data Visualization: The guest speaker suggested the use of analytics can be very much
beneficial for complex projects. The implementation of the procedures and checkpoints
are easier using data analytics as mentioned by the speaker. Stakeholder management can
be done with the help of BI.
Business use: New opportunities in business can be created with the help of the data
visualization according to the guest speakers. The subject matter experts can be also very
much beneficial with the help of the data visualization according to the guest speakers.
Data analytics can be hugely capitalized in bigger organizations as it can be also used as a
communication process. Clarity in business functions, improvement of communications
is possible with the help of the data visualizations. The role of the data analysts is very
much complex in the field among all the other field of data science and visualizations.
Presenting of the information can be done in a more professional manner with the help of
data analytics. The guest speaker stated that the conventional reporting techniques which
are used in business organizations are now being replaced by data analytics. Providing
feedback to the weaker students in school are much easier for the teacher if the data
analytics are incorporated in the educational environment.

8MAGIC QUADRANT FOR ANALYTICS AND BUSINESS INTELLIGENCE
Software Development: The guest speaker suggested that the use of languages such as
Python and PHP can be aligned in a professional manner with the help of data analytics.
The application of technologies such as SQL is a lot easier considering the use of data
analytics. According to the guest researcher the drag and drop facilities, coding in SQL is
optimized with the help of the data analytics. Tableau can be a lot easier to understand if
the concept of data analytics is incorporated into it. The guest speaker stated that data
analytics is a completely new thing which is being executed in few of the global
organizations and there is a huge probability of this technology which can be aligned with
the other technologies.
Ethical considerations: The technologies can be compatible with an automated system
like automated vehicles as mentioned by the speaker. Deep learning and machine
learning in different types of industries are the major applications of data analytics. There
is ethical consideration of data analytics as well in terms of the use of automated trains
and self-driving cars is very much vulnerable for the pedestrians. There can be ethical
issues such as decision making in any category of industry as revealed by the speaker.
There are security and privacy issue associated with the use of data analytics as
mentioned by the speaker. Areas of conflict can be identified with the help of data
analytics. The researcher mentioned that the use of facial recognition in investigations is
based on the concepts of data analytics.
⊘ This is a preview!⊘
Do you want full access?
Subscribe today to unlock all pages.

Trusted by 1+ million students worldwide

9MAGIC QUADRANT FOR ANALYTICS AND BUSINESS INTELLIGENCE
Reference
Howson, C., Sallam, R.L., Richardson, J.L., Tapadinhas, J., Idoine, C.J. and Woodward, A.,
2018. Magic quadrant for analytics and business intelligence platforms. Retrieved Aug, 16,
p.2018.
Reference
Howson, C., Sallam, R.L., Richardson, J.L., Tapadinhas, J., Idoine, C.J. and Woodward, A.,
2018. Magic quadrant for analytics and business intelligence platforms. Retrieved Aug, 16,
p.2018.
1 out of 10
Related Documents
Your All-in-One AI-Powered Toolkit for Academic Success.
+13062052269
info@desklib.com
Available 24*7 on WhatsApp / Email
Unlock your academic potential
Copyright © 2020–2025 A2Z Services. All Rights Reserved. Developed and managed by ZUCOL.


