Capital Budgeting: Cost of Equity, NPV, IRR, and MIRR Solutions

Verified

Added on  2022/09/06

|9
|1291
|22
Homework Assignment
AI Summary
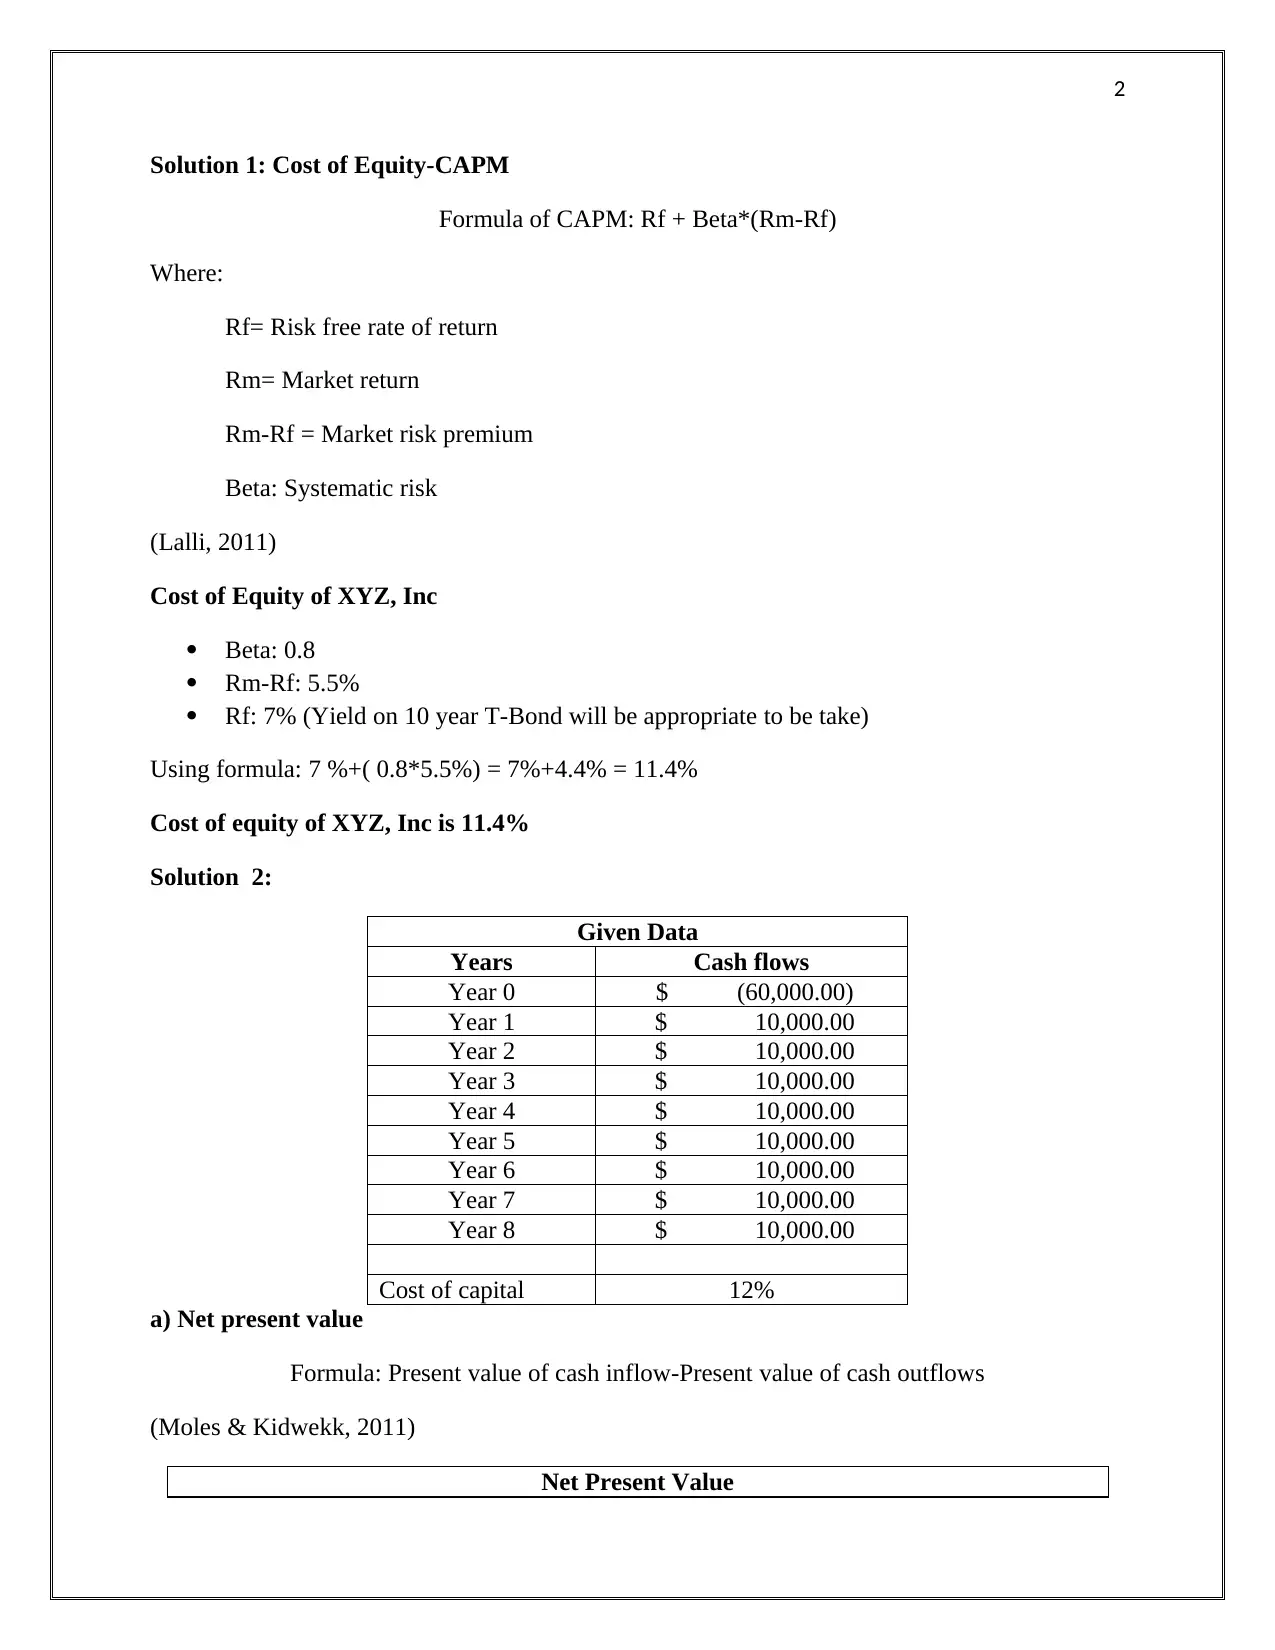
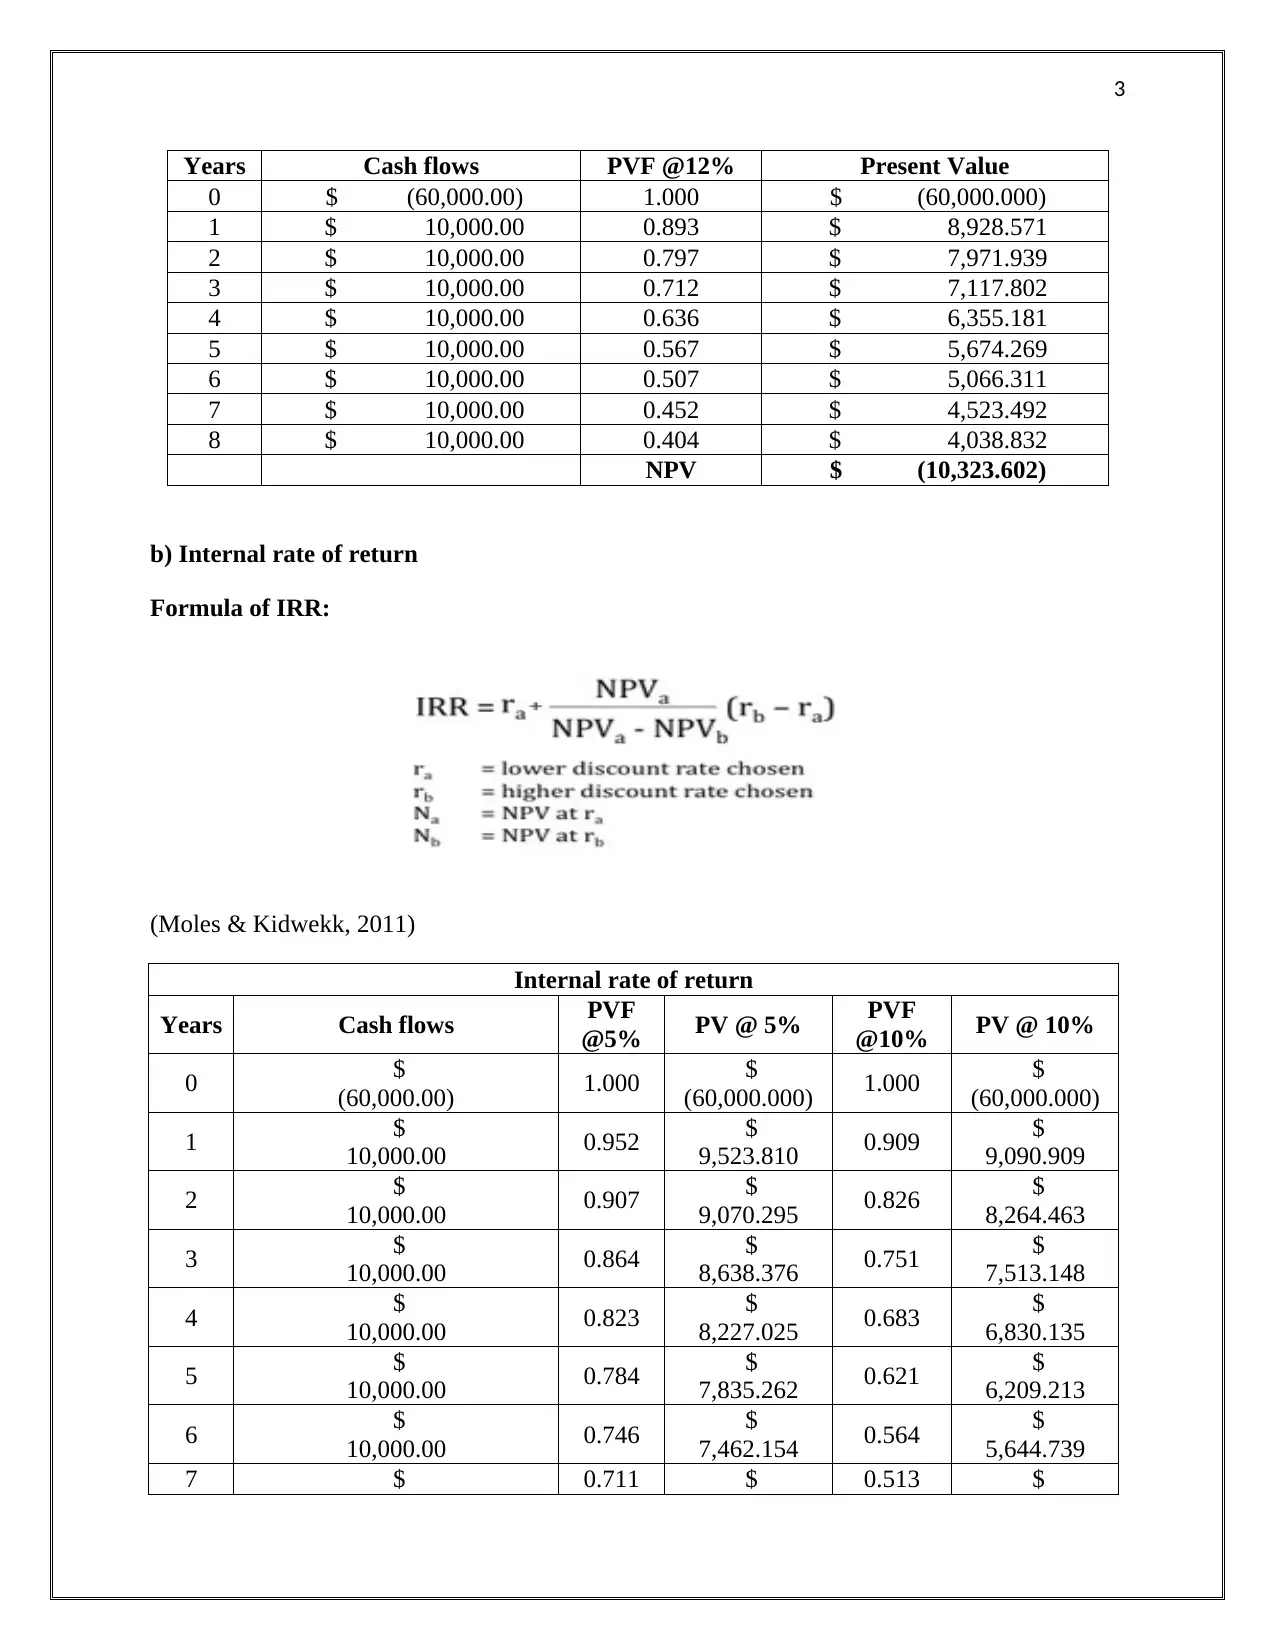
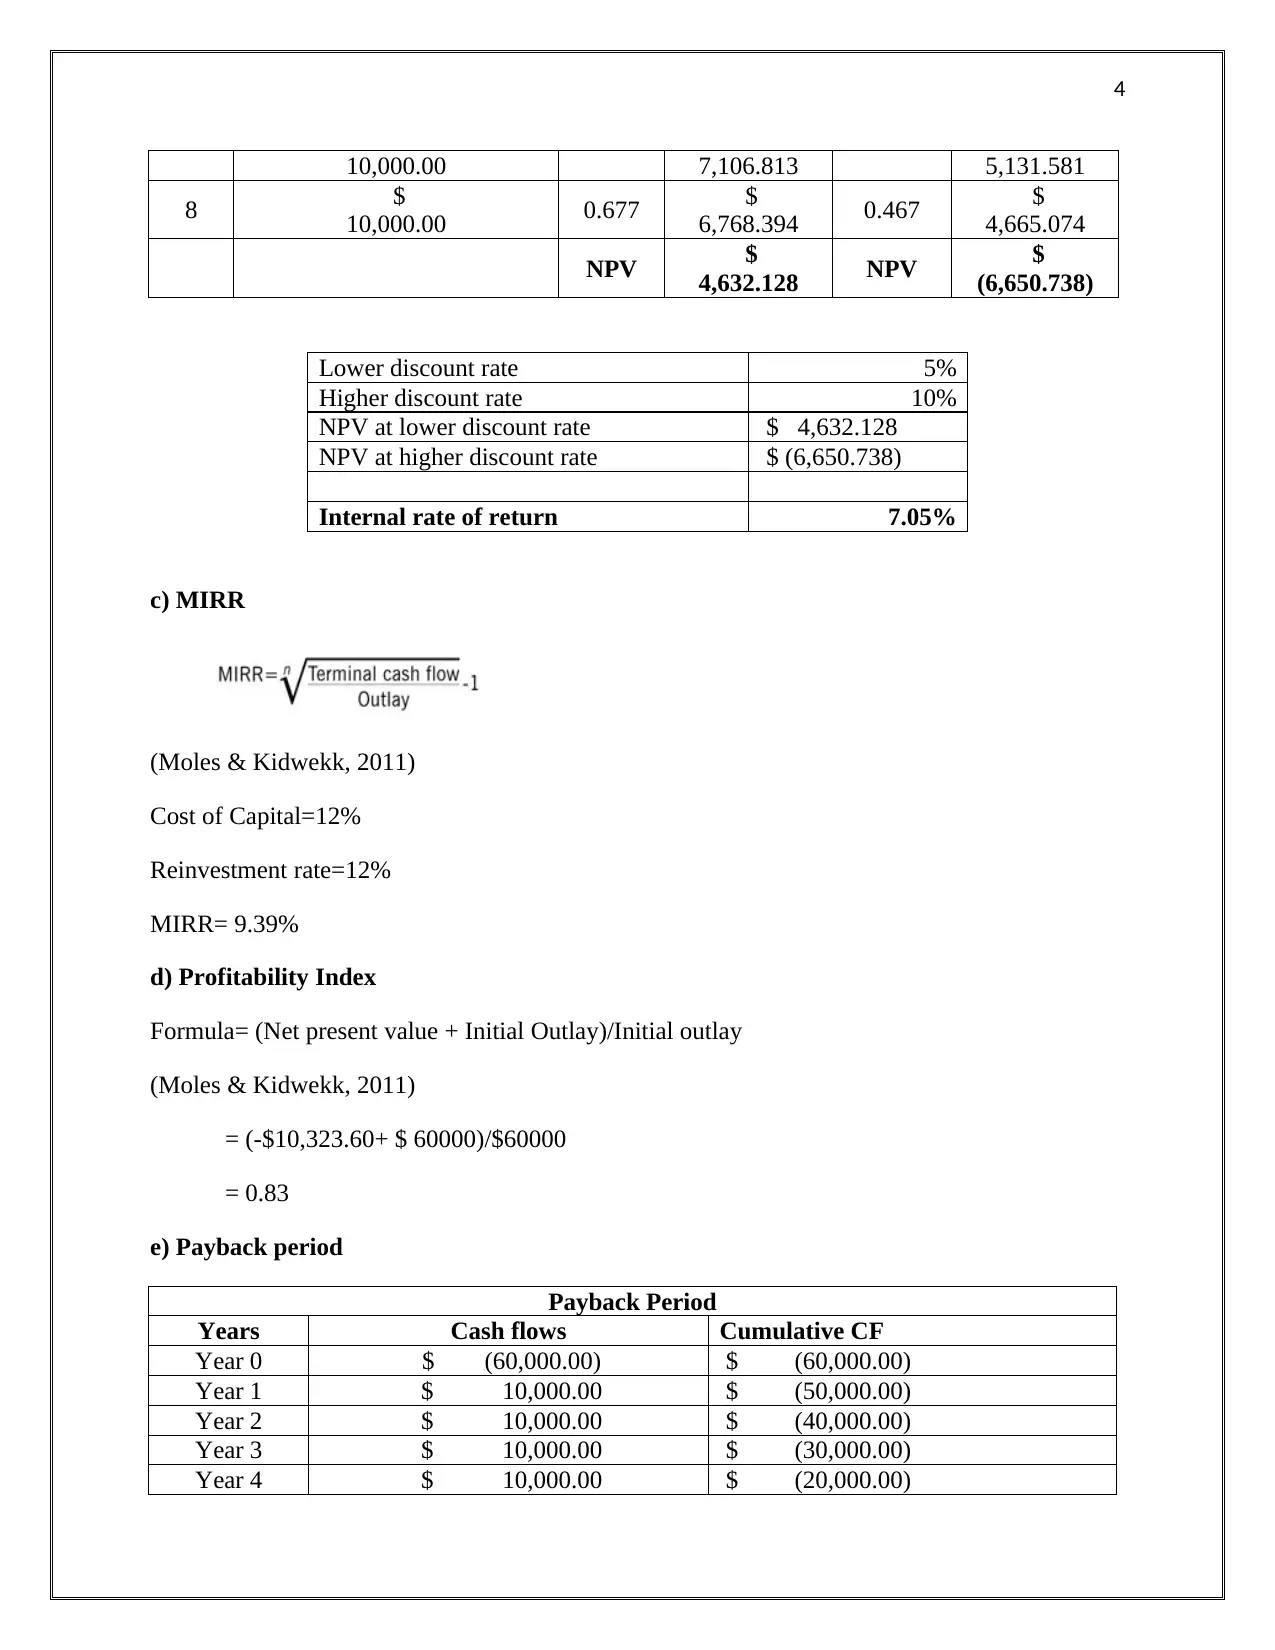
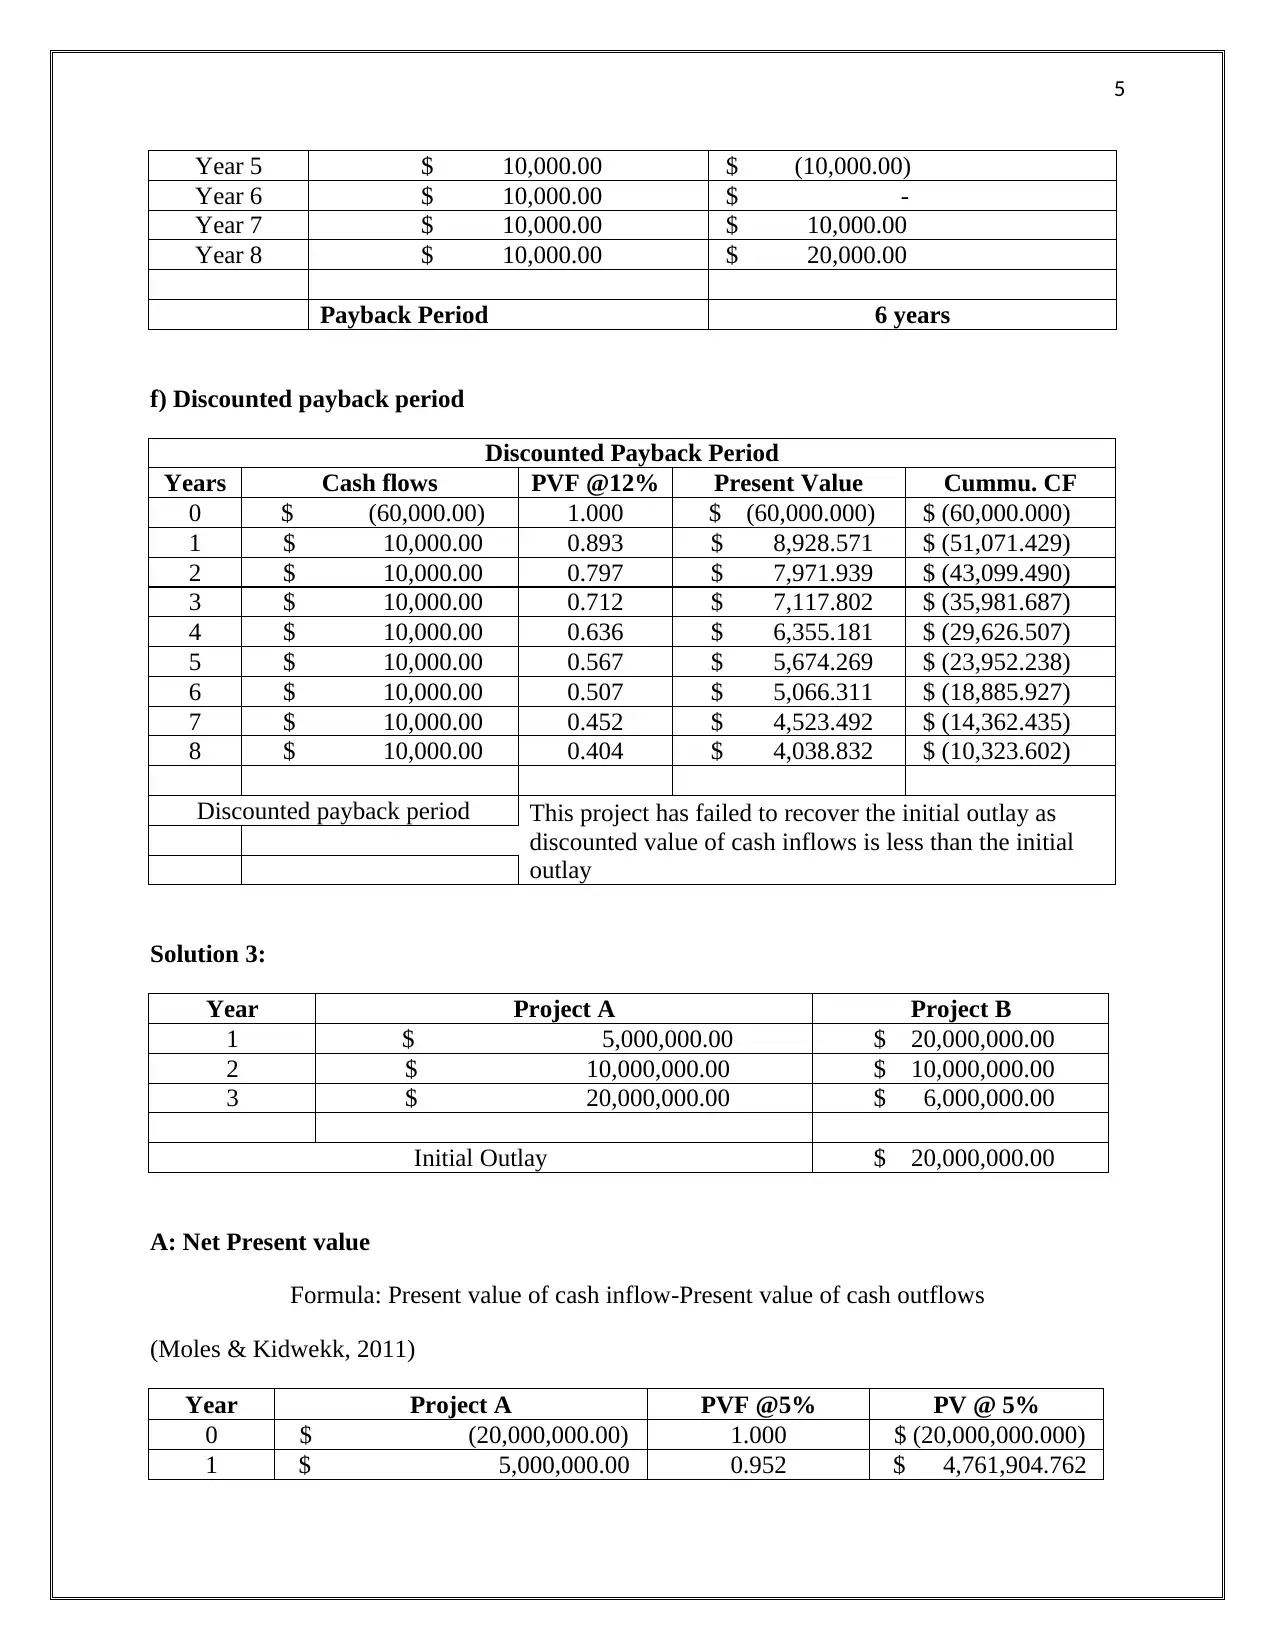
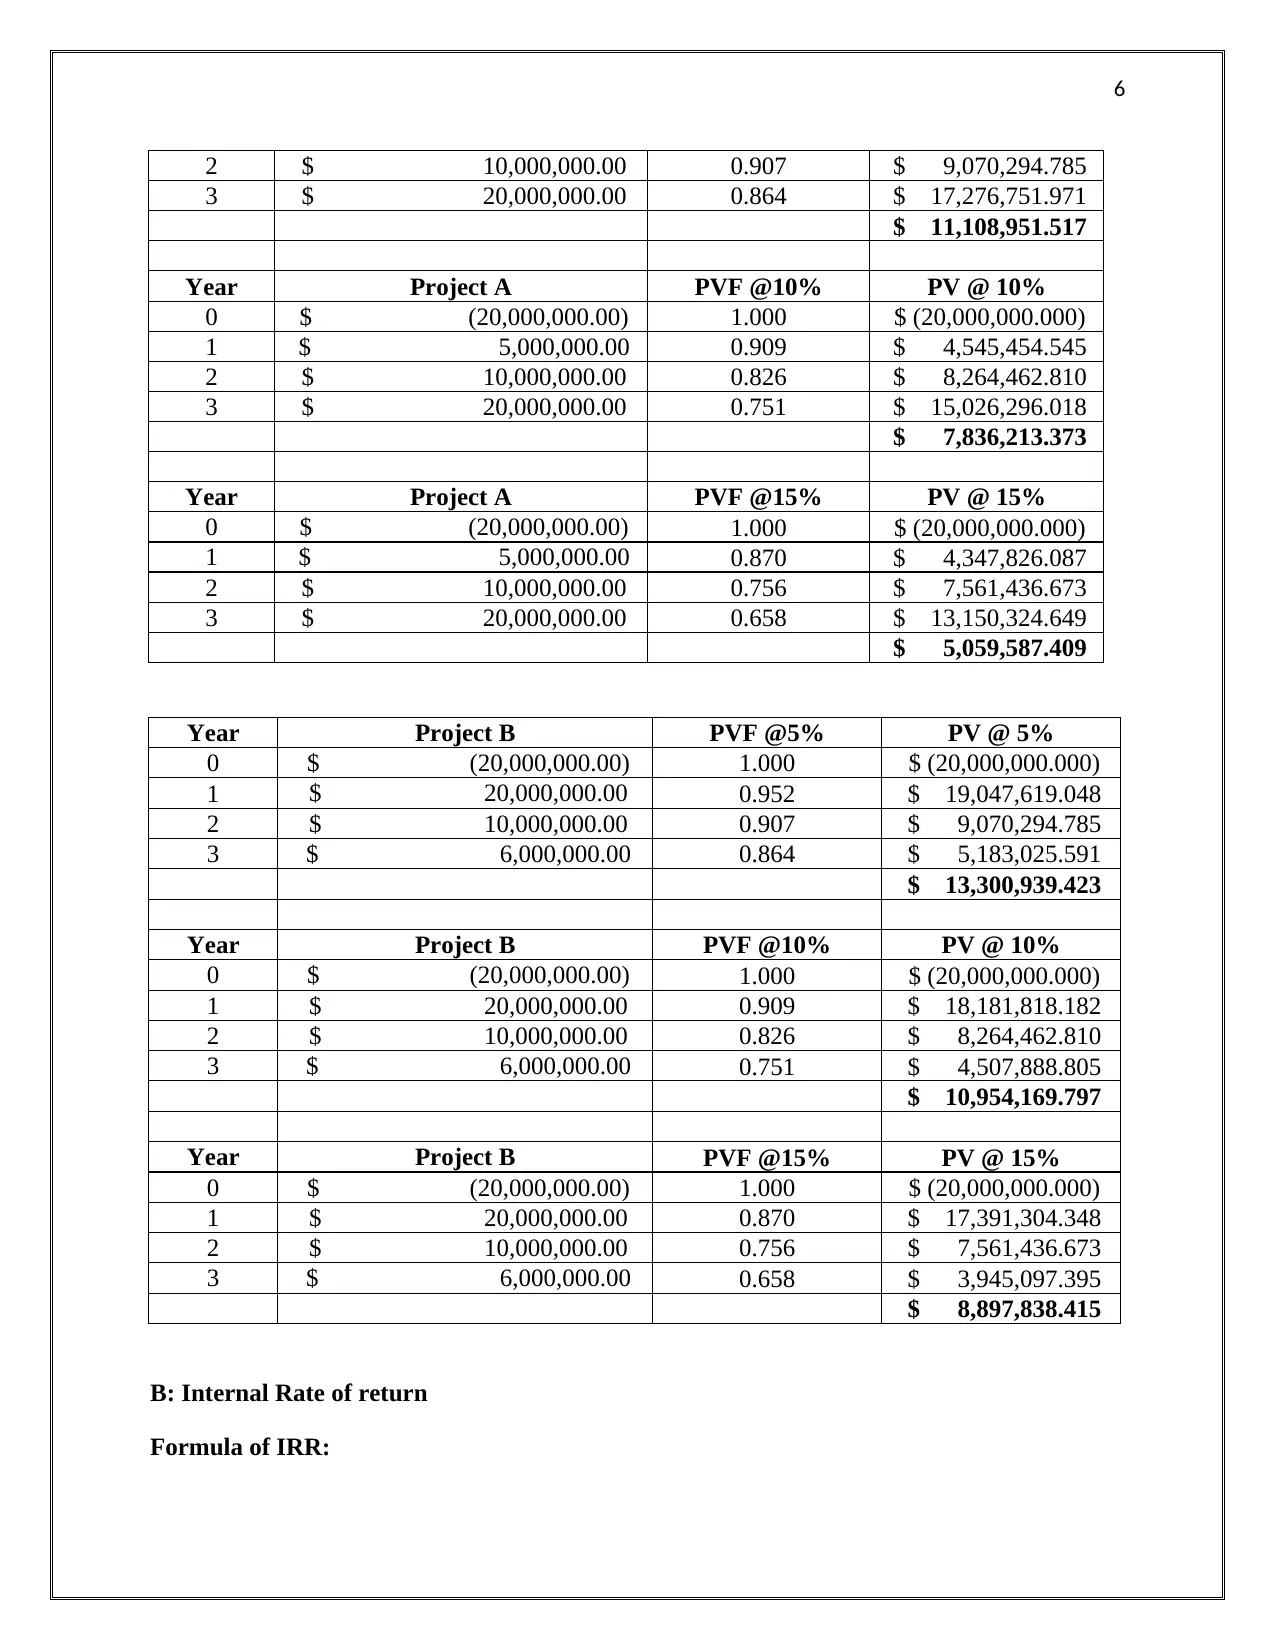
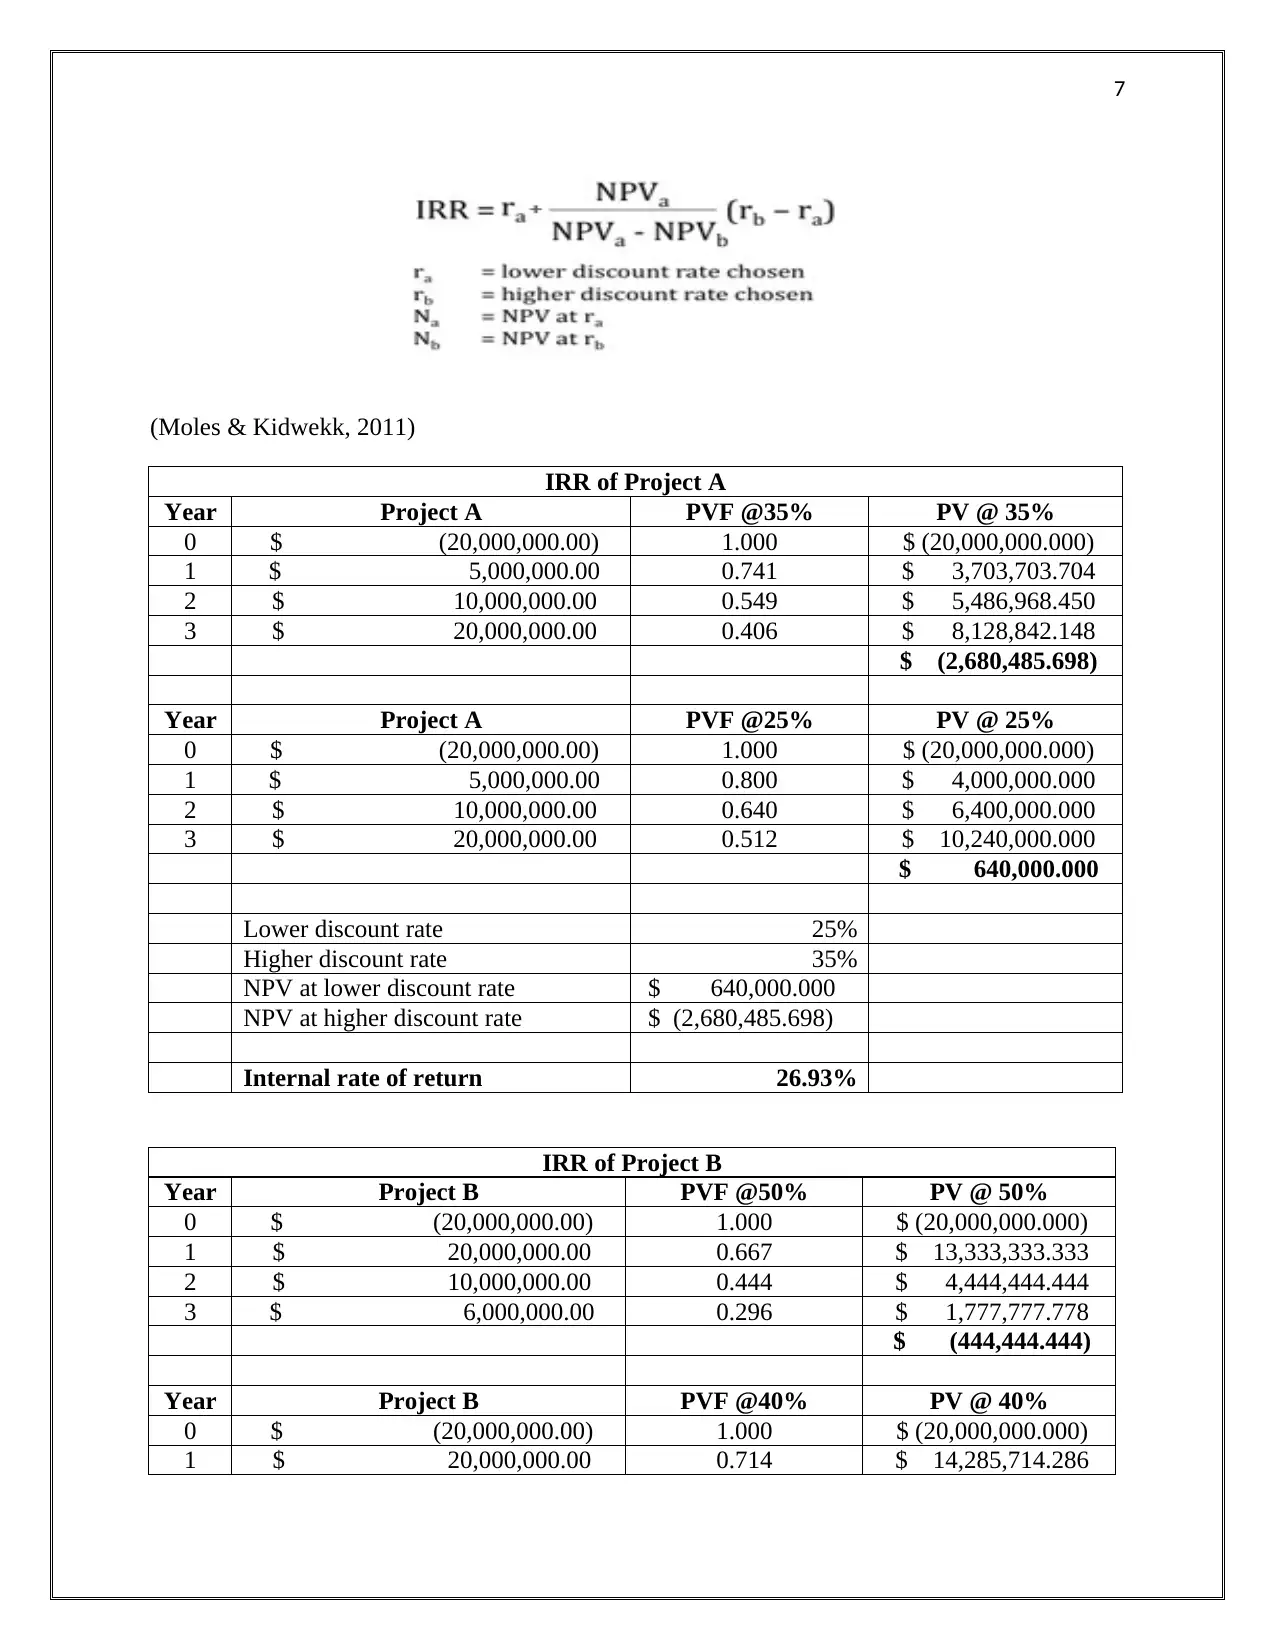
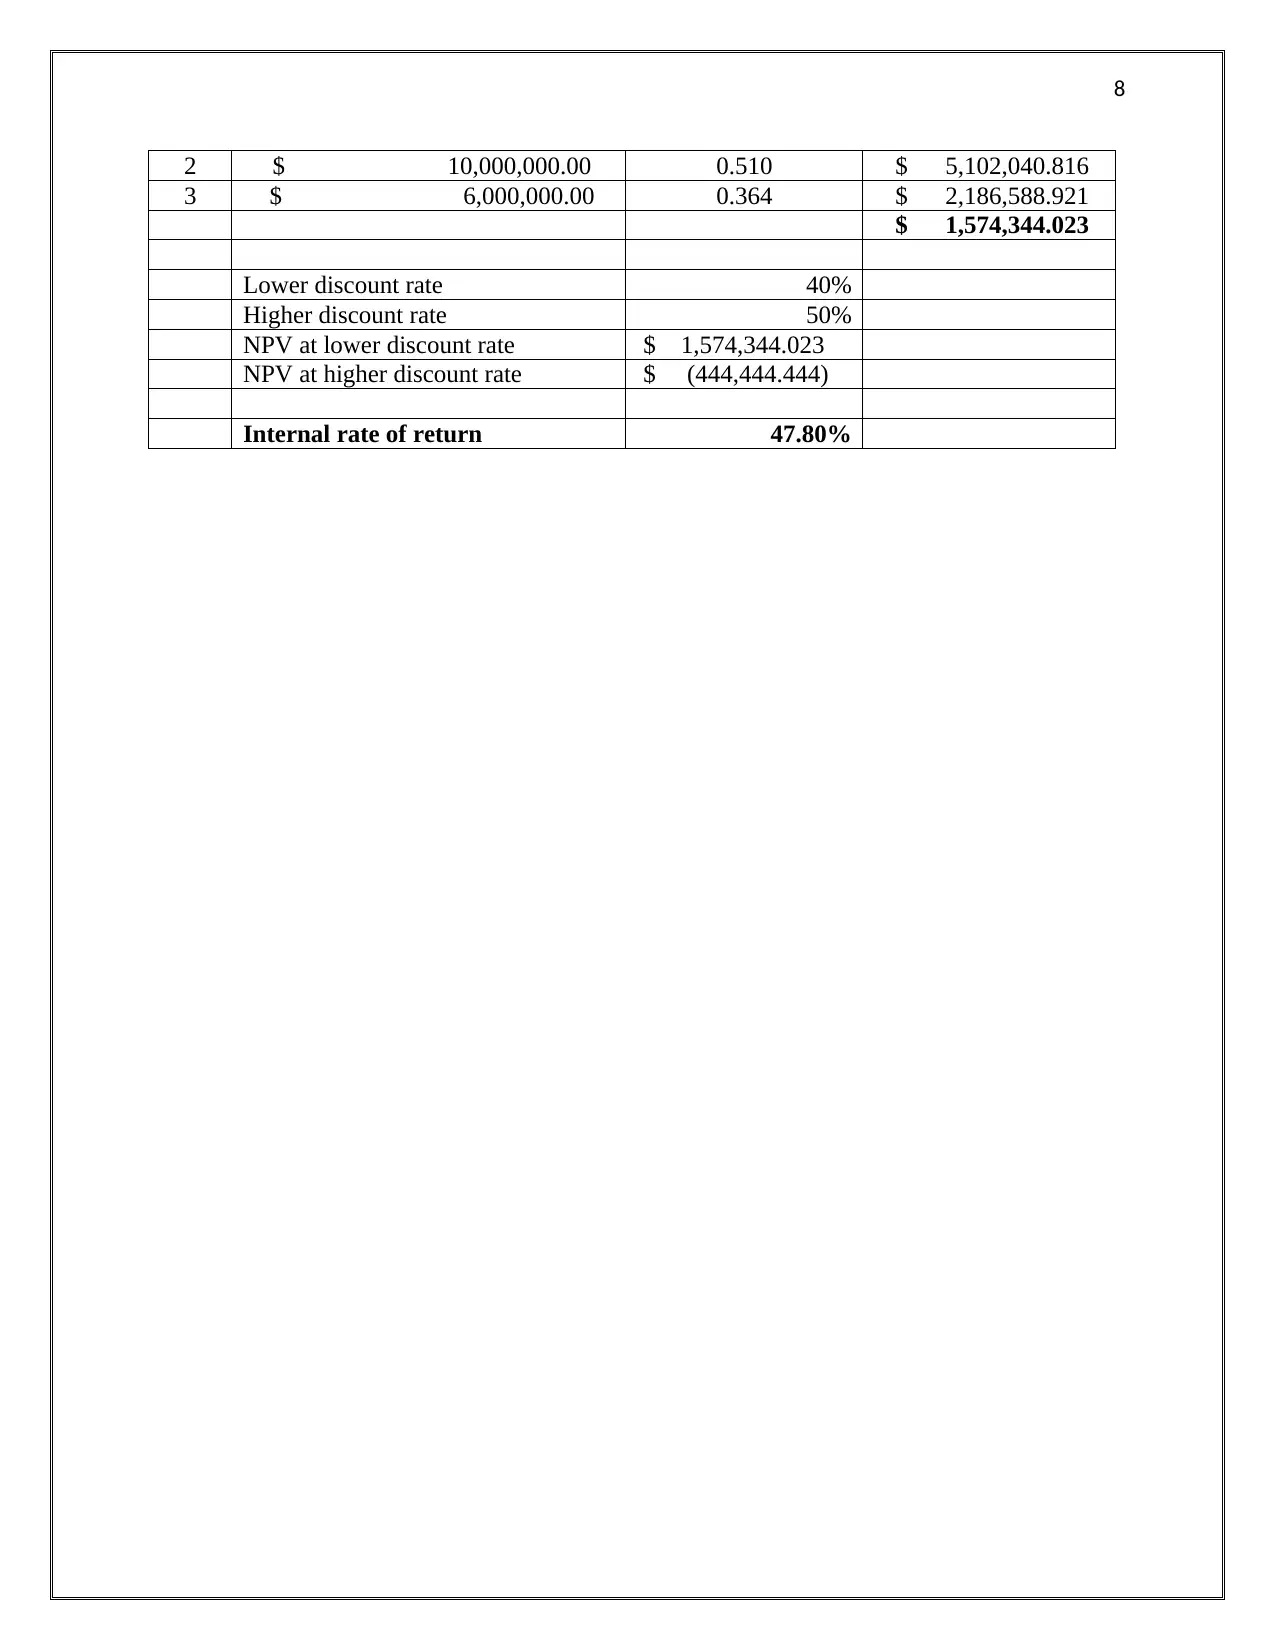
This document provides a comprehensive set of solutions for a capital budgeting assignment. The solutions cover various aspects of financial analysis and investment project evaluation. The document begins by calculating the cost of equity using the Capital Asset Pricing Model (CAPM). It then proceeds to analyze a project using Net Present Value (NPV), Internal Rate of Return (IRR), Modified Internal Rate of Return (MIRR), Profitability Index (PI), Payback Period, and Discounted Payback Period. The assignment also includes a comparative analysis of two projects, calculating NPV and IRR at different discount rates for each. The analysis includes formulas and step-by-step calculations to illustrate each concept. The document provides a clear understanding of capital budgeting techniques and their application in financial decision-making.
Document Page
1
Capital Budgeting
tabler-icon-diamond-filled.svg

Paraphrase This Document

Need a fresh take? Get an instant paraphrase of this document with our AI Paraphraser
Document Page
2
Solution 1: Cost of Equity-CAPM
Formula of CAPM: Rf + Beta*(Rm-Rf)
Where:
Rf= Risk free rate of return
Rm= Market return
Rm-Rf = Market risk premium
Beta: Systematic risk
(Lalli, 2011)
Cost of Equity of XYZ, Inc
ï‚· Beta: 0.8
ï‚· Rm-Rf: 5.5%
ï‚· Rf: 7% (Yield on 10 year T-Bond will be appropriate to be take)
Using formula: 7 %+( 0.8*5.5%) = 7%+4.4% = 11.4%
Cost of equity of XYZ, Inc is 11.4%
Solution 2:
Given Data
Years Cash flows
Year 0 $ (60,000.00)
Year 1 $ 10,000.00
Year 2 $ 10,000.00
Year 3 $ 10,000.00
Year 4 $ 10,000.00
Year 5 $ 10,000.00
Year 6 $ 10,000.00
Year 7 $ 10,000.00
Year 8 $ 10,000.00
Cost of capital 12%
a) Net present value
Formula: Present value of cash inflow-Present value of cash outflows
(Moles & Kidwekk, 2011)
Net Present Value
Document Page
3
Years Cash flows PVF @12% Present Value
0 $ (60,000.00) 1.000 $ (60,000.000)
1 $ 10,000.00 0.893 $ 8,928.571
2 $ 10,000.00 0.797 $ 7,971.939
3 $ 10,000.00 0.712 $ 7,117.802
4 $ 10,000.00 0.636 $ 6,355.181
5 $ 10,000.00 0.567 $ 5,674.269
6 $ 10,000.00 0.507 $ 5,066.311
7 $ 10,000.00 0.452 $ 4,523.492
8 $ 10,000.00 0.404 $ 4,038.832
NPV $ (10,323.602)
b) Internal rate of return
Formula of IRR:
(Moles & Kidwekk, 2011)
Internal rate of return
Years Cash flows PVF
@5% PV @ 5% PVF
@10% PV @ 10%
0 $
(60,000.00) 1.000 $
(60,000.000) 1.000 $
(60,000.000)
1 $
10,000.00 0.952 $
9,523.810 0.909 $
9,090.909
2 $
10,000.00 0.907 $
9,070.295 0.826 $
8,264.463
3 $
10,000.00 0.864 $
8,638.376 0.751 $
7,513.148
4 $
10,000.00 0.823 $
8,227.025 0.683 $
6,830.135
5 $
10,000.00 0.784 $
7,835.262 0.621 $
6,209.213
6 $
10,000.00 0.746 $
7,462.154 0.564 $
5,644.739
7 $ 0.711 $ 0.513 $
Document Page
4
10,000.00 7,106.813 5,131.581
8 $
10,000.00 0.677 $
6,768.394 0.467 $
4,665.074
NPV $
4,632.128 NPV $
(6,650.738)
Lower discount rate 5%
Higher discount rate 10%
NPV at lower discount rate $ 4,632.128
NPV at higher discount rate $ (6,650.738)
Internal rate of return 7.05%
c) MIRR
(Moles & Kidwekk, 2011)
Cost of Capital=12%
Reinvestment rate=12%
MIRR= 9.39%
d) Profitability Index
Formula= (Net present value + Initial Outlay)/Initial outlay
(Moles & Kidwekk, 2011)
= (-$10,323.60+ $ 60000)/$60000
= 0.83
e) Payback period
Payback Period
Years Cash flows Cumulative CF
Year 0 $ (60,000.00) $ (60,000.00)
Year 1 $ 10,000.00 $ (50,000.00)
Year 2 $ 10,000.00 $ (40,000.00)
Year 3 $ 10,000.00 $ (30,000.00)
Year 4 $ 10,000.00 $ (20,000.00)
tabler-icon-diamond-filled.svg

Paraphrase This Document

Need a fresh take? Get an instant paraphrase of this document with our AI Paraphraser
Document Page
5
Year 5 $ 10,000.00 $ (10,000.00)
Year 6 $ 10,000.00 $ -
Year 7 $ 10,000.00 $ 10,000.00
Year 8 $ 10,000.00 $ 20,000.00
Payback Period 6 years
f) Discounted payback period
Discounted Payback Period
Years Cash flows PVF @12% Present Value Cummu. CF
0 $ (60,000.00) 1.000 $ (60,000.000) $ (60,000.000)
1 $ 10,000.00 0.893 $ 8,928.571 $ (51,071.429)
2 $ 10,000.00 0.797 $ 7,971.939 $ (43,099.490)
3 $ 10,000.00 0.712 $ 7,117.802 $ (35,981.687)
4 $ 10,000.00 0.636 $ 6,355.181 $ (29,626.507)
5 $ 10,000.00 0.567 $ 5,674.269 $ (23,952.238)
6 $ 10,000.00 0.507 $ 5,066.311 $ (18,885.927)
7 $ 10,000.00 0.452 $ 4,523.492 $ (14,362.435)
8 $ 10,000.00 0.404 $ 4,038.832 $ (10,323.602)
Discounted payback period This project has failed to recover the initial outlay as
discounted value of cash inflows is less than the initial
outlay
Solution 3:
Year Project A Project B
1 $ 5,000,000.00 $ 20,000,000.00
2 $ 10,000,000.00 $ 10,000,000.00
3 $ 20,000,000.00 $ 6,000,000.00
Initial Outlay $ 20,000,000.00
A: Net Present value
Formula: Present value of cash inflow-Present value of cash outflows
(Moles & Kidwekk, 2011)
Year Project A PVF @5% PV @ 5%
0 $ (20,000,000.00) 1.000 $ (20,000,000.000)
1 $ 5,000,000.00 0.952 $ 4,761,904.762
Document Page
6
2 $ 10,000,000.00 0.907 $ 9,070,294.785
3 $ 20,000,000.00 0.864 $ 17,276,751.971
$ 11,108,951.517
Year Project A PVF @10% PV @ 10%
0 $ (20,000,000.00) 1.000 $ (20,000,000.000)
1 $ 5,000,000.00 0.909 $ 4,545,454.545
2 $ 10,000,000.00 0.826 $ 8,264,462.810
3 $ 20,000,000.00 0.751 $ 15,026,296.018
$ 7,836,213.373
Year Project A PVF @15% PV @ 15%
0 $ (20,000,000.00) 1.000 $ (20,000,000.000)
1 $ 5,000,000.00 0.870 $ 4,347,826.087
2 $ 10,000,000.00 0.756 $ 7,561,436.673
3 $ 20,000,000.00 0.658 $ 13,150,324.649
$ 5,059,587.409
Year Project B PVF @5% PV @ 5%
0 $ (20,000,000.00) 1.000 $ (20,000,000.000)
1 $ 20,000,000.00 0.952 $ 19,047,619.048
2 $ 10,000,000.00 0.907 $ 9,070,294.785
3 $ 6,000,000.00 0.864 $ 5,183,025.591
$ 13,300,939.423
Year Project B PVF @10% PV @ 10%
0 $ (20,000,000.00) 1.000 $ (20,000,000.000)
1 $ 20,000,000.00 0.909 $ 18,181,818.182
2 $ 10,000,000.00 0.826 $ 8,264,462.810
3 $ 6,000,000.00 0.751 $ 4,507,888.805
$ 10,954,169.797
Year Project B PVF @15% PV @ 15%
0 $ (20,000,000.00) 1.000 $ (20,000,000.000)
1 $ 20,000,000.00 0.870 $ 17,391,304.348
2 $ 10,000,000.00 0.756 $ 7,561,436.673
3 $ 6,000,000.00 0.658 $ 3,945,097.395
$ 8,897,838.415
B: Internal Rate of return
Formula of IRR:
Document Page
7
(Moles & Kidwekk, 2011)
IRR of Project A
Year Project A PVF @35% PV @ 35%
0 $ (20,000,000.00) 1.000 $ (20,000,000.000)
1 $ 5,000,000.00 0.741 $ 3,703,703.704
2 $ 10,000,000.00 0.549 $ 5,486,968.450
3 $ 20,000,000.00 0.406 $ 8,128,842.148
$ (2,680,485.698)
Year Project A PVF @25% PV @ 25%
0 $ (20,000,000.00) 1.000 $ (20,000,000.000)
1 $ 5,000,000.00 0.800 $ 4,000,000.000
2 $ 10,000,000.00 0.640 $ 6,400,000.000
3 $ 20,000,000.00 0.512 $ 10,240,000.000
$ 640,000.000
Lower discount rate 25%
Higher discount rate 35%
NPV at lower discount rate $ 640,000.000
NPV at higher discount rate $ (2,680,485.698)
Internal rate of return 26.93%
IRR of Project B
Year Project B PVF @50% PV @ 50%
0 $ (20,000,000.00) 1.000 $ (20,000,000.000)
1 $ 20,000,000.00 0.667 $ 13,333,333.333
2 $ 10,000,000.00 0.444 $ 4,444,444.444
3 $ 6,000,000.00 0.296 $ 1,777,777.778
$ (444,444.444)
Year Project B PVF @40% PV @ 40%
0 $ (20,000,000.00) 1.000 $ (20,000,000.000)
1 $ 20,000,000.00 0.714 $ 14,285,714.286
tabler-icon-diamond-filled.svg

Paraphrase This Document

Need a fresh take? Get an instant paraphrase of this document with our AI Paraphraser
Document Page
8
2 $ 10,000,000.00 0.510 $ 5,102,040.816
3 $ 6,000,000.00 0.364 $ 2,186,588.921
$ 1,574,344.023
Lower discount rate 40%
Higher discount rate 50%
NPV at lower discount rate $ 1,574,344.023
NPV at higher discount rate $ (444,444.444)
Internal rate of return 47.80%
Document Page
9
References
Lalli, W. (2011). Handbook of Budgeting. US: John Wiley & Sons.
Moles, P. & Kidwekk, D. (2011). Corporate finance. US: John Wiley &sons.
chevron_up_icon
1 out of 9
circle_padding
hide_on_mobile
zoom_out_icon
[object Object]