Data Exercise #1: GDP and Economic Freedom

Verified

Added on  2019/10/12

|3
|1080
|311
Practical Assignment
AI Summary
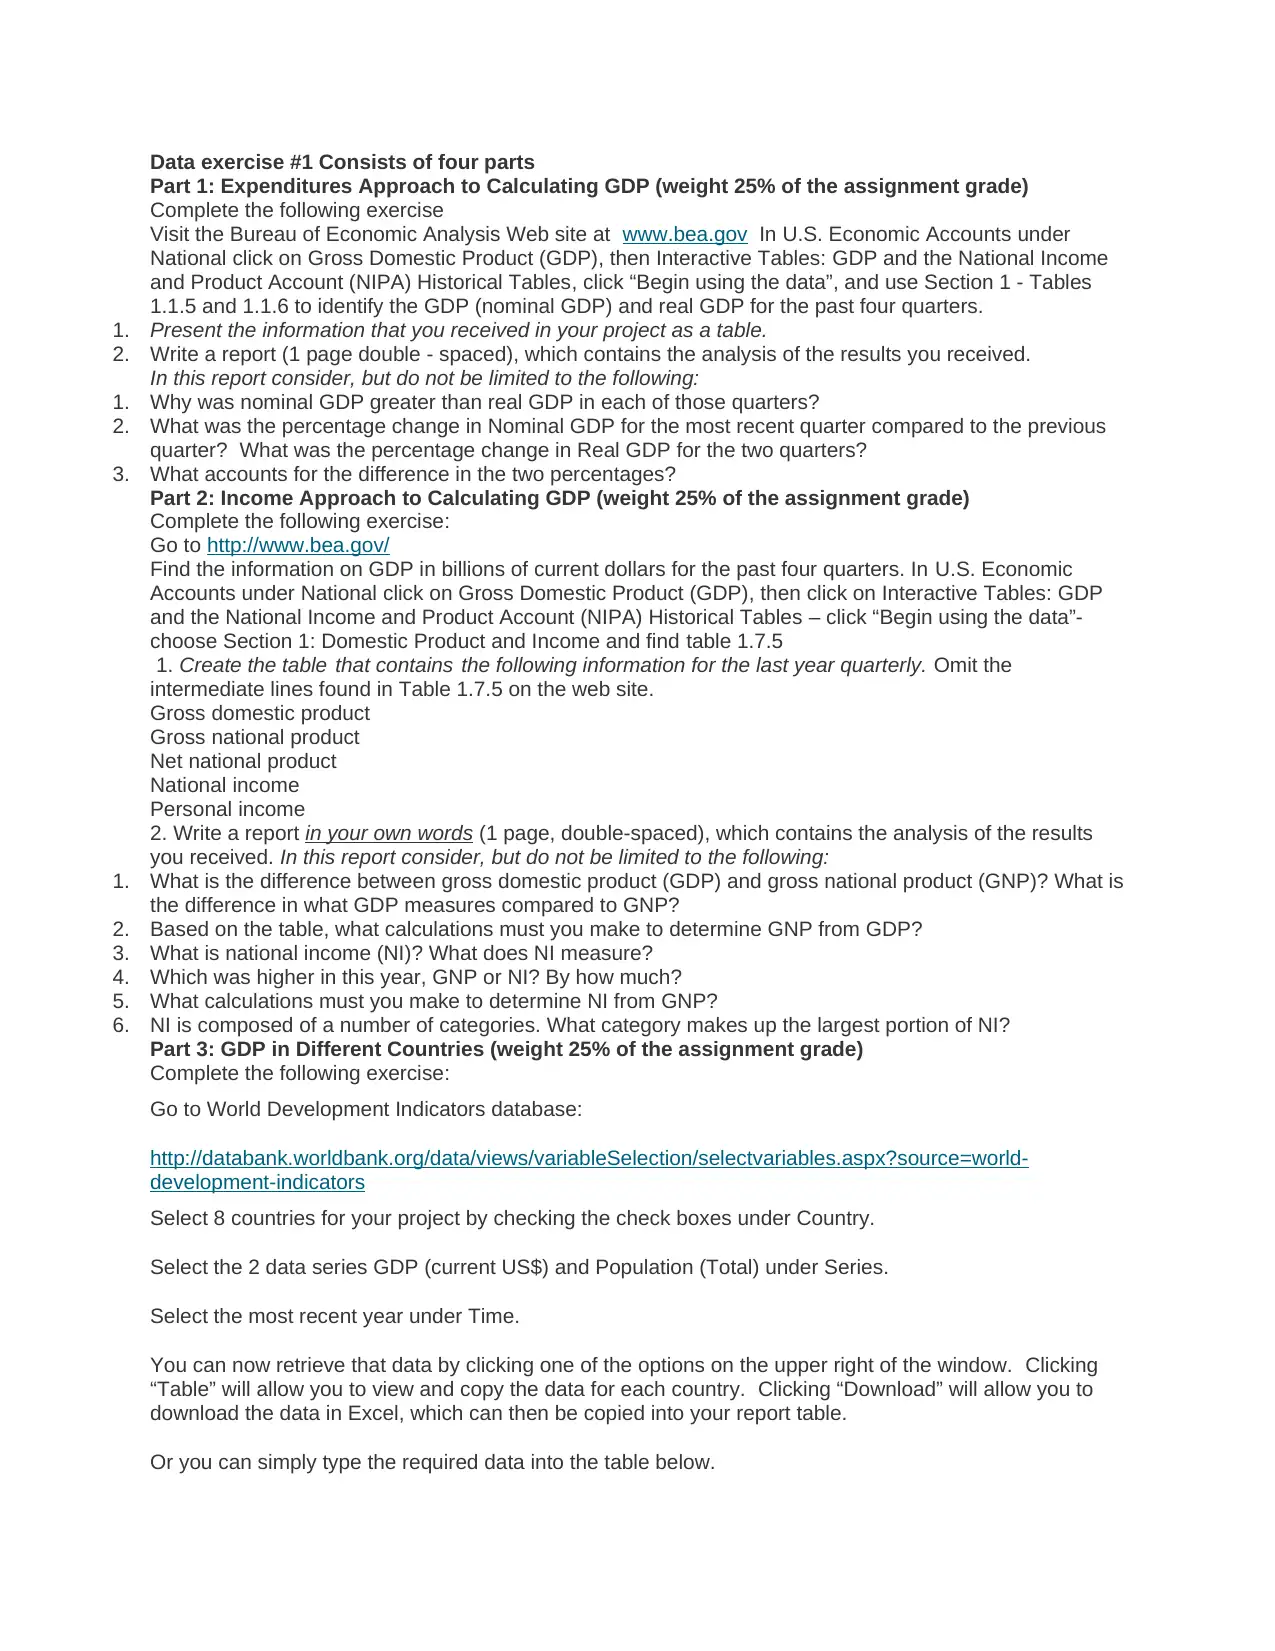
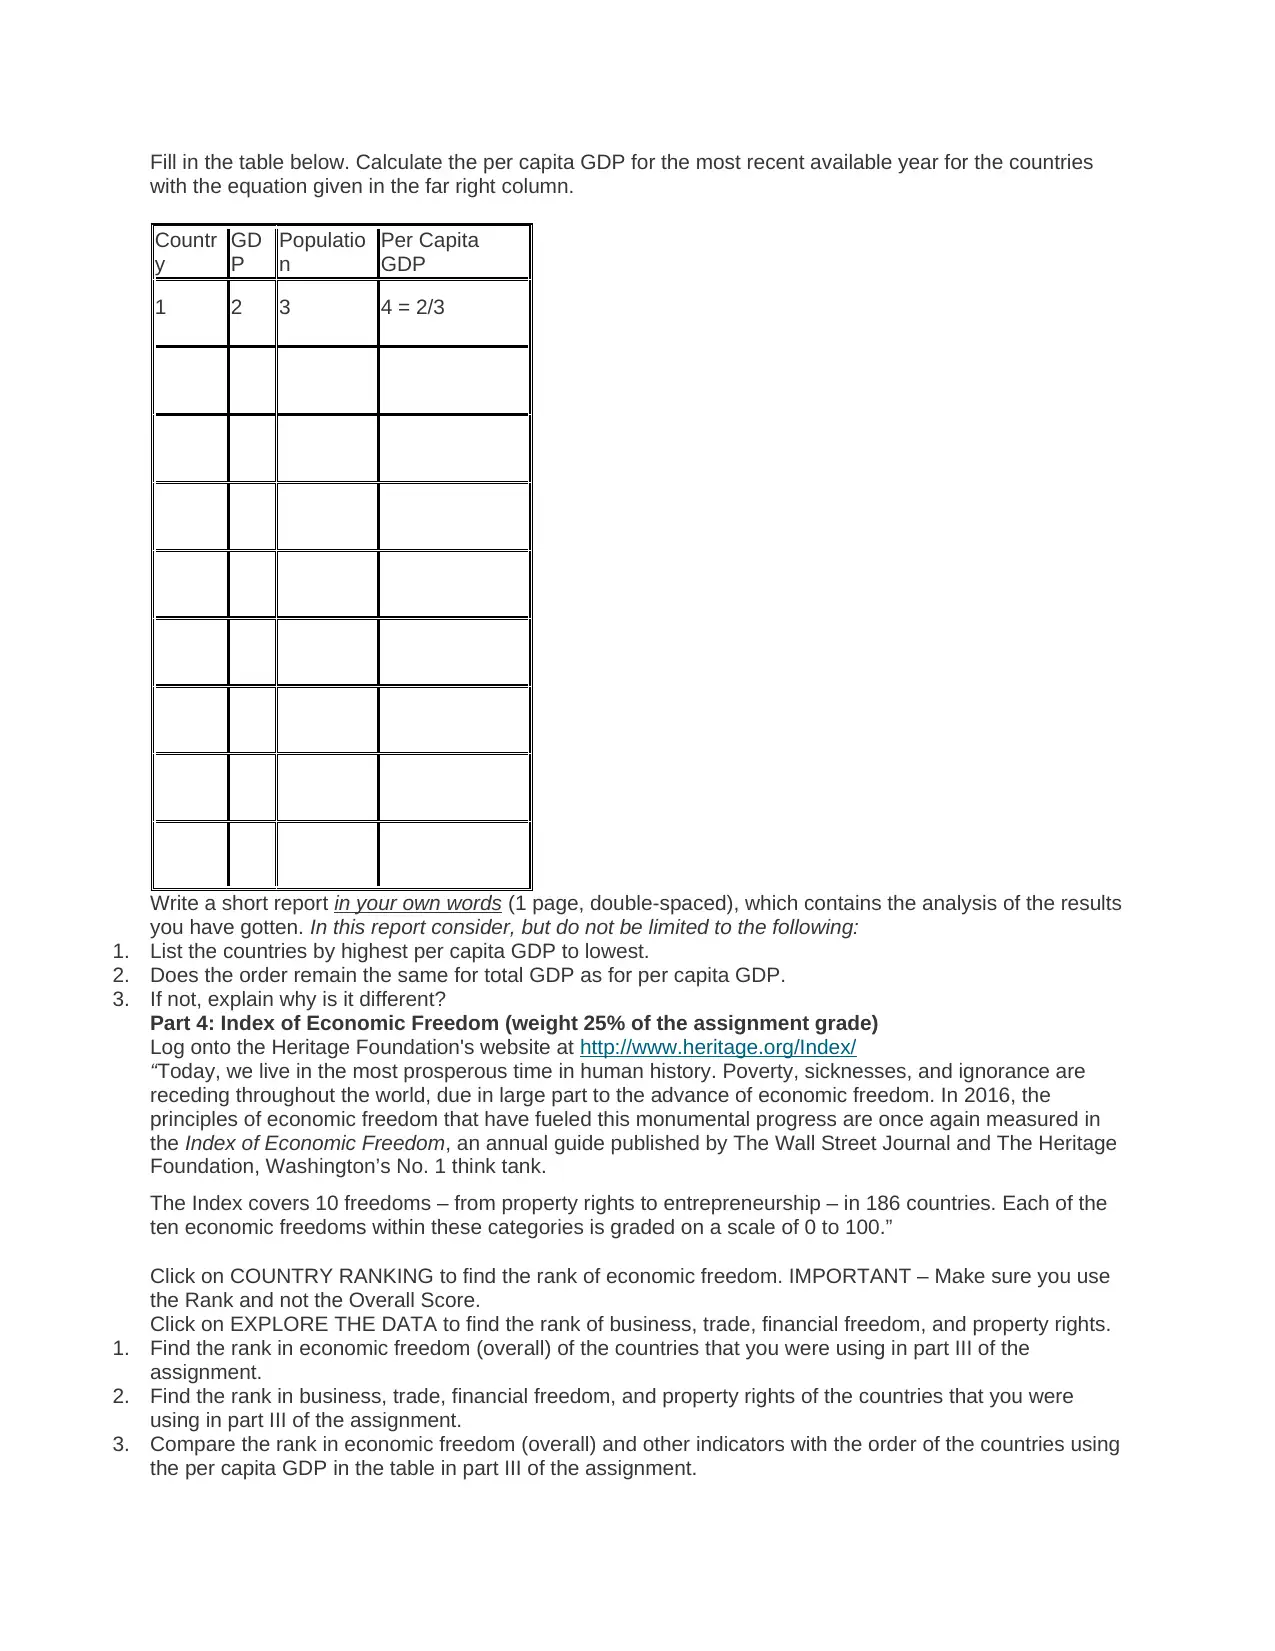
This practical assignment involves a four-part data analysis exercise focusing on Gross Domestic Product (GDP) and economic freedom. Part 1 uses the Bureau of Economic Analysis (BEA) website to calculate GDP using the expenditures approach, analyzing nominal vs. real GDP and percentage changes. Part 2 utilizes the BEA website again, this time employing the income approach to calculate GDP, GNP, and national income, comparing and contrasting these measures. Part 3 uses the World Bank's data to compare GDP and per capita GDP across eight self-selected countries, analyzing the differences and reasons for variations. Finally, Part 4 uses the Heritage Foundation's Index of Economic Freedom to rank the same eight countries based on economic freedom indicators, comparing these rankings to the per capita GDP rankings from Part 3. Each part requires creating tables summarizing the data and writing a short report analyzing the findings.
tabler-icon-diamond-filled.svg

Contribute Materials

Your contribution can guide someone’s learning journey. Share your documents today.
Document Page
Data exercise #1 Consists of four parts
Part 1: Expenditures Approach to Calculating GDP (weight 25% of the assignment grade)
Complete the following exercise
Visit the Bureau of Economic Analysis Web site at www.bea.gov In U.S. Economic Accounts under
National click on Gross Domestic Product (GDP), then Interactive Tables: GDP and the National Income
and Product Account (NIPA) Historical Tables, click “Begin using the data”, and use Section 1 - Tables
1.1.5 and 1.1.6 to identify the GDP (nominal GDP) and real GDP for the past four quarters.
1. Present the information that you received in your project as a table.
2. Write a report (1 page double - spaced), which contains the analysis of the results you received.
In this report consider, but do not be limited to the following:
1. Why was nominal GDP greater than real GDP in each of those quarters?
2. What was the percentage change in Nominal GDP for the most recent quarter compared to the previous
quarter? What was the percentage change in Real GDP for the two quarters?
3. What accounts for the difference in the two percentages?
Part 2: Income Approach to Calculating GDP (weight 25% of the assignment grade)
Complete the following exercise:
Go to http://www.bea.gov/
Find the information on GDP in billions of current dollars for the past four quarters. In U.S. Economic
Accounts under National click on Gross Domestic Product (GDP), then click on Interactive Tables: GDP
and the National Income and Product Account (NIPA) Historical Tables – click “Begin using the data”-
choose Section 1: Domestic Product and Income and find table 1.7.5
1. Create the table that contains the following information for the last year quarterly. Omit the
intermediate lines found in Table 1.7.5 on the web site.
Gross domestic product
Gross national product
Net national product
National income
Personal income
2. Write a report in your own words (1 page, double-spaced), which contains the analysis of the results
you received. In this report consider, but do not be limited to the following:
1. What is the difference between gross domestic product (GDP) and gross national product (GNP)? What is
the difference in what GDP measures compared to GNP?
2. Based on the table, what calculations must you make to determine GNP from GDP?
3. What is national income (NI)? What does NI measure?
4. Which was higher in this year, GNP or NI? By how much?
5. What calculations must you make to determine NI from GNP?
6. NI is composed of a number of categories. What category makes up the largest portion of NI?
Part 3: GDP in Different Countries (weight 25% of the assignment grade)
Complete the following exercise:
Go to World Development Indicators database:
http://databank.worldbank.org/data/views/variableSelection/selectvariables.aspx?source=world-
development-indicators
Select 8 countries for your project by checking the check boxes under Country.
Select the 2 data series GDP (current US$) and Population (Total) under Series.
Select the most recent year under Time.
You can now retrieve that data by clicking one of the options on the upper right of the window. Clicking
“Table” will allow you to view and copy the data for each country. Clicking “Download” will allow you to
download the data in Excel, which can then be copied into your report table.
Or you can simply type the required data into the table below.
tabler-icon-diamond-filled.svg

Secure Best Marks with AI Grader

Need help grading? Try our AI Grader for instant feedback on your assignments.
Document Page
Fill in the table below. Calculate the per capita GDP for the most recent available year for the countries
with the equation given in the far right column.
Countr
y
GD
P
Populatio
n
Per Capita
GDP
1 2 3 4 = 2/3
Write a short report in your own words (1 page, double-spaced), which contains the analysis of the results
you have gotten. In this report consider, but do not be limited to the following:
1. List the countries by highest per capita GDP to lowest.
2. Does the order remain the same for total GDP as for per capita GDP.
3. If not, explain why is it different?
Part 4: Index of Economic Freedom (weight 25% of the assignment grade)
Log onto the Heritage Foundation's website at http://www.heritage.org/Index/
Today, we live in the most prosperous time in human history. Poverty, sicknesses, and ignorance are
receding throughout the world, due in large part to the advance of economic freedom. In 2016, the
principles of economic freedom that have fueled this monumental progress are once again measured in
the Index of Economic Freedom, an annual guide published by The Wall Street Journal and The Heritage
Foundation, Washington’s No. 1 think tank.
The Index covers 10 freedoms – from property rights to entrepreneurship – in 186 countries. Each of the
ten economic freedoms within these categories is graded on a scale of 0 to 100.”
Click on COUNTRY RANKING to find the rank of economic freedom. IMPORTANT – Make sure you use
the Rank and not the Overall Score.
Click on EXPLORE THE DATA to find the rank of business, trade, financial freedom, and property rights.
1. Find the rank in economic freedom (overall) of the countries that you were using in part III of the
assignment.
2. Find the rank in business, trade, financial freedom, and property rights of the countries that you were
using in part III of the assignment.
3. Compare the rank in economic freedom (overall) and other indicators with the order of the countries using
the per capita GDP in the table in part III of the assignment.
Document Page
1. Present the information that you received in your project as a table.
2. Write a report in your own words (1 page, double-spaced), which contains the analysis of the results
that you received.
chevron_up_icon
1 out of 3
circle_padding
hide_on_mobile
zoom_out_icon
logo.png

Your All-in-One AI-Powered Toolkit for Academic Success.

Available 24*7 on WhatsApp / Email

[object Object]