Economics Report: Analysis of Australian GDP Expenditure Components

Verified

Added on  2022/11/16

|10
|1360
|141
Report
AI Summary
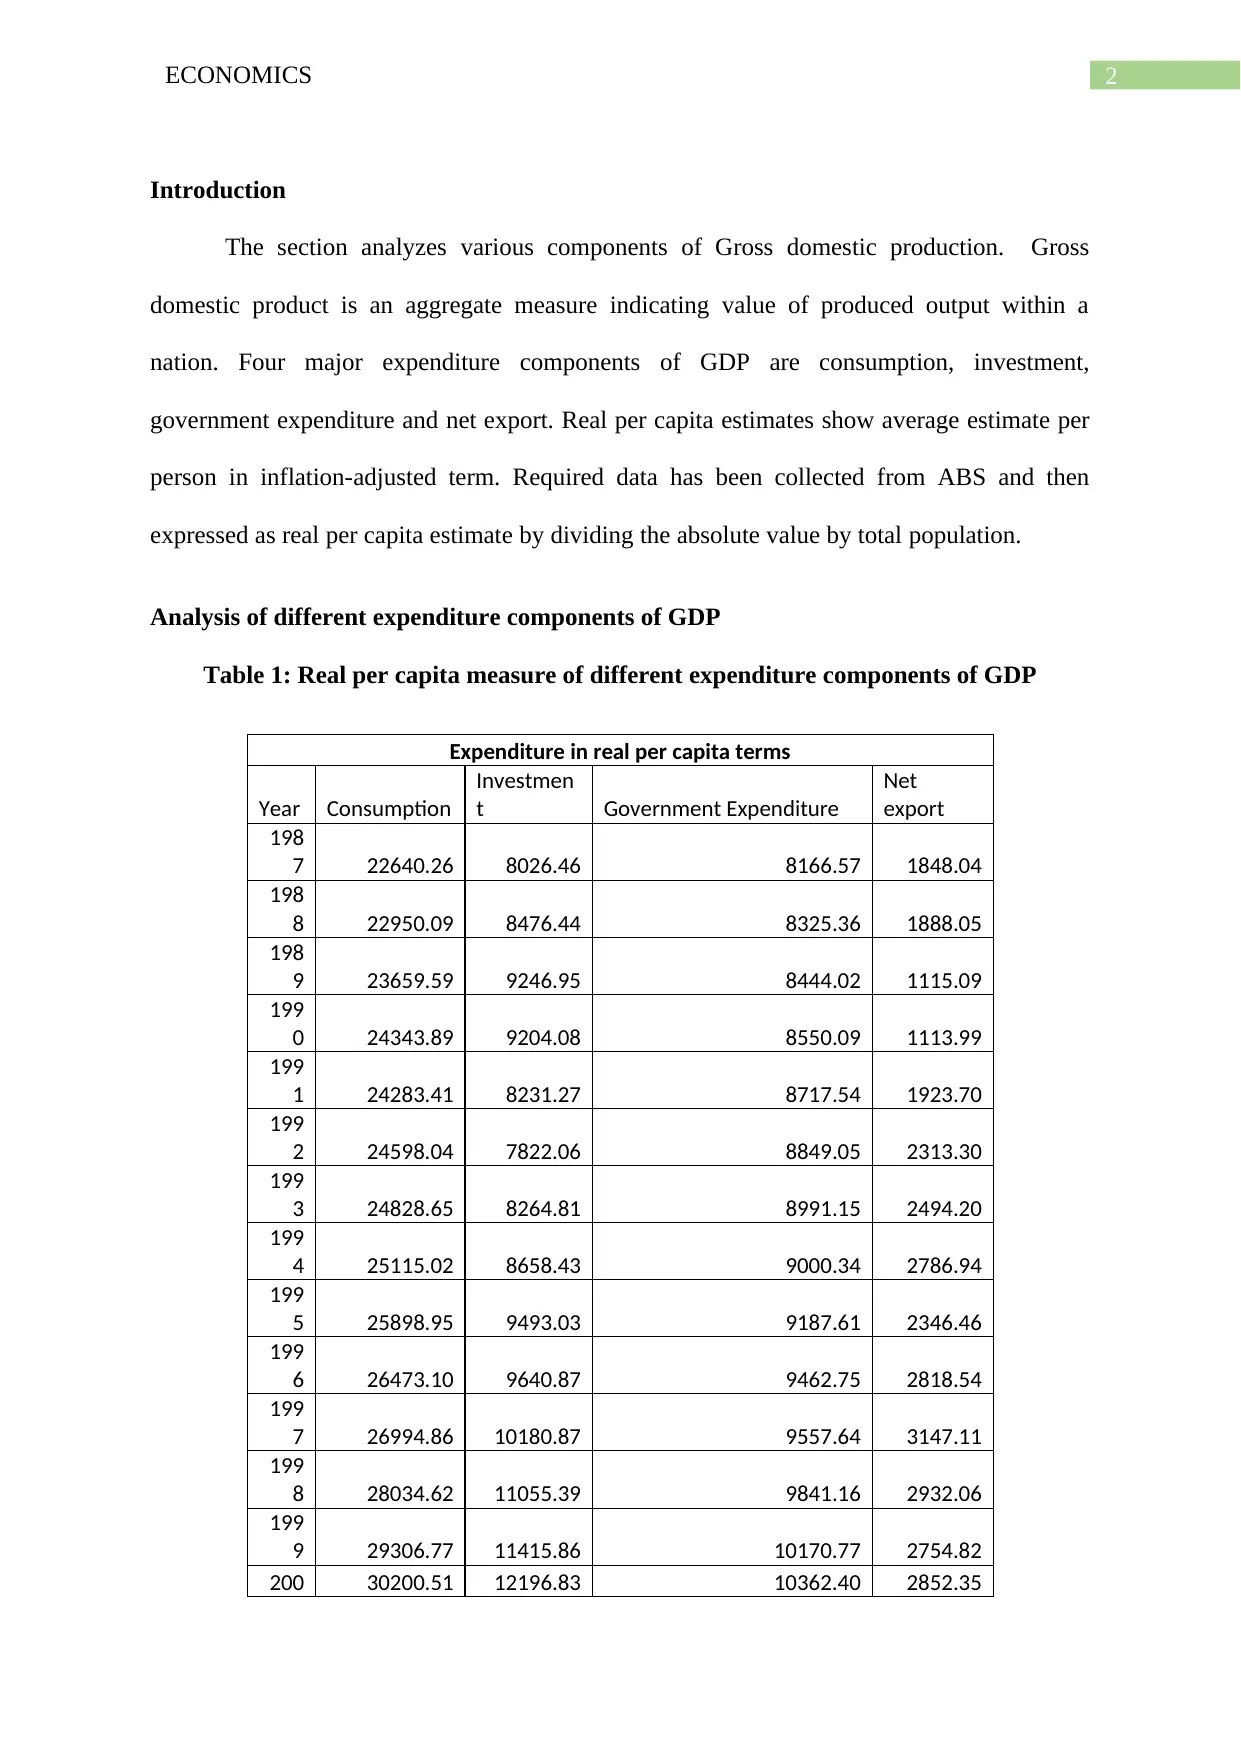
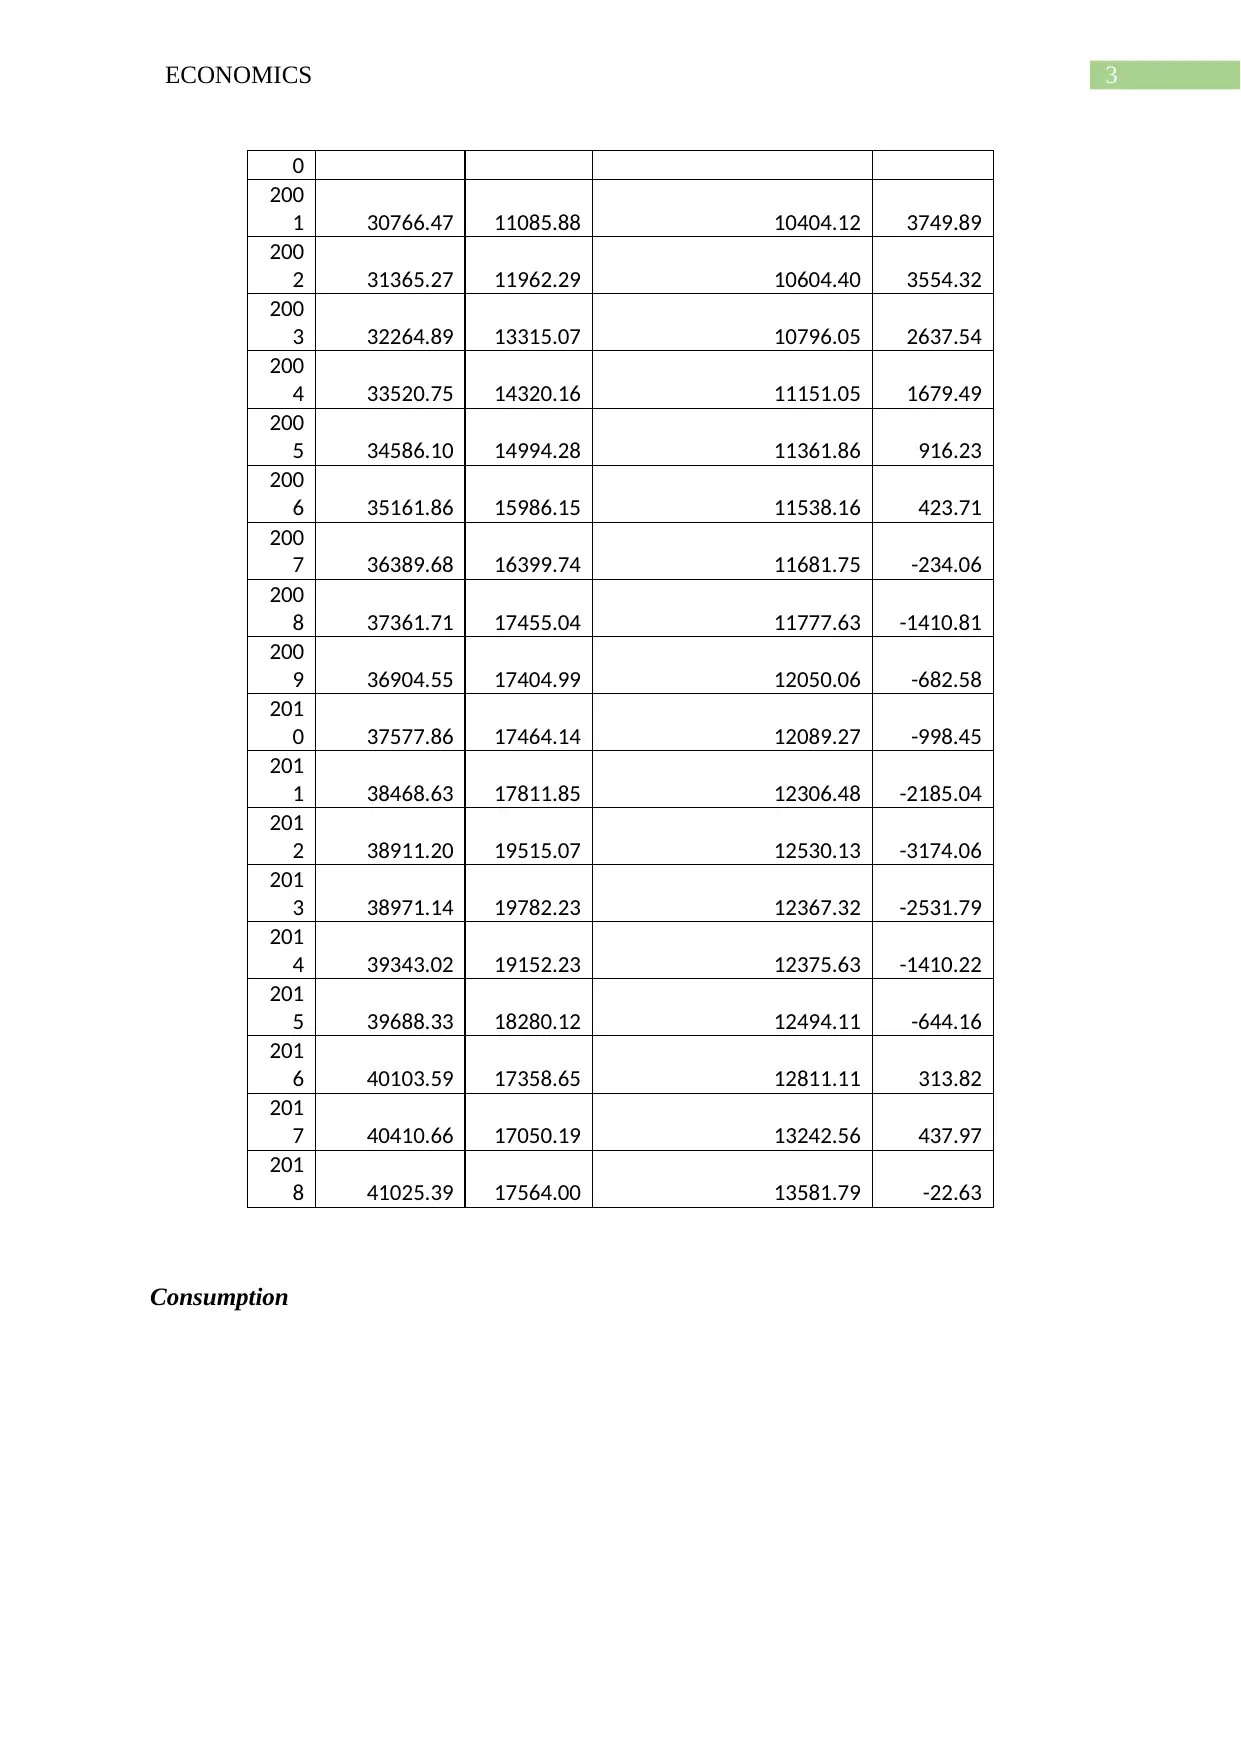
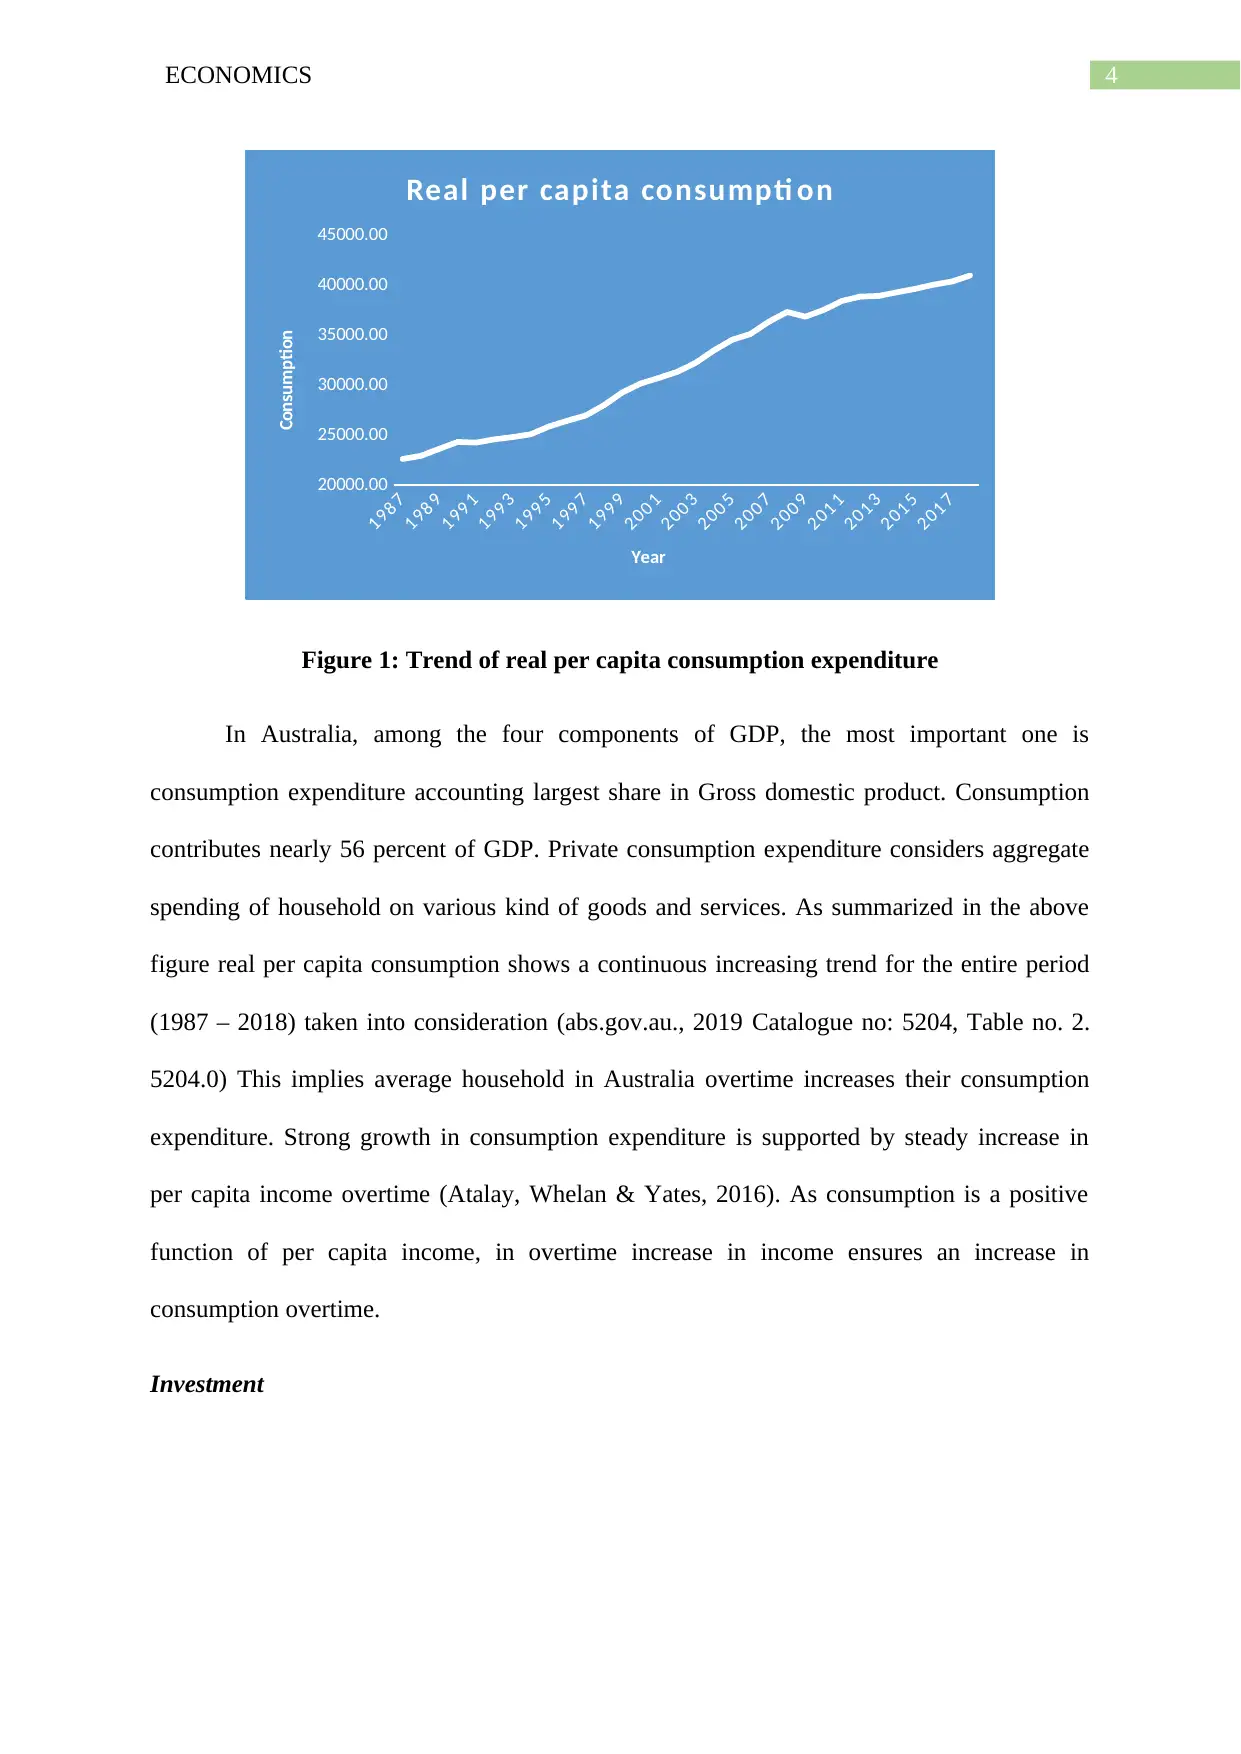
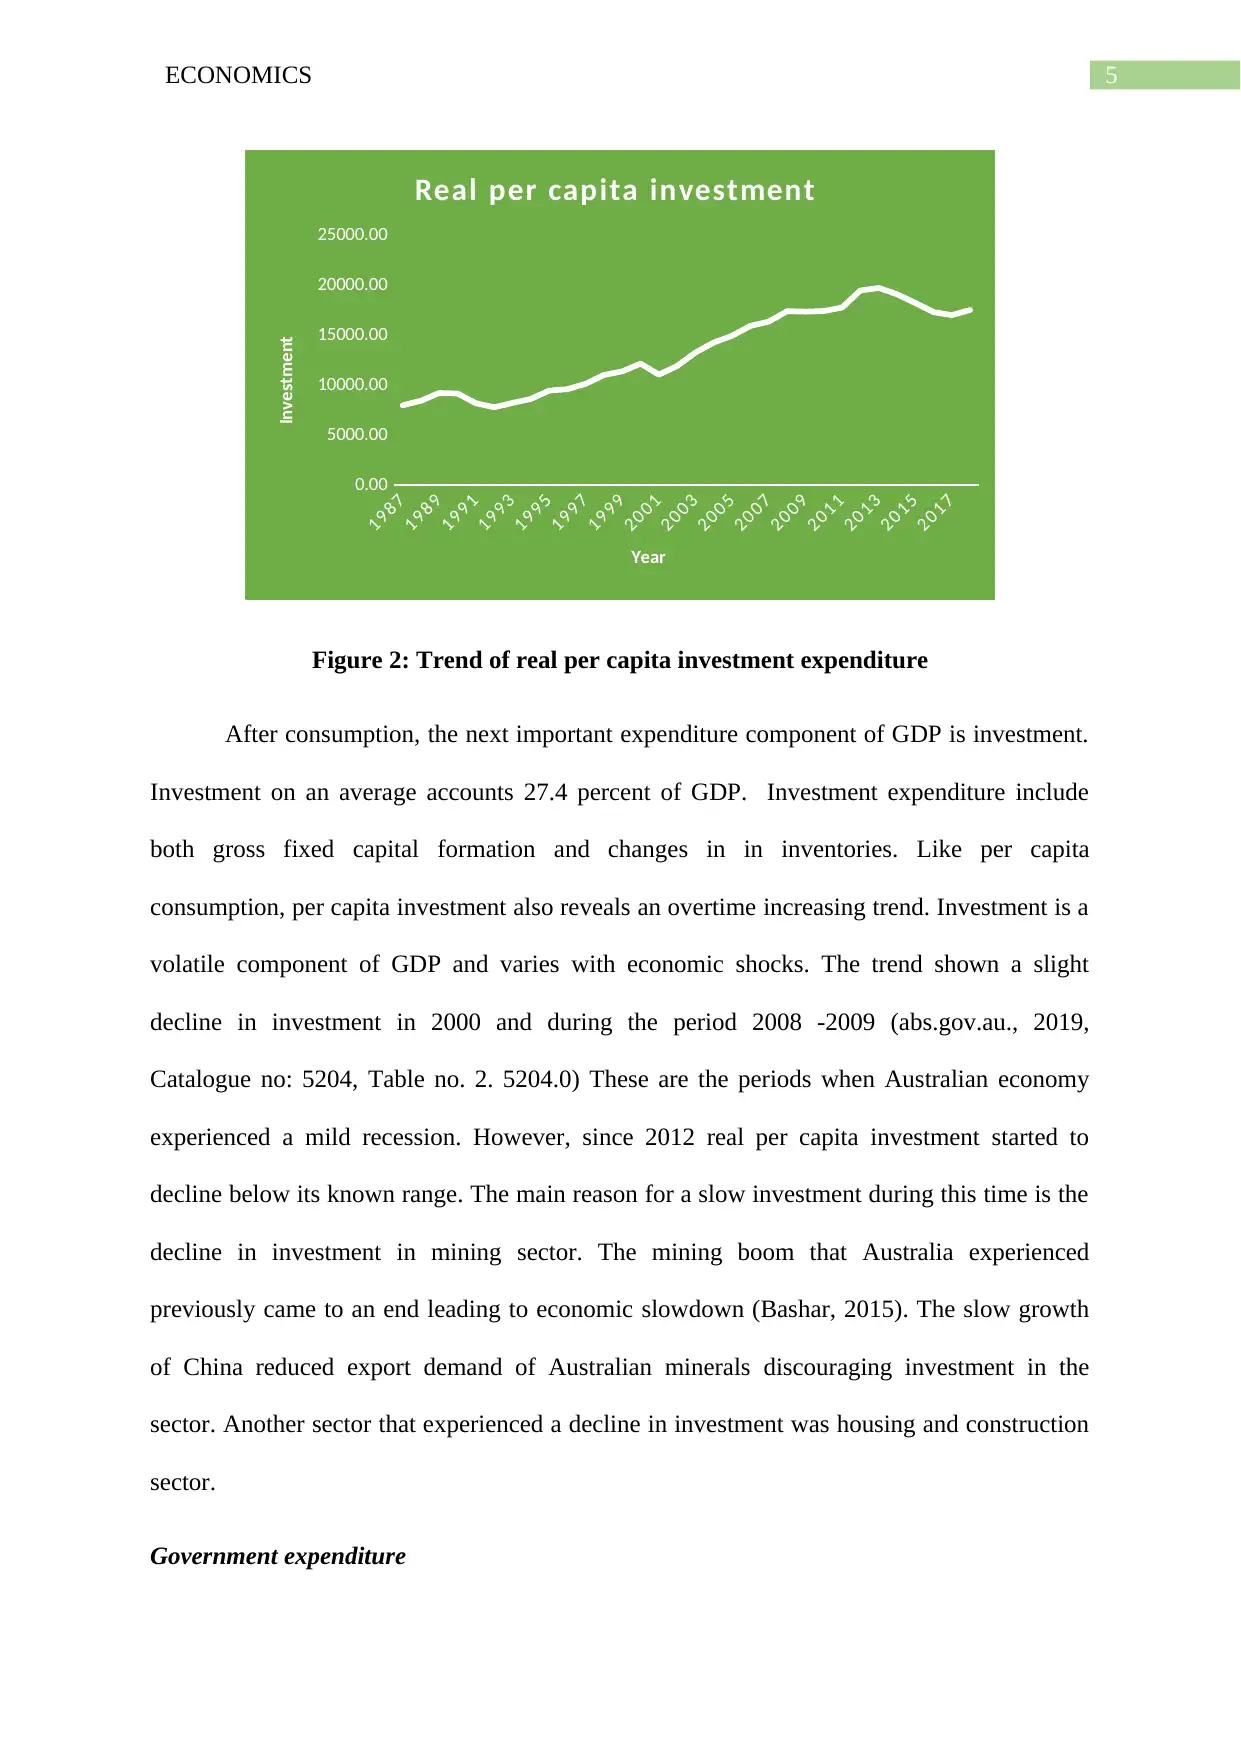
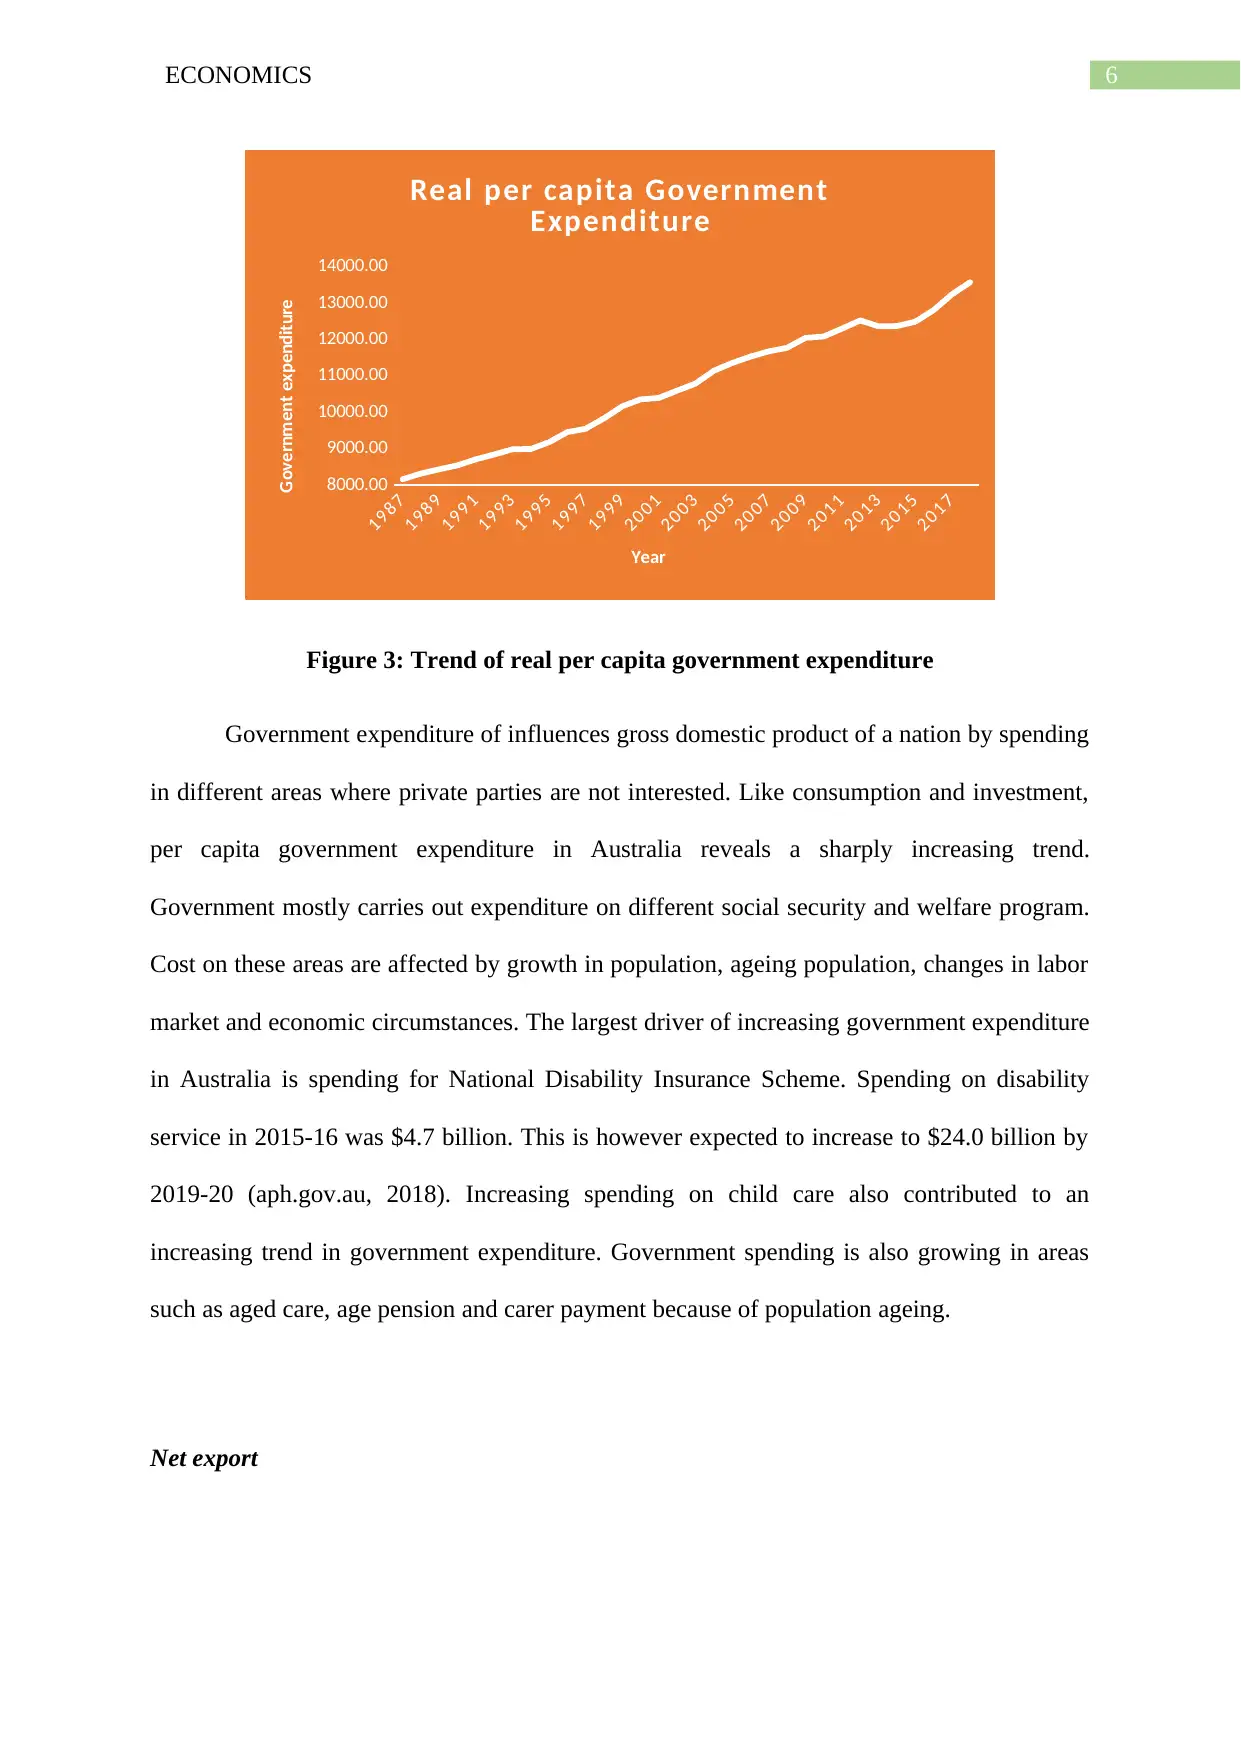
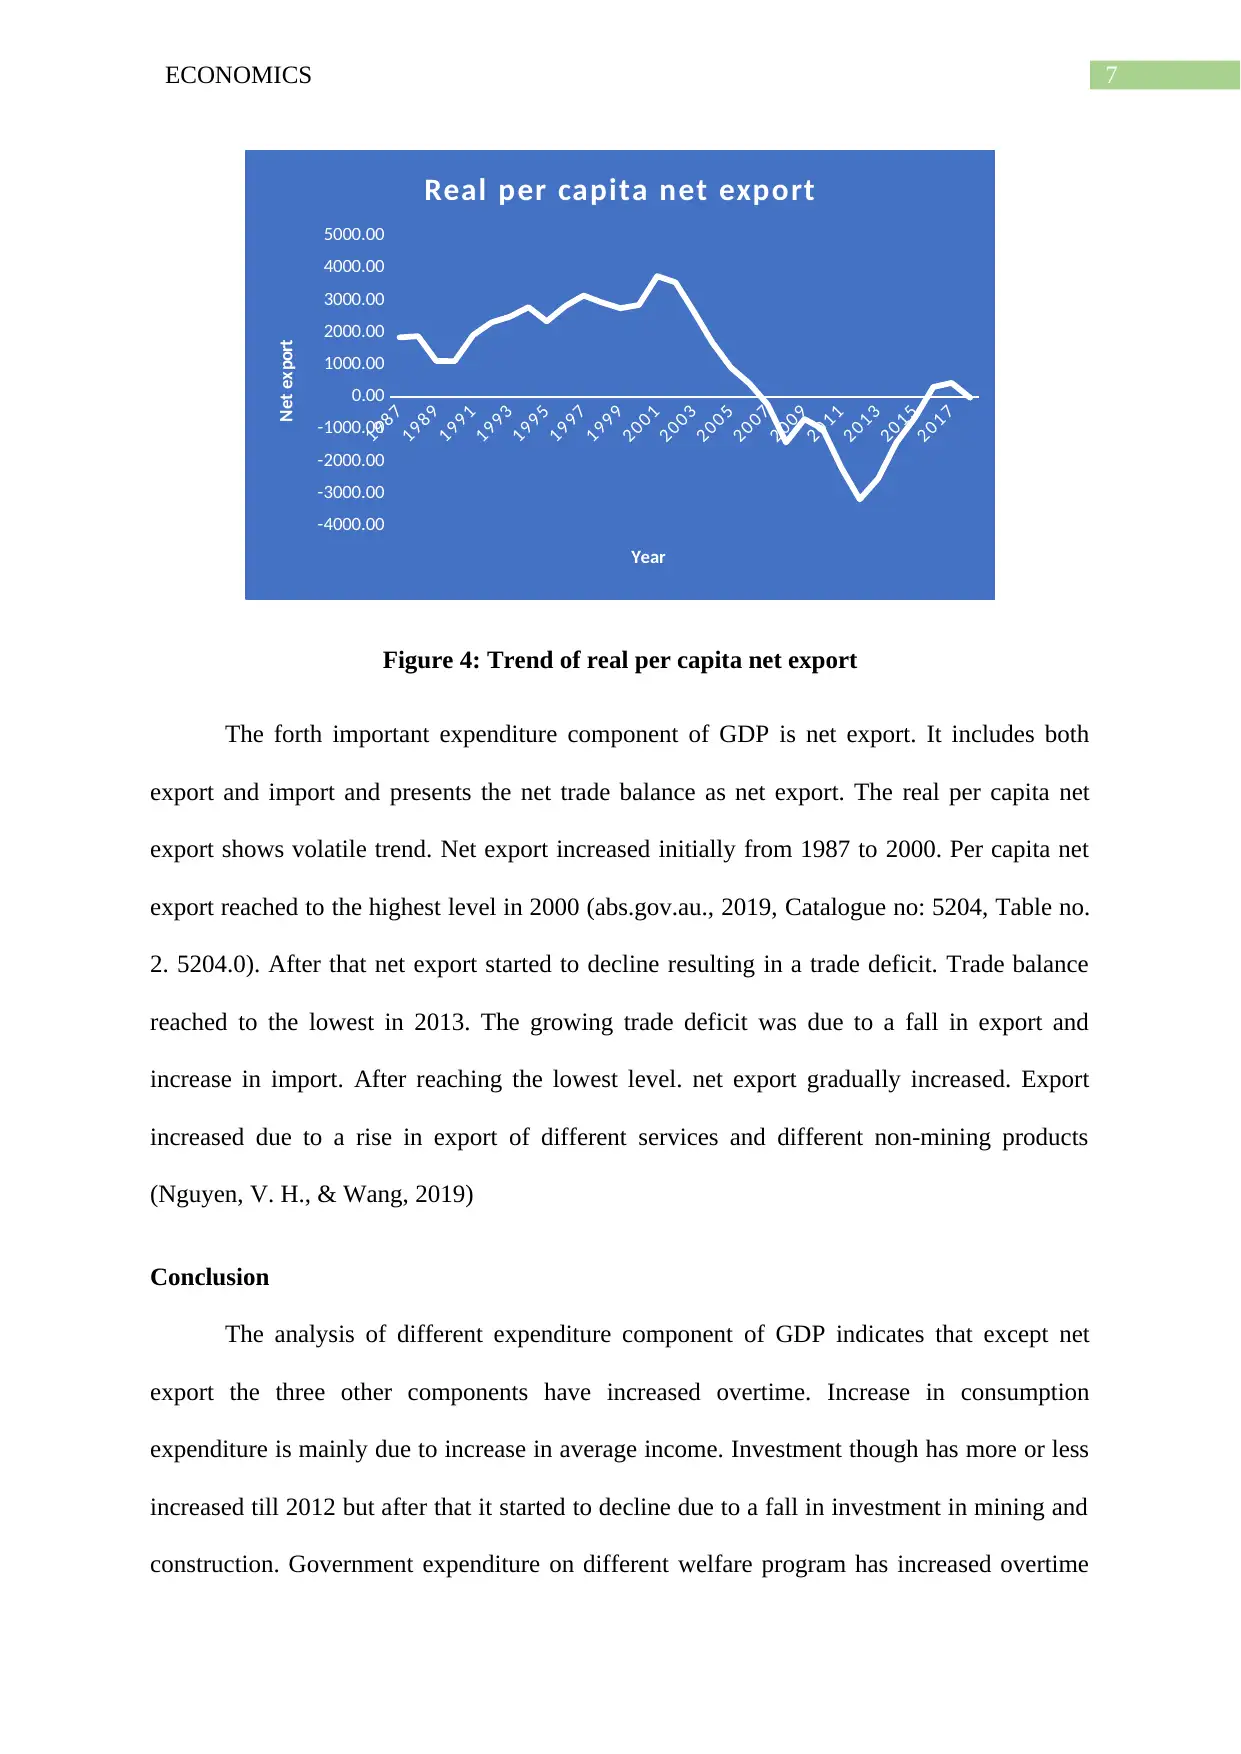
This economics report provides an analysis of the different expenditure components of Gross Domestic Product (GDP) in Australia, covering the period from 1987 to 2018. The report examines consumption, investment, government expenditure, and net exports, using real per capita data obtained from the Australian Bureau of Statistics (ABS). It highlights trends such as the continuous increase in consumption, the volatility of investment influenced by economic shocks and the decline in mining sector investment, the steady rise in government expenditure driven by social welfare programs, and the fluctuating pattern of net exports, which eventually resulted in a trade deficit. The analysis concludes that while consumption and government expenditure have generally increased, investment has declined, and net exports have shown a volatile pattern, reflecting various economic factors influencing the Australian economy.
tabler-icon-diamond-filled.svg

Contribute Materials

Your contribution can guide someone’s learning journey. Share your documents today.
Document Page
Running head: ECONOMICS
Economics
Name of the Student
Name of the University
Course ID
Student ID
tabler-icon-diamond-filled.svg

Secure Best Marks with AI Grader

Need help grading? Try our AI Grader for instant feedback on your assignments.
Document Page
1ECONOMICS
Table of Contents
Introduction................................................................................................................................2
Analysis of different expenditure components of GDP.............................................................2
Consumption..........................................................................................................................3
Investment..............................................................................................................................4
Government expenditure........................................................................................................5
Net export...............................................................................................................................6
Conclusion..................................................................................................................................6
References..................................................................................................................................8
Document Page
2ECONOMICS
Introduction
The section analyzes various components of Gross domestic production. Gross
domestic product is an aggregate measure indicating value of produced output within a
nation. Four major expenditure components of GDP are consumption, investment,
government expenditure and net export. Real per capita estimates show average estimate per
person in inflation-adjusted term. Required data has been collected from ABS and then
expressed as real per capita estimate by dividing the absolute value by total population.
Analysis of different expenditure components of GDP
Table 1: Real per capita measure of different expenditure components of GDP
Expenditure in real per capita terms
Year Consumption
Investmen
t Government Expenditure
Net
export
198
7 22640.26 8026.46 8166.57 1848.04
198
8 22950.09 8476.44 8325.36 1888.05
198
9 23659.59 9246.95 8444.02 1115.09
199
0 24343.89 9204.08 8550.09 1113.99
199
1 24283.41 8231.27 8717.54 1923.70
199
2 24598.04 7822.06 8849.05 2313.30
199
3 24828.65 8264.81 8991.15 2494.20
199
4 25115.02 8658.43 9000.34 2786.94
199
5 25898.95 9493.03 9187.61 2346.46
199
6 26473.10 9640.87 9462.75 2818.54
199
7 26994.86 10180.87 9557.64 3147.11
199
8 28034.62 11055.39 9841.16 2932.06
199
9 29306.77 11415.86 10170.77 2754.82
200 30200.51 12196.83 10362.40 2852.35
Document Page
3ECONOMICS
0
200
1 30766.47 11085.88 10404.12 3749.89
200
2 31365.27 11962.29 10604.40 3554.32
200
3 32264.89 13315.07 10796.05 2637.54
200
4 33520.75 14320.16 11151.05 1679.49
200
5 34586.10 14994.28 11361.86 916.23
200
6 35161.86 15986.15 11538.16 423.71
200
7 36389.68 16399.74 11681.75 -234.06
200
8 37361.71 17455.04 11777.63 -1410.81
200
9 36904.55 17404.99 12050.06 -682.58
201
0 37577.86 17464.14 12089.27 -998.45
201
1 38468.63 17811.85 12306.48 -2185.04
201
2 38911.20 19515.07 12530.13 -3174.06
201
3 38971.14 19782.23 12367.32 -2531.79
201
4 39343.02 19152.23 12375.63 -1410.22
201
5 39688.33 18280.12 12494.11 -644.16
201
6 40103.59 17358.65 12811.11 313.82
201
7 40410.66 17050.19 13242.56 437.97
201
8 41025.39 17564.00 13581.79 -22.63
Consumption
tabler-icon-diamond-filled.svg

Secure Best Marks with AI Grader

Need help grading? Try our AI Grader for instant feedback on your assignments.
Document Page
4ECONOMICS
198 7
198 9
199 1
199 3
199 5
199 7
199 9
200 1
200 3
200 5
200 7
200 9
201 1
201 3
201 5
201 7
20000.00
25000.00
30000.00
35000.00
40000.00
45000.00
Real per capita consumpti on
Year
Consumption
Figure 1: Trend of real per capita consumption expenditure
In Australia, among the four components of GDP, the most important one is
consumption expenditure accounting largest share in Gross domestic product. Consumption
contributes nearly 56 percent of GDP. Private consumption expenditure considers aggregate
spending of household on various kind of goods and services. As summarized in the above
figure real per capita consumption shows a continuous increasing trend for the entire period
(1987 – 2018) taken into consideration (abs.gov.au., 2019 Catalogue no: 5204, Table no. 2.
5204.0) This implies average household in Australia overtime increases their consumption
expenditure. Strong growth in consumption expenditure is supported by steady increase in
per capita income overtime (Atalay, Whelan & Yates, 2016). As consumption is a positive
function of per capita income, in overtime increase in income ensures an increase in
consumption overtime.
Investment
Document Page
5ECONOMICS
198 7
198 9
199 1
199 3
199 5
199 7
199 9
200 1
200 3
200 5
200 7
200 9
201 1
201 3
201 5
201 7
0.00
5000.00
10000.00
15000.00
20000.00
25000.00
Real per capita investment
Year
Investment
Figure 2: Trend of real per capita investment expenditure
After consumption, the next important expenditure component of GDP is investment.
Investment on an average accounts 27.4 percent of GDP. Investment expenditure include
both gross fixed capital formation and changes in in inventories. Like per capita
consumption, per capita investment also reveals an overtime increasing trend. Investment is a
volatile component of GDP and varies with economic shocks. The trend shown a slight
decline in investment in 2000 and during the period 2008 -2009 (abs.gov.au., 2019,
Catalogue no: 5204, Table no. 2. 5204.0) These are the periods when Australian economy
experienced a mild recession. However, since 2012 real per capita investment started to
decline below its known range. The main reason for a slow investment during this time is the
decline in investment in mining sector. The mining boom that Australia experienced
previously came to an end leading to economic slowdown (Bashar, 2015). The slow growth
of China reduced export demand of Australian minerals discouraging investment in the
sector. Another sector that experienced a decline in investment was housing and construction
sector.
Government expenditure
Document Page
6ECONOMICS
198 7
198 9
199 1
199 3
199 5
199 7
199 9
200 1
200 3
200 5
200 7
200 9
201 1
201 3
201 5
201 7
8000.00
9000.00
10000.00
11000.00
12000.00
13000.00
14000.00
Real per capita Government
Expenditure
Year
Government expenditure
Figure 3: Trend of real per capita government expenditure
Government expenditure of influences gross domestic product of a nation by spending
in different areas where private parties are not interested. Like consumption and investment,
per capita government expenditure in Australia reveals a sharply increasing trend.
Government mostly carries out expenditure on different social security and welfare program.
Cost on these areas are affected by growth in population, ageing population, changes in labor
market and economic circumstances. The largest driver of increasing government expenditure
in Australia is spending for National Disability Insurance Scheme. Spending on disability
service in 2015-16 was $4.7 billion. This is however expected to increase to $24.0 billion by
2019-20 (aph.gov.au, 2018). Increasing spending on child care also contributed to an
increasing trend in government expenditure. Government spending is also growing in areas
such as aged care, age pension and carer payment because of population ageing.
Net export
tabler-icon-diamond-filled.svg

Paraphrase This Document

Need a fresh take? Get an instant paraphrase of this document with our AI Paraphraser
Document Page
7ECONOMICS
198 7
198 9
199 1
199 3
199 5
199 7
199 9
200 1
200 3
200 5
200 7
200 9
201 1
201 3
201 5
201 7
-4000.00
-3000.00
-2000.00
-1000.00
0.00
1000.00
2000.00
3000.00
4000.00
5000.00
Real per capita net export
Year
Net export
Figure 4: Trend of real per capita net export
The forth important expenditure component of GDP is net export. It includes both
export and import and presents the net trade balance as net export. The real per capita net
export shows volatile trend. Net export increased initially from 1987 to 2000. Per capita net
export reached to the highest level in 2000 (abs.gov.au., 2019, Catalogue no: 5204, Table no.
2. 5204.0). After that net export started to decline resulting in a trade deficit. Trade balance
reached to the lowest in 2013. The growing trade deficit was due to a fall in export and
increase in import. After reaching the lowest level. net export gradually increased. Export
increased due to a rise in export of different services and different non-mining products
(Nguyen, V. H., & Wang, 2019)
Conclusion
The analysis of different expenditure component of GDP indicates that except net
export the three other components have increased overtime. Increase in consumption
expenditure is mainly due to increase in average income. Investment though has more or less
increased till 2012 but after that it started to decline due to a fall in investment in mining and
construction. Government expenditure on different welfare program has increased overtime
Document Page
8ECONOMICS
because of the problem of ageing population. A fall in export along with an increase in
import resulted in trade deficit for Australia.
Document Page
9ECONOMICS
References
abs.gov.au. (2016). Catalogue no: 3105, Table no. 1.1. 3105.0.65.001 - Australian Historical
Population Statistics, 2016. Retrieved from
https://www.abs.gov.au/AUSSTATS/abs@.nsf/DetailsPage/3105.0.65.0012016?
OpenDocument
abs.gov.au. (2019). Catalogue no: 3101, Table no. 4 3101.0 - Australian Demographic
Statistics, Sep 2018. Retrieved from
https://www.abs.gov.au/AUSSTATS/abs@.nsf/DetailsPage/3101.0Sep%202018?
OpenDocument
abs.gov.au. (2019). Catalogue no: 5204, Table no. 2. 5204.0 - Australian System of National
Accounts, 2017-18. Retrieved from
https://www.abs.gov.au/AUSSTATS/abs@.nsf/DetailsPage/5204.02017-18?
OpenDocument
aph.gov.au. (2018). Welfare—what does it cost? – Parliament of Australia. Retrieved from
https://www.aph.gov.au/About_Parliament/Parliamentary_Departments/
Parliamentary_Library/pubs/BriefingBook45p/WelfareCost
Atalay, K., Whelan, S., & Yates, J. (2016). House Prices, Wealth and Consumption: New
Evidence from A ustralia and C anada. Review of Income and Wealth, 62(1), 69-91.
Bashar, O. H. (2015). The Trickle‐down Effect of the Mining Boom in Australia: Fact or
Myth?. Economic record, 91, 94-108.
Nguyen, V. H., & Wang, J. (2019). The Australian Economy in 2018–2019: Convergence in
Economic Activity across Australia. Australian Economic Review, 52(1), 5-18.
chevron_up_icon
1 out of 10
circle_padding
hide_on_mobile
zoom_out_icon
logo.png

Your All-in-One AI-Powered Toolkit for Academic Success.

Available 24*7 on WhatsApp / Email

[object Object]