Business Economics Essay - GDP, Monopoly, and Aggregate Demand/Supply
VerifiedAdded on 2021/08/10
|10
|1831
|67
Essay
AI Summary
This essay, prepared for a Business Economics course, examines GDP trends across several countries from 2010 to 2019, analyzing changes in GDP PPP and related economic indicators such as unemployment rates. The first part of the essay involves a detailed analysis of the provided data in tables and figures. The second part of the essay defines and discusses the concept of 'state restraining infrastructure' in the context of Vietnam, explaining how it relates to state monopolies and price discrimination. The essay also identifies and explains the different types of price discrimination. Finally, the essay concludes with the application of an aggregate demand/aggregate supply (AD-AS) model, referencing relevant economic principles and sources to illustrate economic concepts and relationships.
Date: 24 November 2020
Course: Business Economics
School: HCMUTE IEEC - Higher Diploma in Business
Assignment: Essay Assessment
Student Name: Vo Tran Duc Phat
Student ID: 19NT13222
Answers to Question 1
Sample Description of GDP 2017 PPP$
Table 1
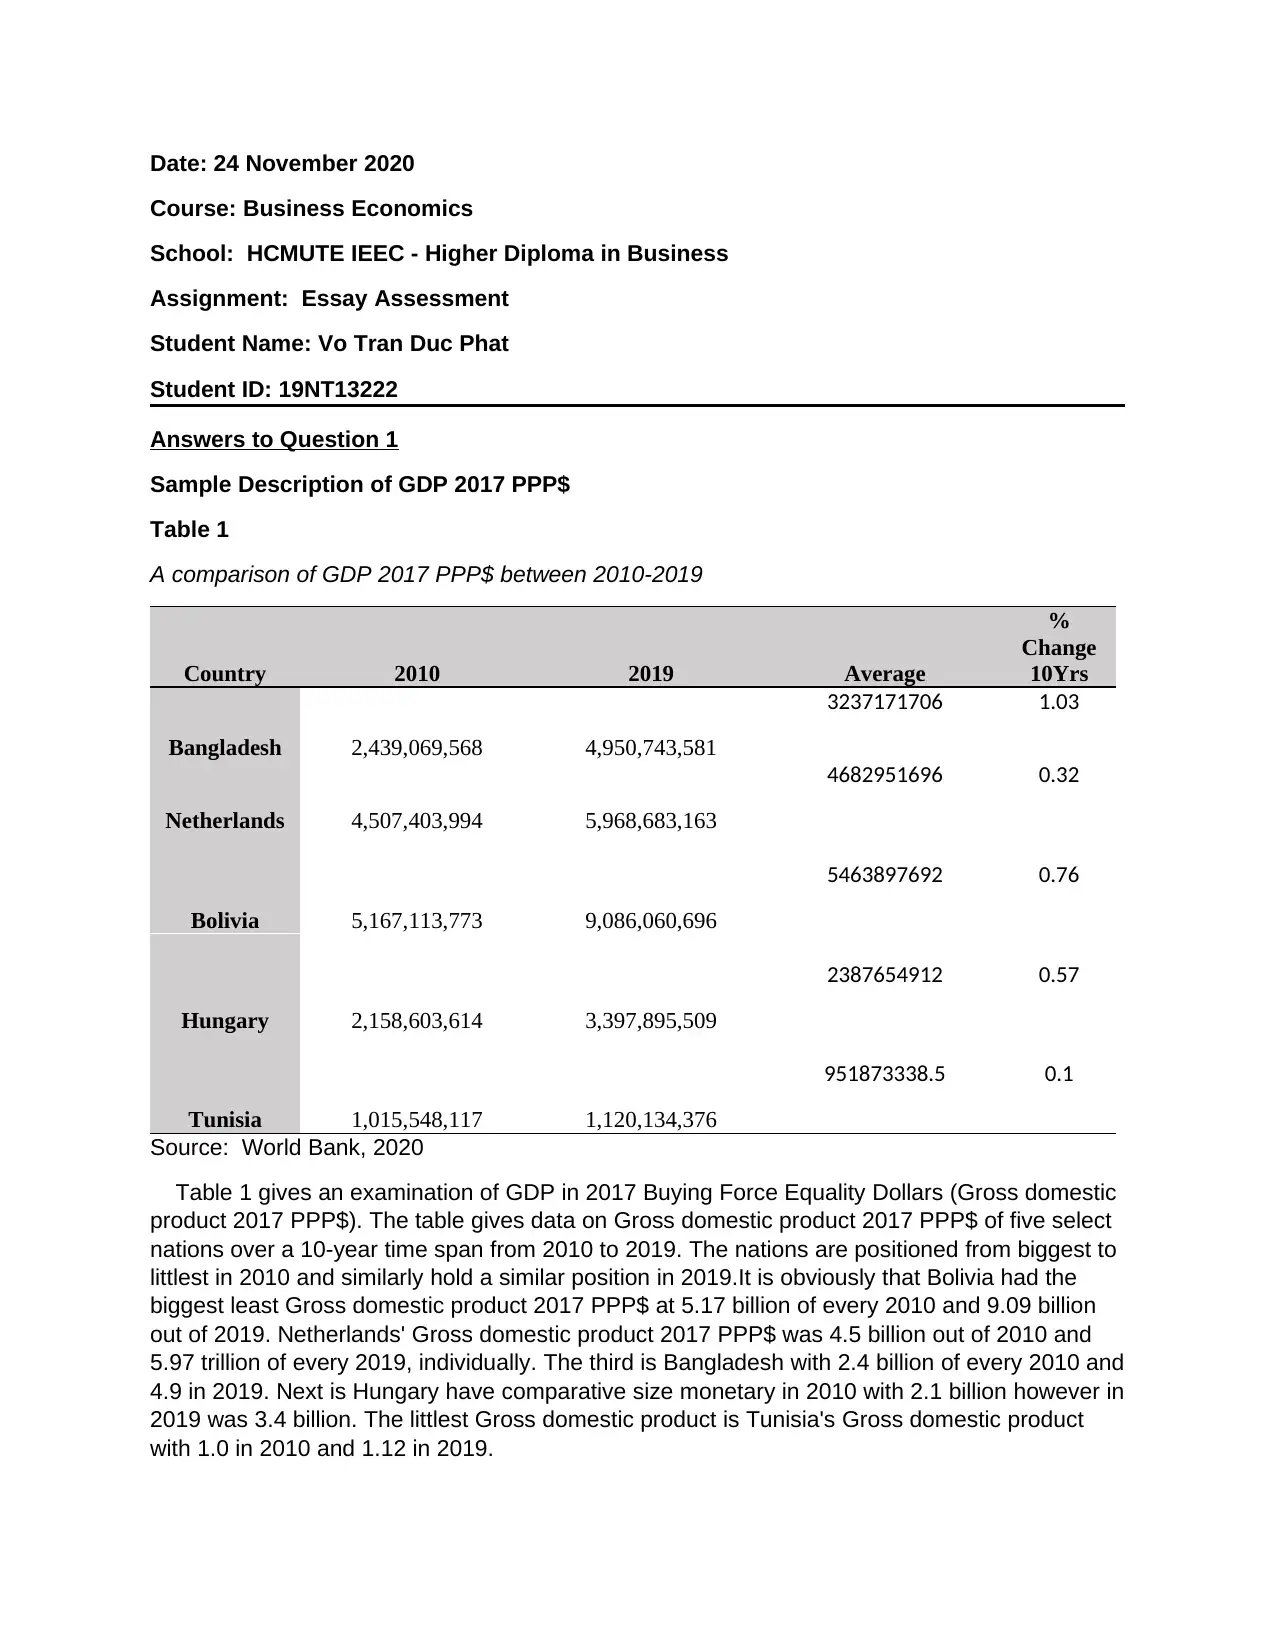
A comparison of GDP 2017 PPP$ between 2010-2019
Country 2010 2019 Average
%
Change
10Yrs
Bangladesh 2,439,069,568 4,950,743,581
3237171706 1.03
Netherlands 4,507,403,994 5,968,683,163
4682951696 0.32
Bolivia 5,167,113,773 9,086,060,696
5463897692 0.76
Hungary 2,158,603,614 3,397,895,509
2387654912 0.57
Tunisia 1,015,548,117 1,120,134,376
951873338.5 0.1
Source: World Bank, 2020
Table 1 gives an examination of GDP in 2017 Buying Force Equality Dollars (Gross domestic
product 2017 PPP$). The table gives data on Gross domestic product 2017 PPP$ of five select
nations over a 10-year time span from 2010 to 2019. The nations are positioned from biggest to
littlest in 2010 and similarly hold a similar position in 2019.It is obviously that Bolivia had the
biggest least Gross domestic product 2017 PPP$ at 5.17 billion of every 2010 and 9.09 billion
out of 2019. Netherlands' Gross domestic product 2017 PPP$ was 4.5 billion out of 2010 and
5.97 trillion of every 2019, individually. The third is Bangladesh with 2.4 billion of every 2010 and
4.9 in 2019. Next is Hungary have comparative size monetary in 2010 with 2.1 billion however in
2019 was 3.4 billion. The littlest Gross domestic product is Tunisia's Gross domestic product
with 1.0 in 2010 and 1.12 in 2019.
Course: Business Economics
School: HCMUTE IEEC - Higher Diploma in Business
Assignment: Essay Assessment
Student Name: Vo Tran Duc Phat
Student ID: 19NT13222
Answers to Question 1
Sample Description of GDP 2017 PPP$
Table 1
A comparison of GDP 2017 PPP$ between 2010-2019
Country 2010 2019 Average
%
Change
10Yrs
Bangladesh 2,439,069,568 4,950,743,581
3237171706 1.03
Netherlands 4,507,403,994 5,968,683,163
4682951696 0.32
Bolivia 5,167,113,773 9,086,060,696
5463897692 0.76
Hungary 2,158,603,614 3,397,895,509
2387654912 0.57
Tunisia 1,015,548,117 1,120,134,376
951873338.5 0.1
Source: World Bank, 2020
Table 1 gives an examination of GDP in 2017 Buying Force Equality Dollars (Gross domestic
product 2017 PPP$). The table gives data on Gross domestic product 2017 PPP$ of five select
nations over a 10-year time span from 2010 to 2019. The nations are positioned from biggest to
littlest in 2010 and similarly hold a similar position in 2019.It is obviously that Bolivia had the
biggest least Gross domestic product 2017 PPP$ at 5.17 billion of every 2010 and 9.09 billion
out of 2019. Netherlands' Gross domestic product 2017 PPP$ was 4.5 billion out of 2010 and
5.97 trillion of every 2019, individually. The third is Bangladesh with 2.4 billion of every 2010 and
4.9 in 2019. Next is Hungary have comparative size monetary in 2010 with 2.1 billion however in
2019 was 3.4 billion. The littlest Gross domestic product is Tunisia's Gross domestic product
with 1.0 in 2010 and 1.12 in 2019.
Paraphrase This Document
Need a fresh take? Get an instant paraphrase of this document with our AI Paraphraser
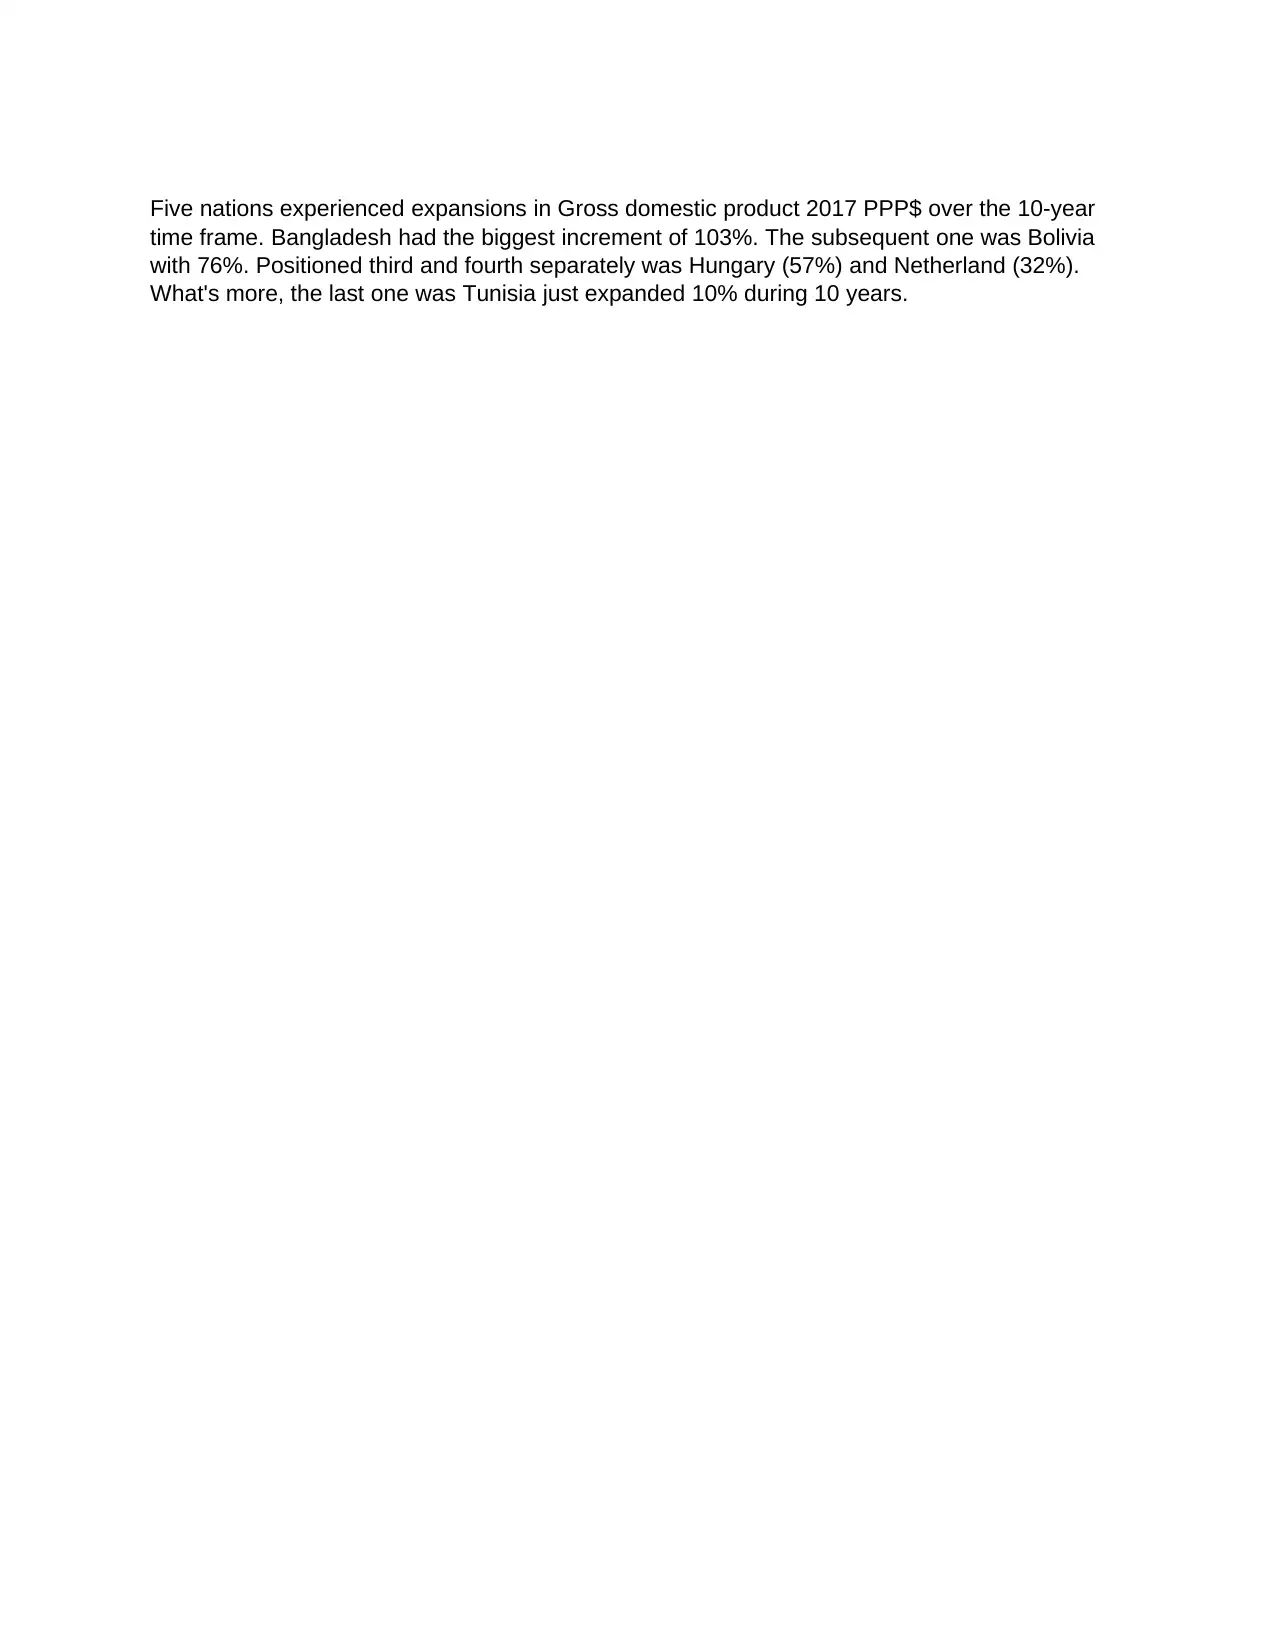
Five nations experienced expansions in Gross domestic product 2017 PPP$ over the 10-year
time frame. Bangladesh had the biggest increment of 103%. The subsequent one was Bolivia
with 76%. Positioned third and fourth separately was Hungary (57%) and Netherland (32%).
What's more, the last one was Tunisia just expanded 10% during 10 years.
time frame. Bangladesh had the biggest increment of 103%. The subsequent one was Bolivia
with 76%. Positioned third and fourth separately was Hungary (57%) and Netherland (32%).
What's more, the last one was Tunisia just expanded 10% during 10 years.
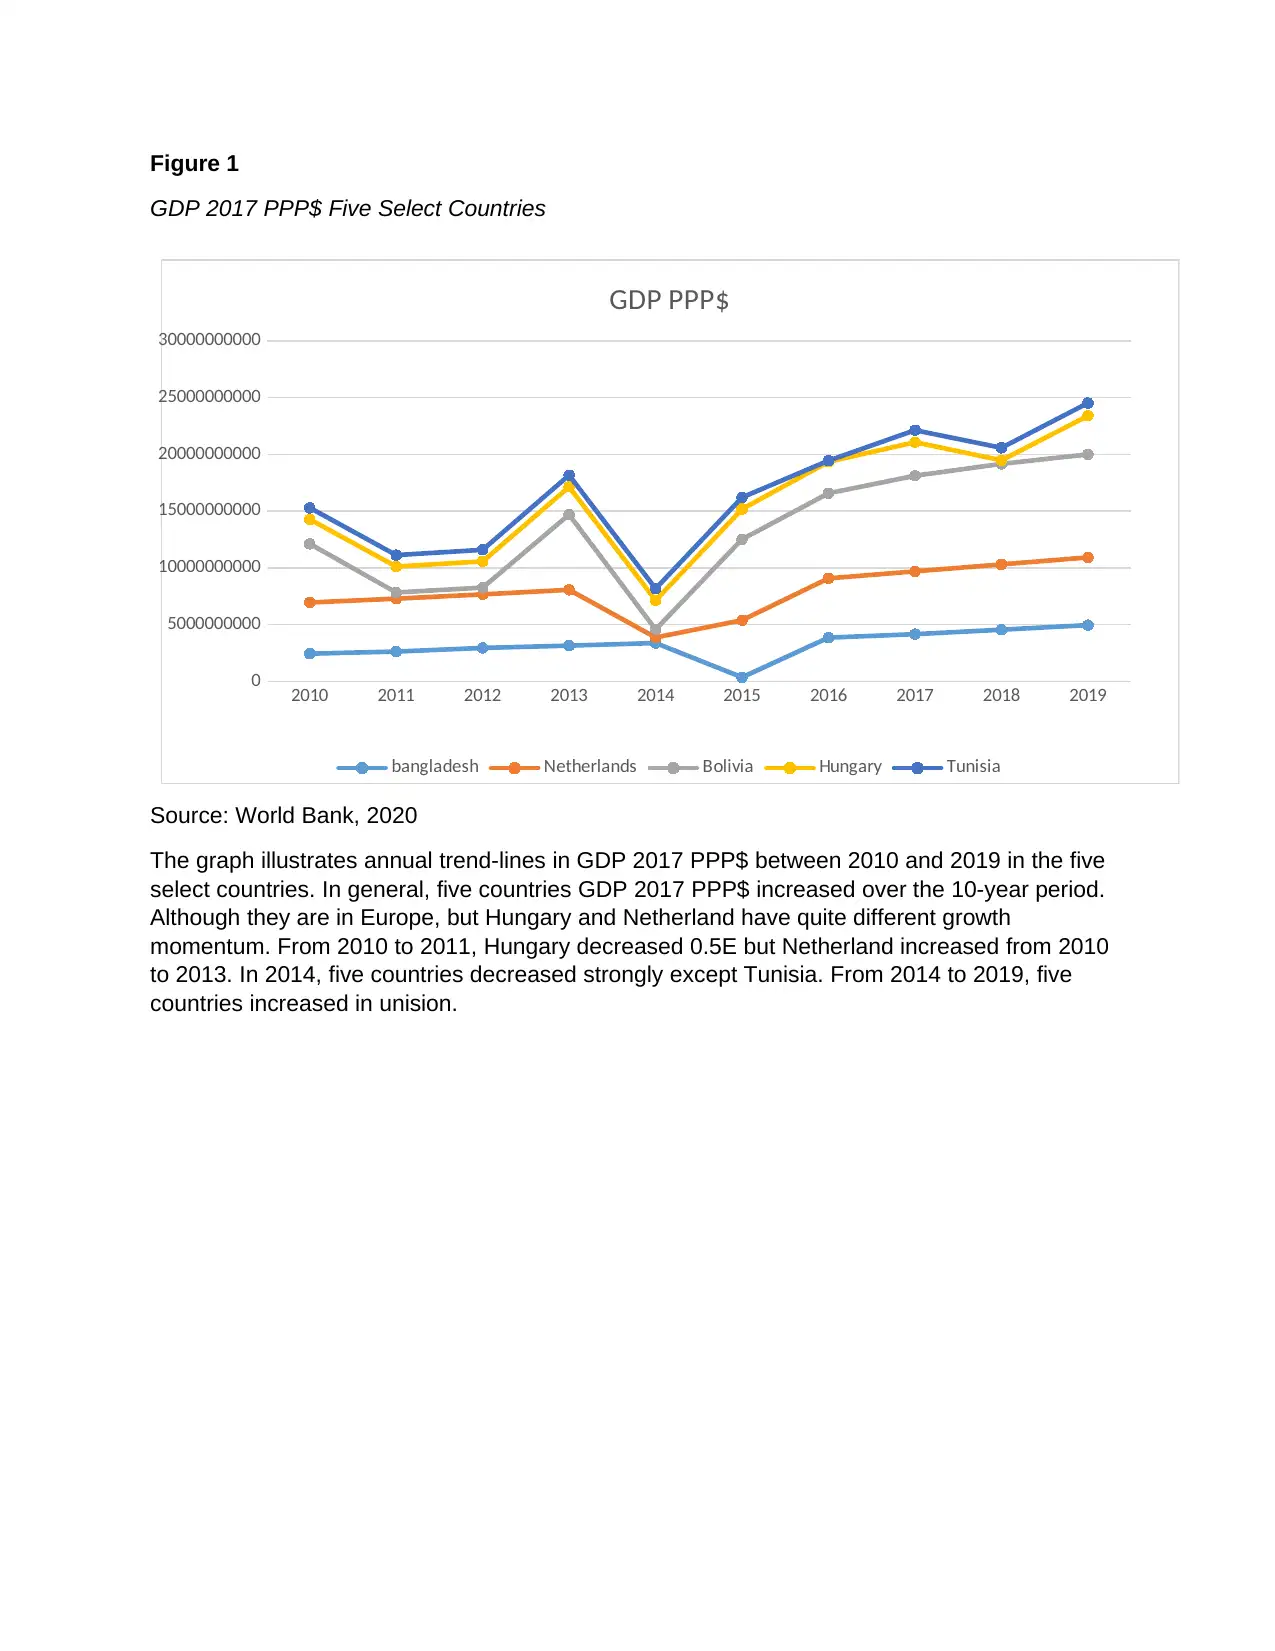
Figure 1
GDP 2017 PPP$ Five Select Countries
Source: World Bank, 2020
The graph illustrates annual trend-lines in GDP 2017 PPP$ between 2010 and 2019 in the five
select countries. In general, five countries GDP 2017 PPP$ increased over the 10-year period.
Although they are in Europe, but Hungary and Netherland have quite different growth
momentum. From 2010 to 2011, Hungary decreased 0.5E but Netherland increased from 2010
to 2013. In 2014, five countries decreased strongly except Tunisia. From 2014 to 2019, five
countries increased in unision.
Uganda
Vietnam, Bangladesh
Brazil
2010 2011 2012 2013 2014 2015 2016 2017 2018 2019
0
5000000000
10000000000
15000000000
20000000000
25000000000
30000000000
GDP PPP$
bangladesh Netherlands Bolivia Hungary Tunisia
⊘ This is a preview!⊘
Do you want full access?
Subscribe today to unlock all pages.
Trusted by 1+ million students worldwide
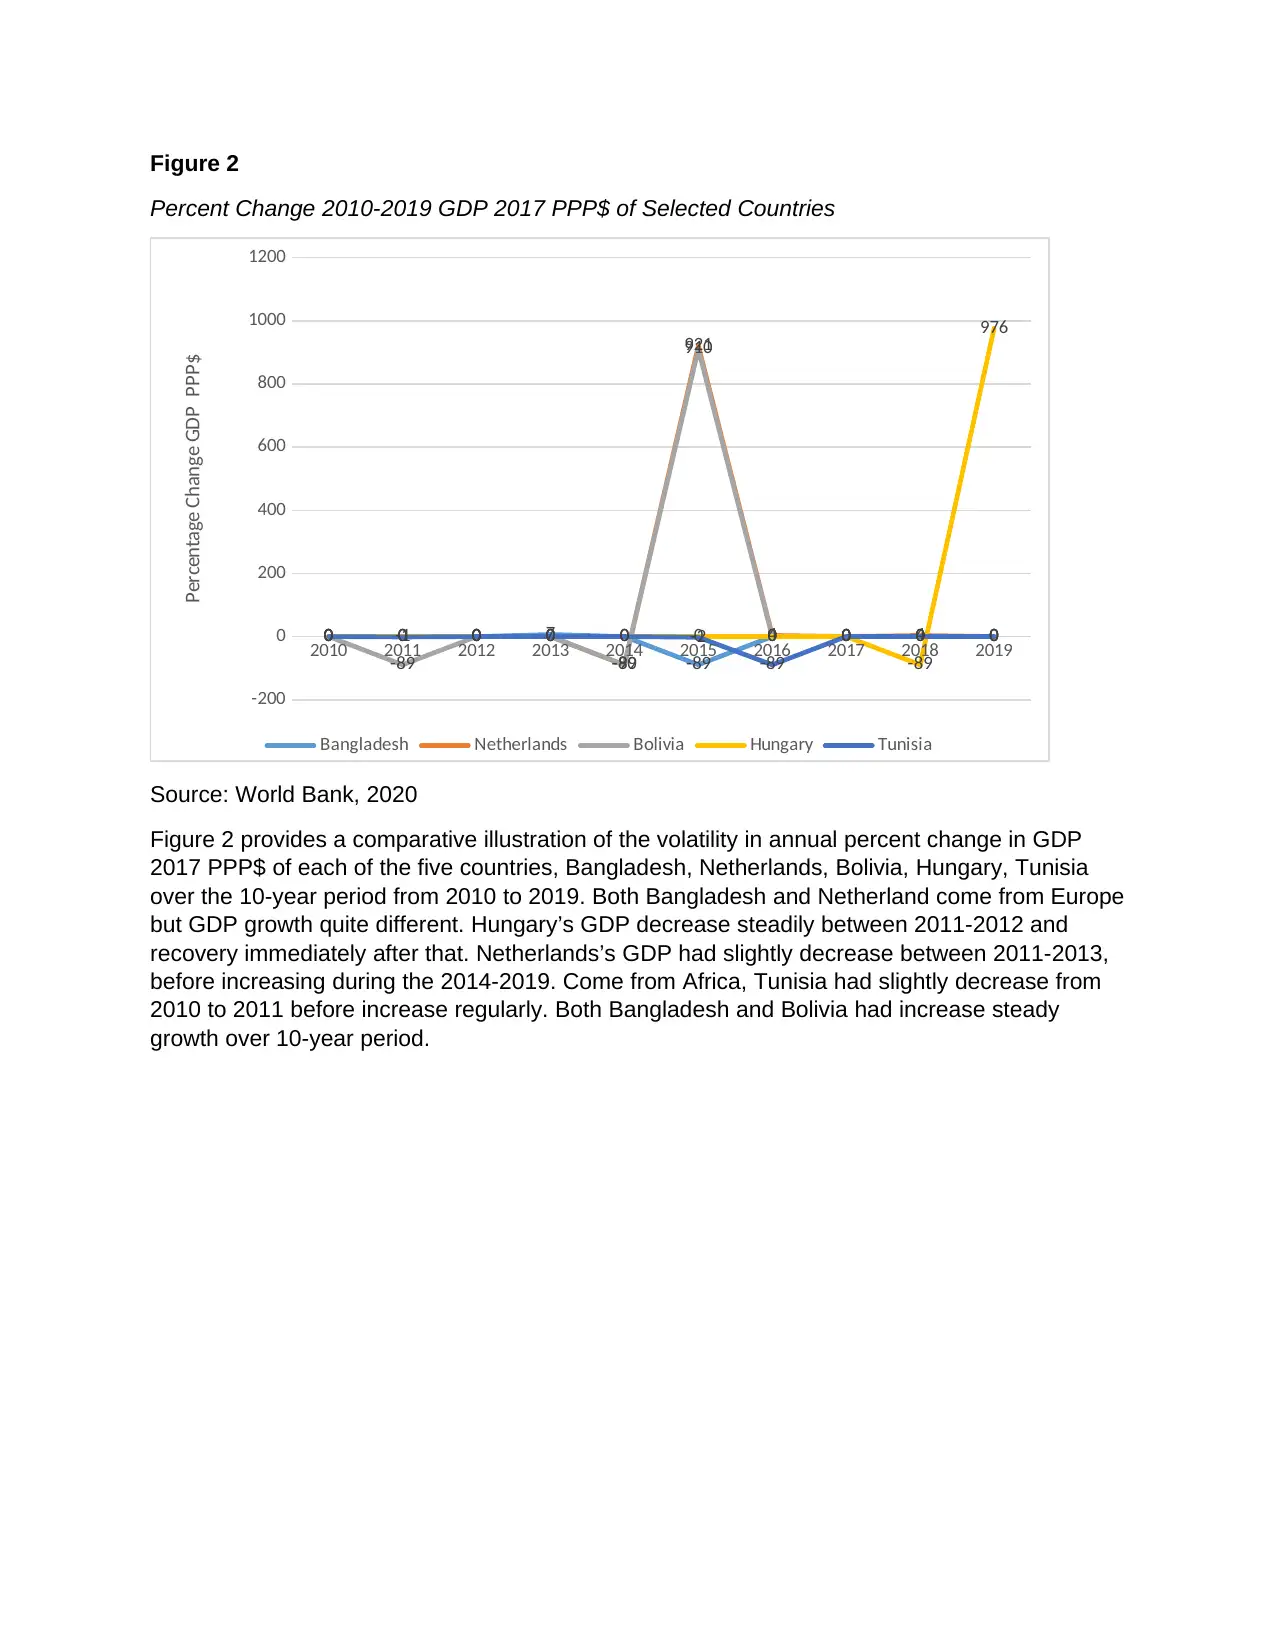
Figure 2
Percent Change 2010-2019 GDP 2017 PPP$ of Selected Countries
Source: World Bank, 2020
Figure 2 provides a comparative illustration of the volatility in annual percent change in GDP
2017 PPP$ of each of the five countries, Bangladesh, Netherlands, Bolivia, Hungary, Tunisia
over the 10-year period from 2010 to 2019. Both Bangladesh and Netherland come from Europe
but GDP growth quite different. Hungary’s GDP decrease steadily between 2011-2012 and
recovery immediately after that. Netherlands’s GDP had slightly decrease between 2011-2013,
before increasing during the 2014-2019. Come from Africa, Tunisia had slightly decrease from
2010 to 2011 before increase regularly. Both Bangladesh and Bolivia had increase steady
growth over 10-year period.
Vietnam, Bangladesh
Brazil
Germany
Uganda
2010 2011 2012 2013 2014 2015 2016 2017 2018 2019
-200
0
200
400
600
800
1000
1200
0 0 0 7 0
-89
0 0 0 00 0 0 0
-90
921
4 0 4 00
-89
0 0
-89
910
0 0 0 00 0 0 0 0 0 0 0
-89
976
0 -1 0 0 0 -2
-89
0 0 0
Bangladesh Netherlands Bolivia Hungary Tunisia
Percentage Change GDP PPP$
Paraphrase This Document
Need a fresh take? Get an instant paraphrase of this document with our AI Paraphraser
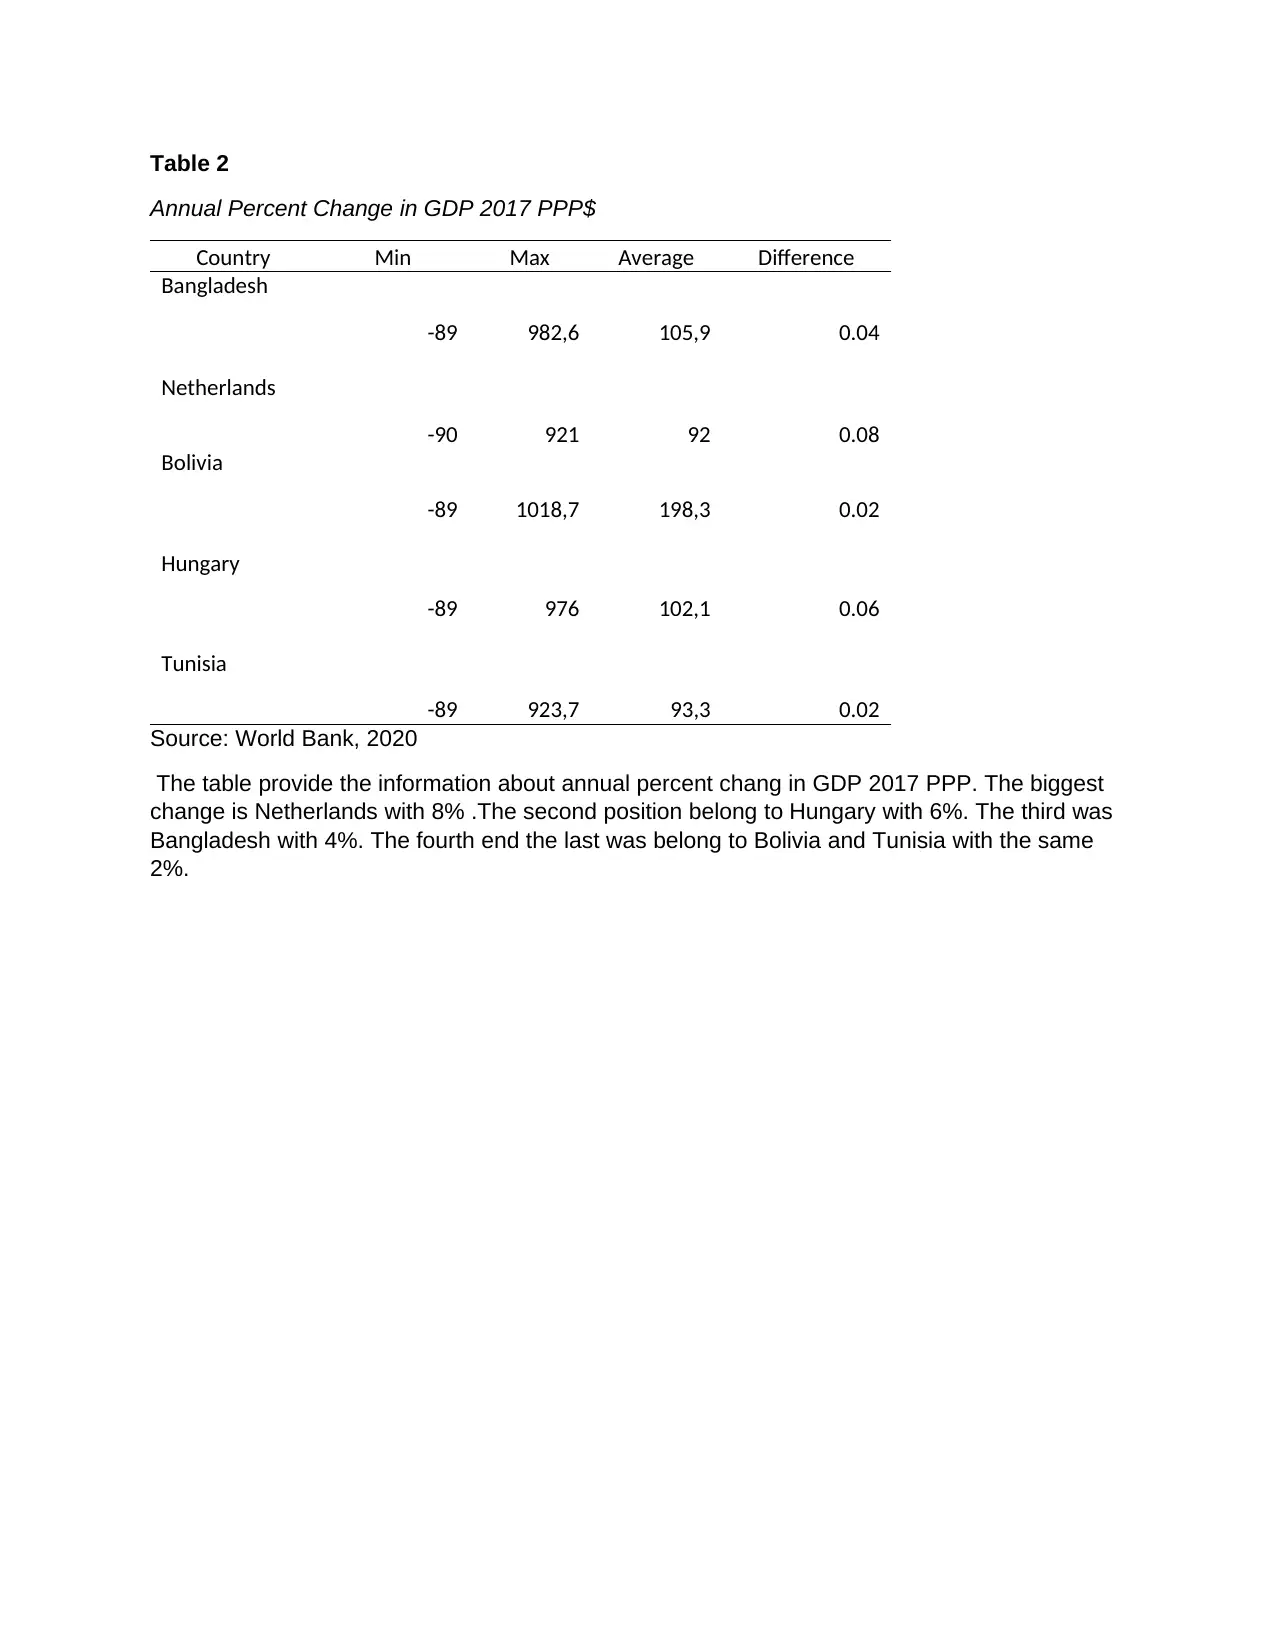
Table 2
Annual Percent Change in GDP 2017 PPP$
Country Min Max Average Difference
Bangladesh
-89 982,6 105,9 0.04
Netherlands
-90 921 92 0.08
Bolivia
-89 1018,7 198,3 0.02
Hungary
-89 976 102,1 0.06
Tunisia
-89 923,7 93,3 0.02
Source: World Bank, 2020
The table provide the information about annual percent chang in GDP 2017 PPP. The biggest
change is Netherlands with 8% .The second position belong to Hungary with 6%. The third was
Bangladesh with 4%. The fourth end the last was belong to Bolivia and Tunisia with the same
2%.
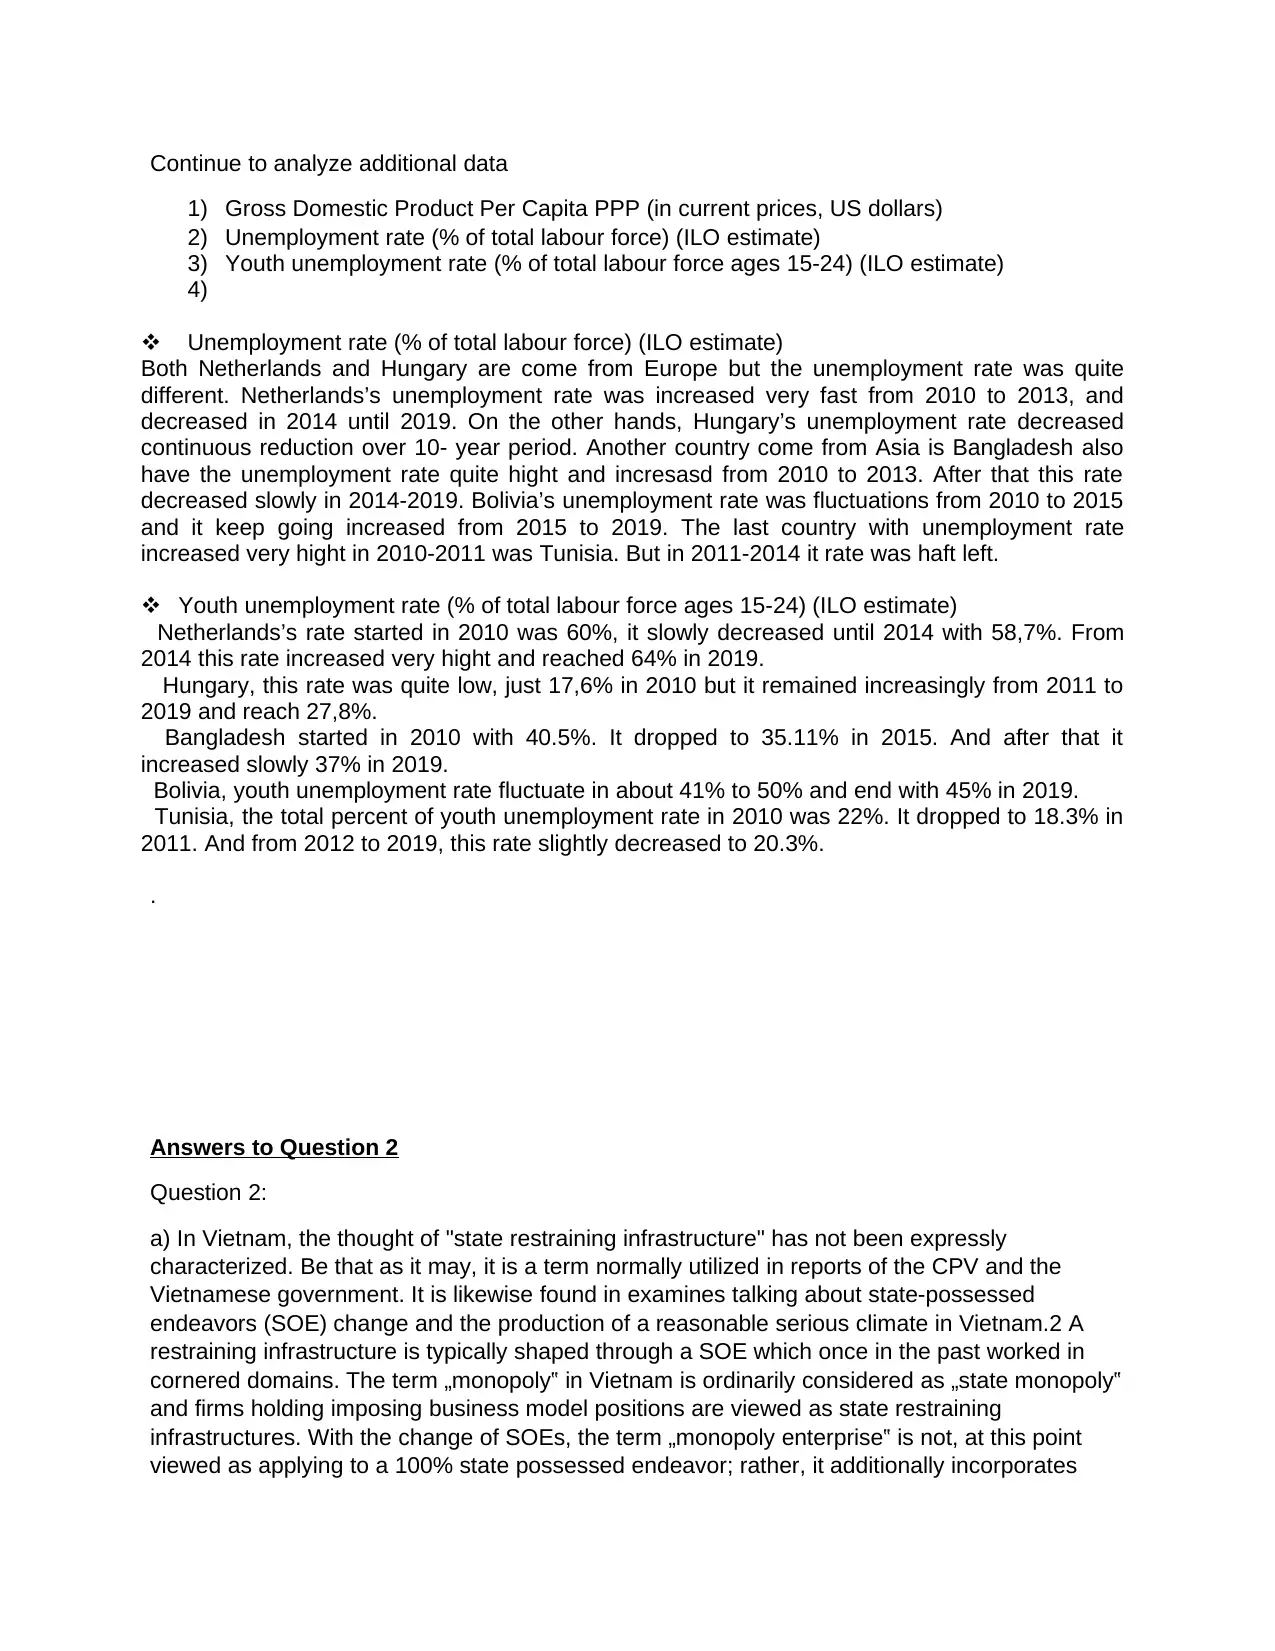
Continue to analyze additional data
1) Gross Domestic Product Per Capita PPP (in current prices, US dollars)
2) Unemployment rate (% of total labour force) (ILO estimate)
3) Youth unemployment rate (% of total labour force ages 15-24) (ILO estimate)
4)
Unemployment rate (% of total labour force) (ILO estimate)
Both Netherlands and Hungary are come from Europe but the unemployment rate was quite
different. Netherlands’s unemployment rate was increased very fast from 2010 to 2013, and
decreased in 2014 until 2019. On the other hands, Hungary’s unemployment rate decreased
continuous reduction over 10- year period. Another country come from Asia is Bangladesh also
have the unemployment rate quite hight and incresasd from 2010 to 2013. After that this rate
decreased slowly in 2014-2019. Bolivia’s unemployment rate was fluctuations from 2010 to 2015
and it keep going increased from 2015 to 2019. The last country with unemployment rate
increased very hight in 2010-2011 was Tunisia. But in 2011-2014 it rate was haft left.
Youth unemployment rate (% of total labour force ages 15-24) (ILO estimate)
Netherlands’s rate started in 2010 was 60%, it slowly decreased until 2014 with 58,7%. From
2014 this rate increased very hight and reached 64% in 2019.
Hungary, this rate was quite low, just 17,6% in 2010 but it remained increasingly from 2011 to
2019 and reach 27,8%.
Bangladesh started in 2010 with 40.5%. It dropped to 35.11% in 2015. And after that it
increased slowly 37% in 2019.
Bolivia, youth unemployment rate fluctuate in about 41% to 50% and end with 45% in 2019.
Tunisia, the total percent of youth unemployment rate in 2010 was 22%. It dropped to 18.3% in
2011. And from 2012 to 2019, this rate slightly decreased to 20.3%.
.
Answers to Question 2
Question 2:
a) In Vietnam, the thought of "state restraining infrastructure" has not been expressly
characterized. Be that as it may, it is a term normally utilized in reports of the CPV and the
Vietnamese government. It is likewise found in examines talking about state-possessed
endeavors (SOE) change and the production of a reasonable serious climate in Vietnam.2 A
restraining infrastructure is typically shaped through a SOE which once in the past worked in
cornered domains. The term „monopoly‟ in Vietnam is ordinarily considered as „state monopoly‟
and firms holding imposing business model positions are viewed as state restraining
infrastructures. With the change of SOEs, the term „monopoly enterprise‟ is not, at this point
viewed as applying to a 100% state possessed endeavor; rather, it additionally incorporates
⊘ This is a preview!⊘
Do you want full access?
Subscribe today to unlock all pages.
Trusted by 1+ million students worldwide
those in which the state holds controlling offers for example joint stock ventures. Truth be told,
Vietnam‟s state syndications might be both EGs and CGs. A few GCs are state restraining
infrastructures in explicit areas while some of them are viewed as updated into new EGs. Since
all normal imposing business model ventures are in the hands of the state, there are not many
contrasts between a characteristic syndication and a state monopoly.4 The question of
restraining infrastructures in Vietnam is mainly worried about state syndications.
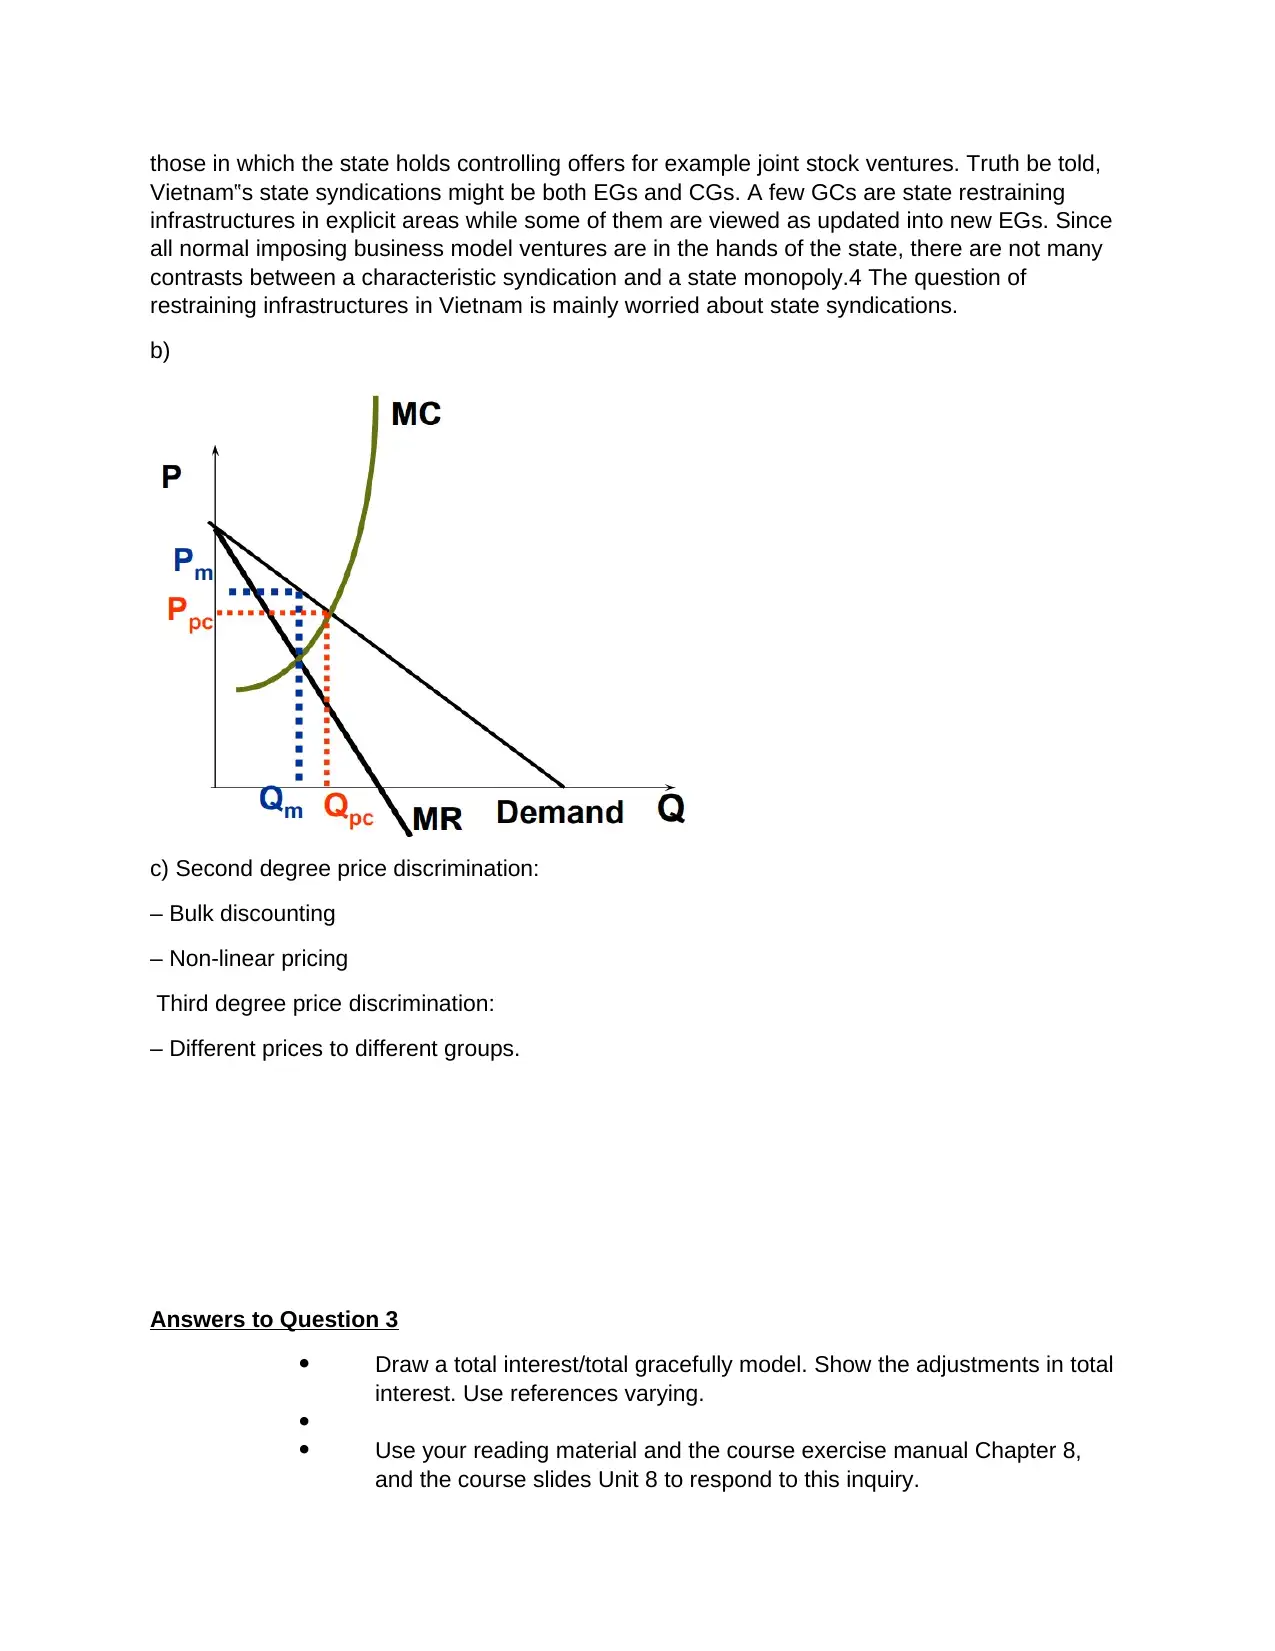
b)
c) Second degree price discrimination:
– Bulk discounting
– Non-linear pricing
Third degree price discrimination:
– Different prices to different groups.
Answers to Question 3
Draw a total interest/total gracefully model. Show the adjustments in total
interest. Use references varying.
Use your reading material and the course exercise manual Chapter 8,
and the course slides Unit 8 to respond to this inquiry.
Vietnam‟s state syndications might be both EGs and CGs. A few GCs are state restraining
infrastructures in explicit areas while some of them are viewed as updated into new EGs. Since
all normal imposing business model ventures are in the hands of the state, there are not many
contrasts between a characteristic syndication and a state monopoly.4 The question of
restraining infrastructures in Vietnam is mainly worried about state syndications.
b)
c) Second degree price discrimination:
– Bulk discounting
– Non-linear pricing
Third degree price discrimination:
– Different prices to different groups.
Answers to Question 3
Draw a total interest/total gracefully model. Show the adjustments in total
interest. Use references varying.
Use your reading material and the course exercise manual Chapter 8,
and the course slides Unit 8 to respond to this inquiry.
Paraphrase This Document
Need a fresh take? Get an instant paraphrase of this document with our AI Paraphraser
Greenlaw, S. A., and Shapiro, D. 2018. Section 24 Aggregate
Demand/Aggregate Supply Model. In: Principles of Economics 2e.
Houston: OpenStax Rice University. pp. 579-606.
Specifically: See 24.4 and figure 24.8 on p. 292.
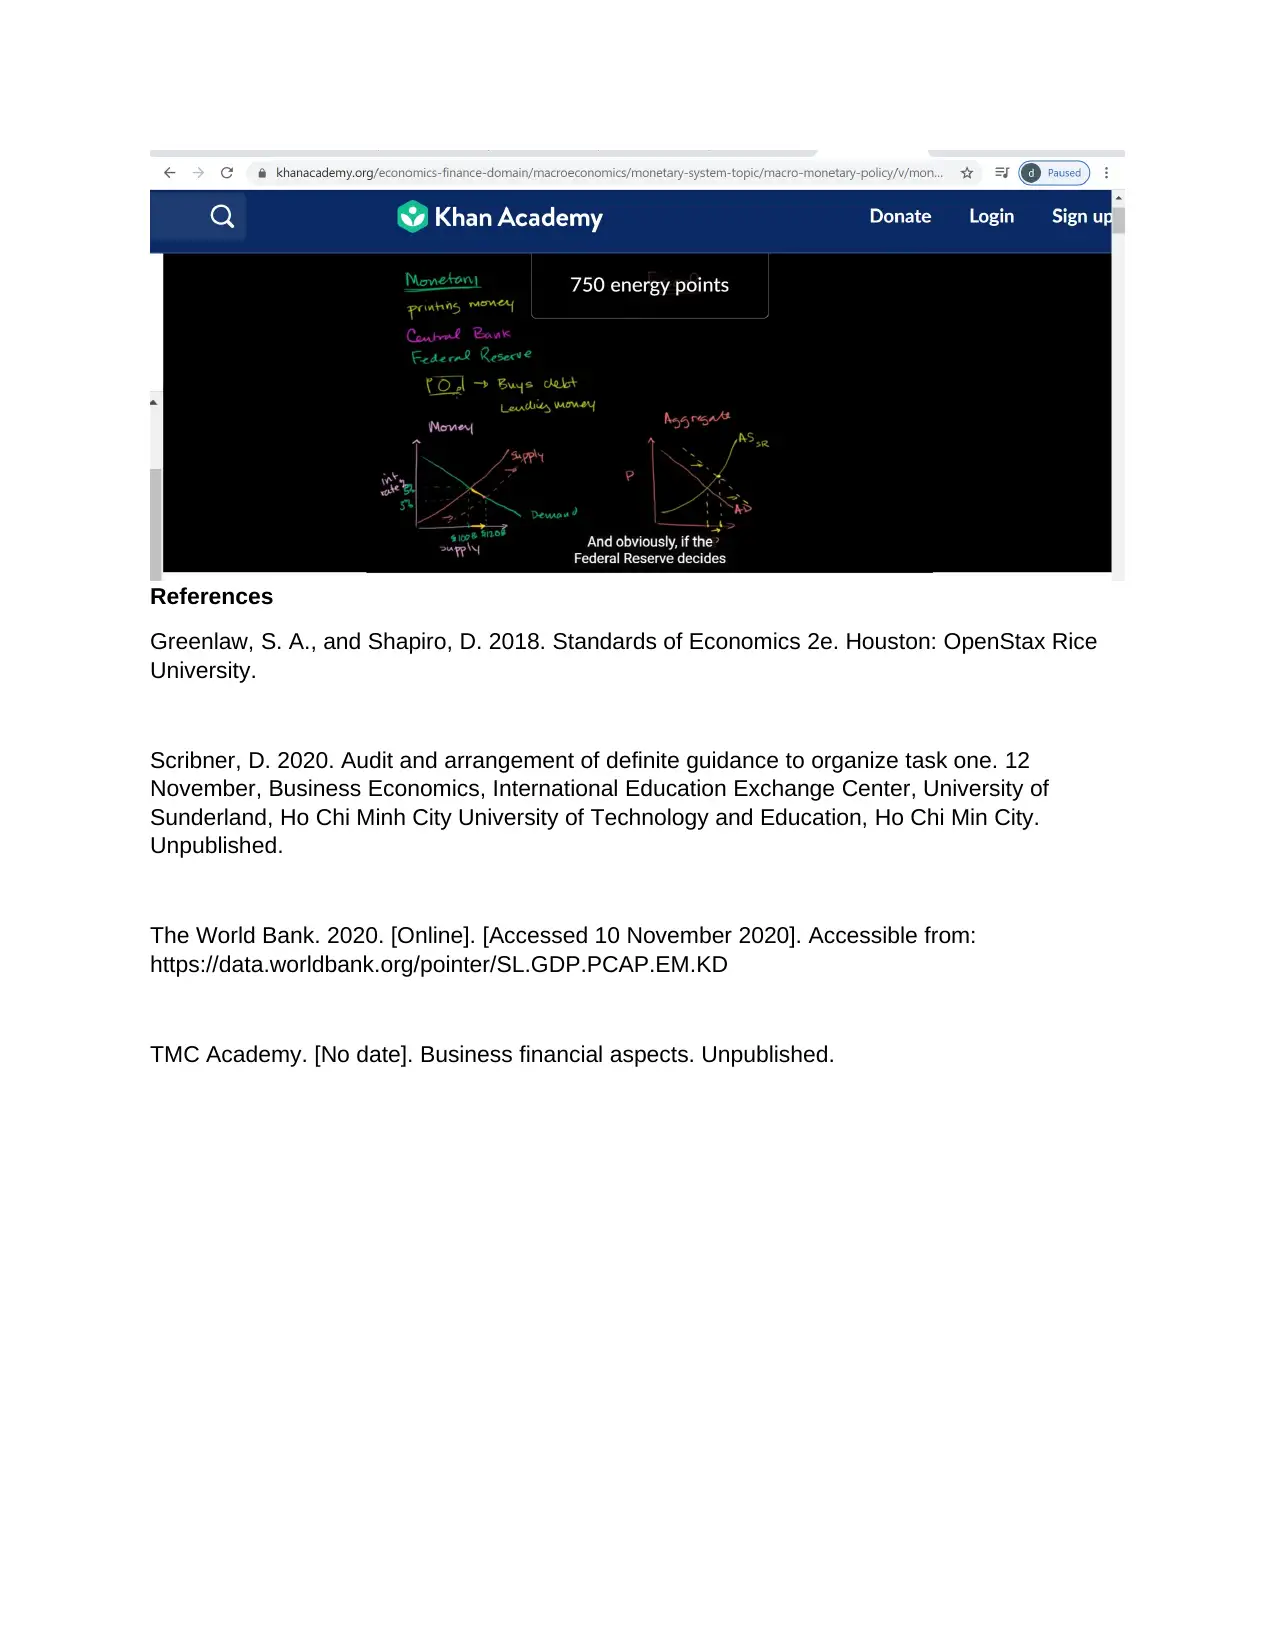
Khan Academy. 2020. Financial and Fiscal Policy. [Online]. [Accessed 17
November 2020]. Accessible from:
https://www.khanacademy.org/financial aspects account
space/macroeconomics/money related framework point/large scale
money related arrangement/v/money related and-monetary strategy
Greenlaw, S. A., and Shapiro, D. 2018. Section 24 Aggregate
Demand/Aggregate Supply Model. In: Principles of Economics 2e.
Houston: OpenStax Rice University. pp. 579-606.
Specifically: See 24.4 and figure 24.8 on p. 292.
Khan Academy. 2020. Financial and Fiscal Policy. [Online]. [Accessed 17
November 2020]. Accessible from:
https://www.khanacademy.org/financial aspects account
space/macroeconomics/money related framework point/large scale
money related arrangement/v/money related and-monetary strategy
References
Greenlaw, S. A., and Shapiro, D. 2018. Standards of Economics 2e. Houston: OpenStax Rice
University.
Scribner, D. 2020. Audit and arrangement of definite guidance to organize task one. 12
November, Business Economics, International Education Exchange Center, University of
Sunderland, Ho Chi Minh City University of Technology and Education, Ho Chi Min City.
Unpublished.
The World Bank. 2020. [Online]. [Accessed 10 November 2020]. Accessible from:
https://data.worldbank.org/pointer/SL.GDP.PCAP.EM.KD
TMC Academy. [No date]. Business financial aspects. Unpublished.
⊘ This is a preview!⊘
Do you want full access?
Subscribe today to unlock all pages.
Trusted by 1+ million students worldwide
Please note, I have included additional examples below. The examples show different types of
documents and the need to list your work in alphabetical order. Remember to delete what you
do not use. A reference list only includes references the documents you actually read. If there
is a reference from another writer in a document you have read, then you should use an indirect
reference. For example: (Smith as cited in Greenlaw, 2018); I would look for the Greenlaw
reference on the reference list.
Examples of references
American Psychological Association. 2020. [Online]. [Accessed 17 November 2020]. Available
from: https://apastyle.apa.org/style-grammar-guidelines/tables-figures/tables
General Statistics Office of Vietnam. 2020. [Online]. [Accessed: 4 November 2020]. Available
from: https://www.gso.gov.vn/en/data-and-statistics/2020/07/socio-economic-situation-in-seven-
months-of-2020/
Greenlaw, S. A., and Shapiro, D. 2018. Principles of Economics 2e. Houston: OpenStax Rice
University.
The World Bank. 2020. [Online]. [Accessed 10 November 2020]. Available from:
https://data.worldbank.org/indicator/SL.GDP.PCAP.EM.KD
Scribner, D. 2020. Review and provision of detailed instruction to format assignment one. 12
November, Business Economics, International Education Exchange Center, University of
Sunderland, Ho Chi Minh City University of Technology and Education, Ho Chi Min City.
Unpublished.
TMC Academy. [No date]. Business economics. Unpublished.
University of Leeds. 2020. [Online]. [Accessed 17 November 2020]. Available from:
https://library.leeds.ac.uk/referencing-examples/9/leeds-harvard
1 out of 10


Your All-in-One AI-Powered Toolkit for Academic Success.
+13062052269
info@desklib.com
Available 24*7 on WhatsApp / Email
![[object Object]](/_next/static/media/star-bottom.7253800d.svg)
Unlock your academic potential
Copyright © 2020–2026 A2Z Services. All Rights Reserved. Developed and managed by ZUCOL.