Analyzing GDP per Capita's Influence on Life Satisfaction Scores

Verified

Added on  2022/10/19

|10
|1823
|448
Report
AI Summary
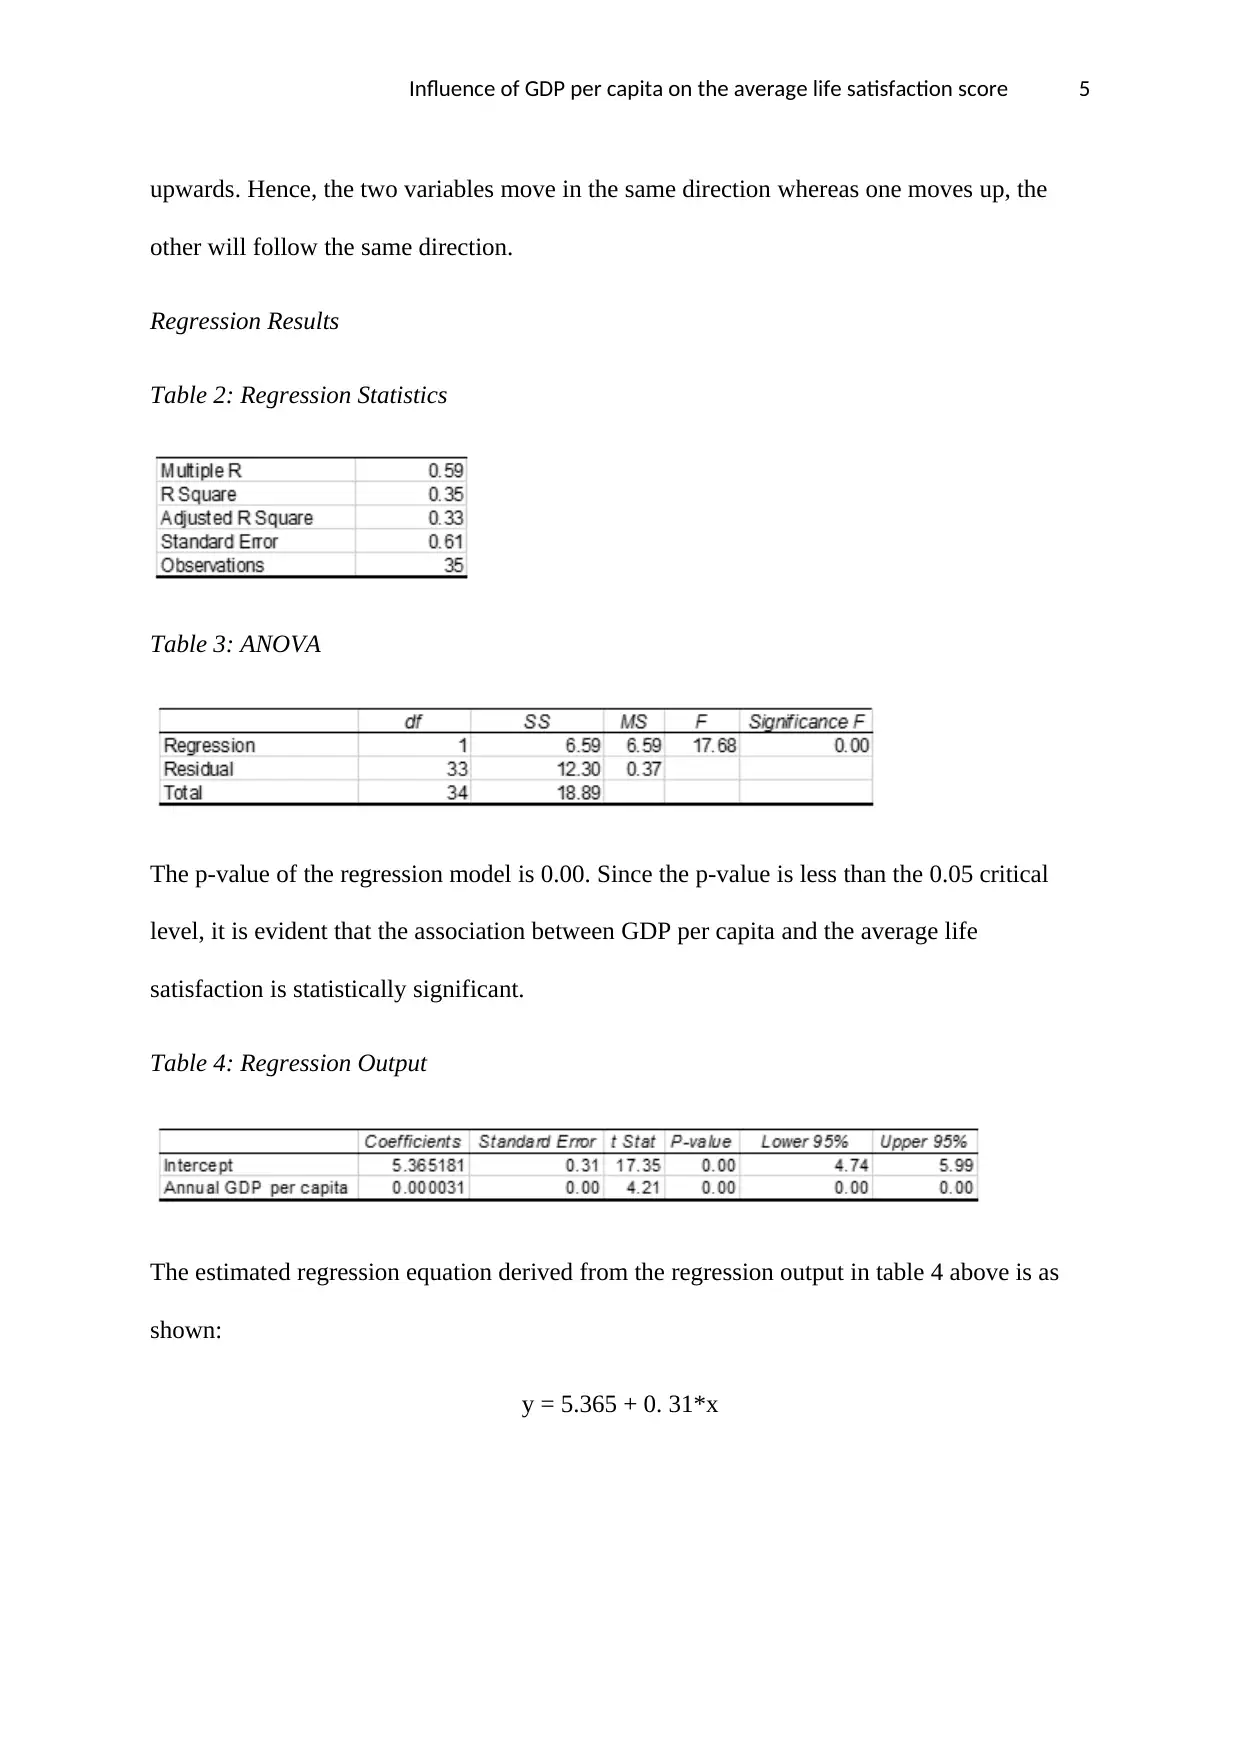
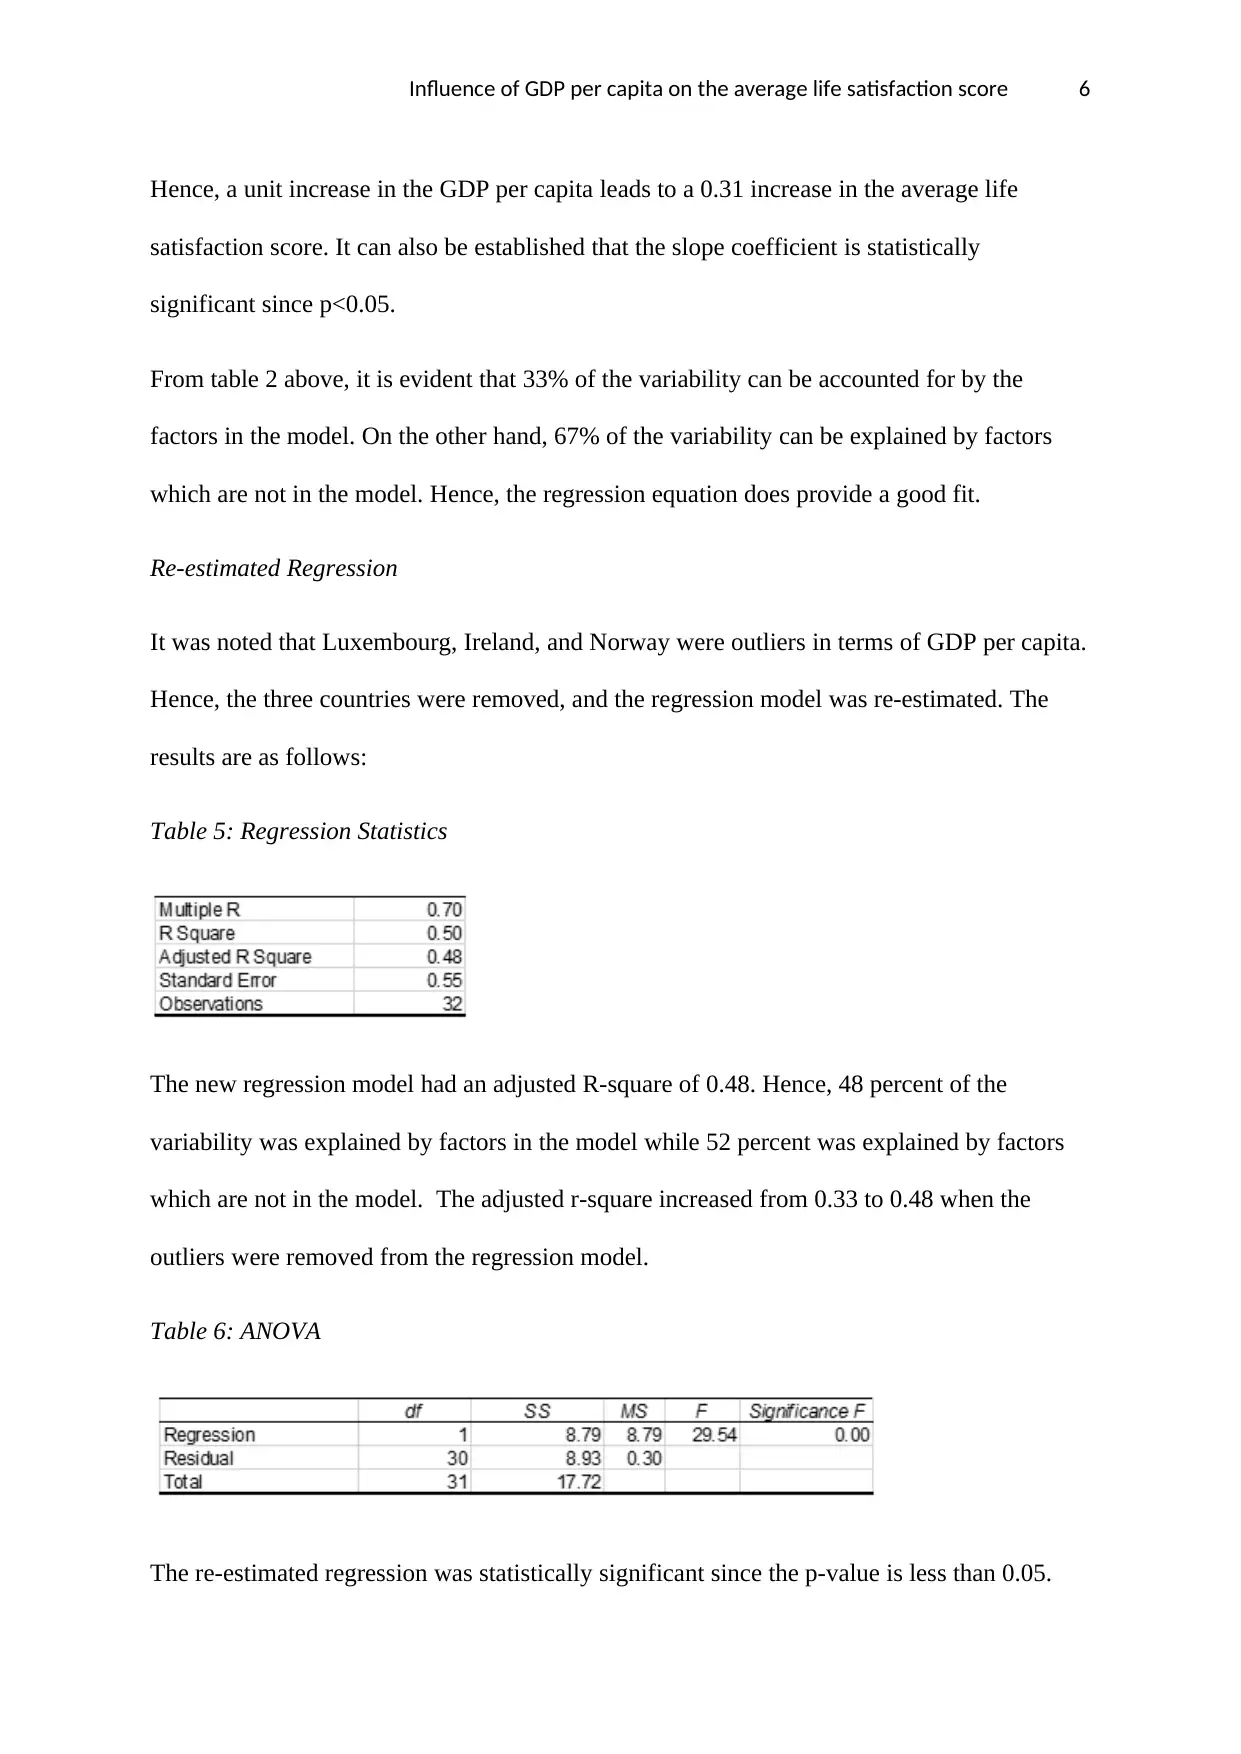
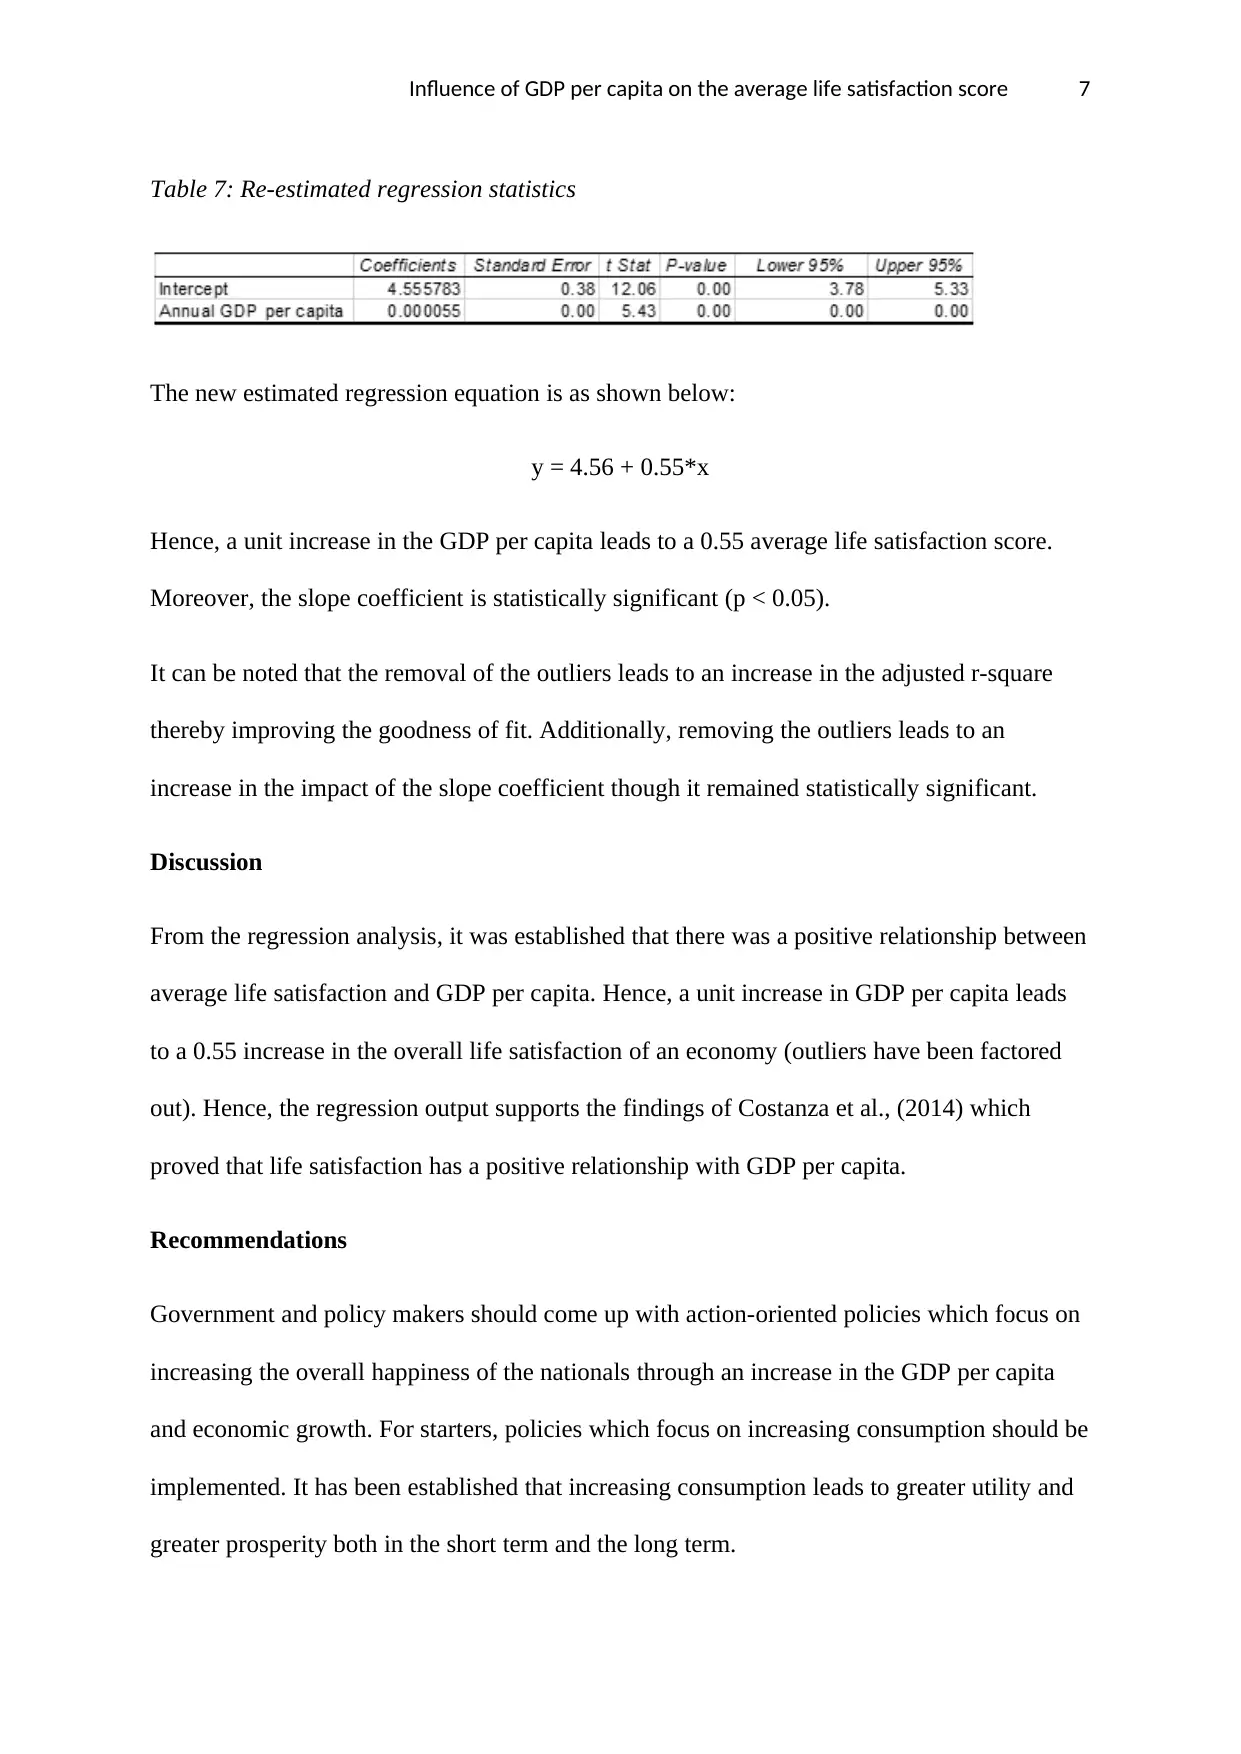
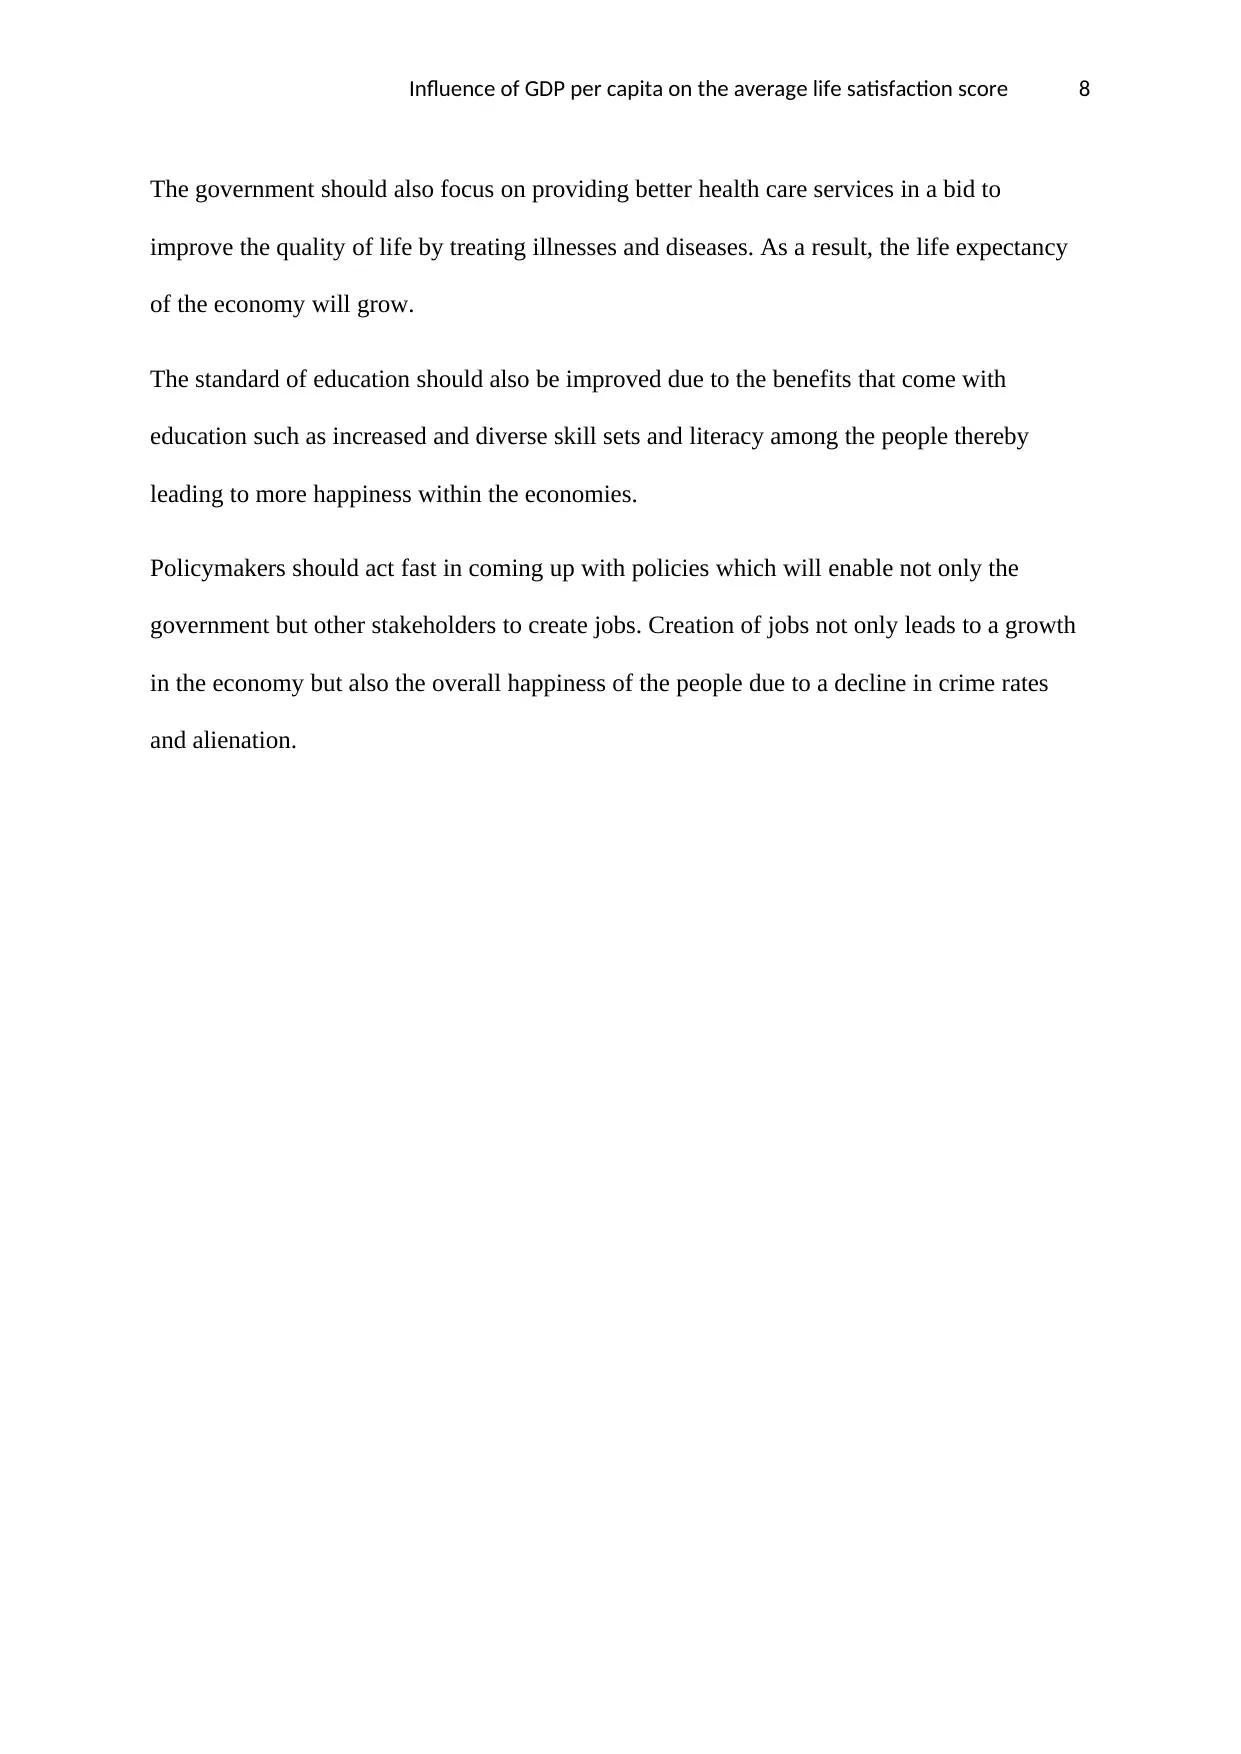
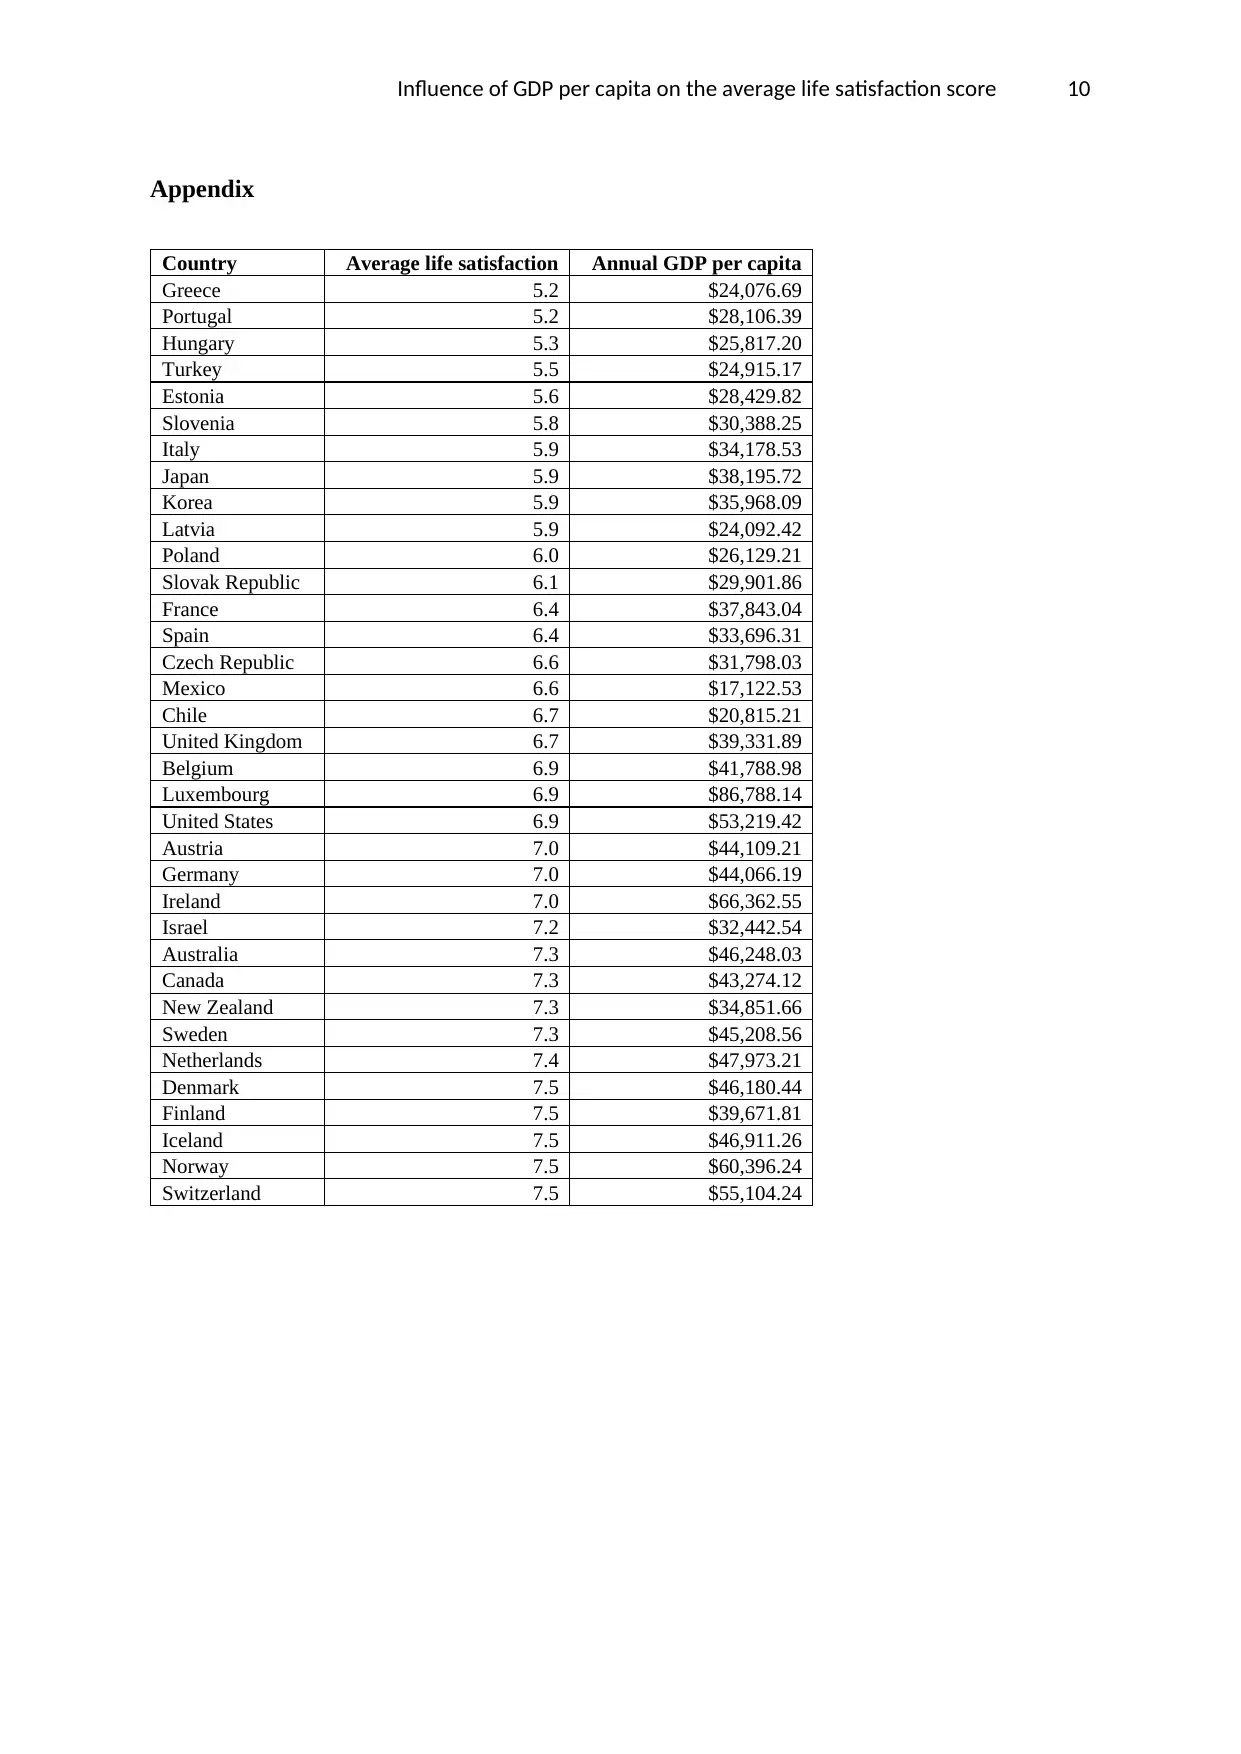
This report investigates the relationship between GDP per capita and average life satisfaction scores across 35 countries, using data from the OECD. The study aims to determine if economic growth, as measured by GDP per capita, correlates with subjective well-being. The report includes a literature review, detailing the economic interest in this relationship, followed by the methodology, which involves descriptive statistics, scatter plots, and regression analysis. The results show a positive correlation between GDP per capita and life satisfaction. The initial regression model was re-estimated after removing outliers. The study concludes with recommendations for policymakers, suggesting that policies focusing on economic growth, increased consumption, improved healthcare, and education are crucial for enhancing overall happiness and life satisfaction. The report emphasizes the importance of job creation in reducing social issues and improving well-being. The analysis found that a unit increase in GDP per capita leads to an increase in the average life satisfaction score.
tabler-icon-diamond-filled.svg

Contribute Materials

Your contribution can guide someone’s learning journey. Share your documents today.
Document Page
Running Header: Influence of GDP per capita on the average life satisfaction score 1
Influence of GDP per capita on the average life satisfaction score
Student’s name:
Course:
Professor:
Institution:
Date:
tabler-icon-diamond-filled.svg

Secure Best Marks with AI Grader

Need help grading? Try our AI Grader for instant feedback on your assignments.
Document Page
Influence of GDP per capita on the average life satisfaction score 2
Purpose
The following study aims to examine the association between average life satisfaction and
GDP per capita. Data obtained focused on 35 countries as seen in the appendix.
Background
The life satisfaction score is used in measuring the subjective well-being or happiness of the
people within a country (Binder & Coad, 2013). The subjective well-being or happiness
encompasses positive feelings and experiences or the absence of negative feelings and
experiences. Life satisfaction measures how people evaluate their life wholly rather than their
current feelings. The life satisfaction score is on a scale from 0 to 10.
Many established economists have been entangled in the knot which aims to determine
whether an increase in the rate of economic growth leads to a happy nation (Glaesmer et al.,
2011). Most developed economies have highly successfully increased their economic output.
However, whether the notable increase in the national output has improved the standards of
living of the people is still in question. The decision on whether economic growth increases
happiness is a choice to be made on a personal basis and it is difficult to come up with a
concrete argument. Growth has a positive impact on the economy but the side-effects which
influence the overall happiness within an economy varies (Proto & Rustichini, 2013).
There are several benefits of economic growth which include increased consumption, and
more benefits for consumers due to more goods and services. Economically, consumption is
related to the utility where, as more goods are being consumed, there is a higher utility which
leads to grander prosperity (Costanza et al., 2014). In addition, economic growth is typically
related to improved public services. Enhanced health care improves the quality of life through
increased life expectancy. An increased standard of education gives the population a greater
Document Page
Influence of GDP per capita on the average life satisfaction score 3
diversity of literacy and skills. Hence, there will be more happiness within the economies. A
reduction in unemployment and poverty results from economic growth through the creation
of jobs. Reduced unemployment and poverty is significant since unemployment is a key
cause of social misfits which include alienation and crime, a huge hindrance to the overall
happiness of the people.
Method
The data used in the study is secondary in nature since it was obtained from online sources.
The data were obtained from the OECD website. OECD is an international organization that
aims to build better policies for better lives.
Once the data was obtained and cleaned, the relevant statistical analysis was done. The first
statistical test was obtaining the descriptive analysis of the two variables using the excel
inbuilt function Data Analysis. A scatter diagram was obtained to determine the relationship
between the two variables. The final empirical test carried out was the regression analysis to
determine the relationship between the average life satisfaction score and the GDP per capita.
The regression analysis used was a simple linear regression since it encompasses only two
variables.
Results
Descriptive Statistics
Table 1: Descriptive statistics
Average life satisfaction Annual GDP per capita
Mean 6.59 $39,012
Standard Deviation 0.75 $14,006
Minimum 5.20 $17,123
Maximum 7.50 $86,788
Document Page
Influence of GDP per capita on the average life satisfaction score 4
The average life satisfaction score between the countries chosen for the study is 6.59 with a
standard deviation of 0.75. The countries which had the lowest life satisfaction index in the
study are Greece and Portugal with a life satisfaction score of 5.2. On the other hand, the
countries with the highest satisfaction index in the study are Denmark, Switzerland, Iceland,
Finland, and Norway with a life satisfaction score of 7.5.
The average annual GDP per capita is $39,012 with a standard deviation of $14,006.
Countries which had the highest GDP per capita was Luxembourg at $86,788.14. Conversely,
the country which has the lowest GDP per capita in the study is Mexico with $17,122.53.
Scatter Plot
The scatter plot of the Annual GDP per Capita against the average life satisfaction score is as
shown below:
5.0 5.5 6.0 6.5 7.0 7.5 8.0
$0.00
$10,000.00
$20,000.00
$30,000.00
$40,000.00
$50,000.00
$60,000.00
$70,000.00
$80,000.00
$90,000.00
$100,000.00
Annual GDP per capita
Figure 1: Annual GDP per Capita Vs Average Life Satisfaction
From figure 1, it is evident that there is a positive correlation between the annual GDP per
Capita and the average life satisfaction score since a linear trend can be established that shifts
tabler-icon-diamond-filled.svg

Secure Best Marks with AI Grader

Need help grading? Try our AI Grader for instant feedback on your assignments.
Document Page
Influence of GDP per capita on the average life satisfaction score 5
upwards. Hence, the two variables move in the same direction whereas one moves up, the
other will follow the same direction.
Regression Results
Table 2: Regression Statistics
Table 3: ANOVA
The p-value of the regression model is 0.00. Since the p-value is less than the 0.05 critical
level, it is evident that the association between GDP per capita and the average life
satisfaction is statistically significant.
Table 4: Regression Output
The estimated regression equation derived from the regression output in table 4 above is as
shown:
y = 5.365 + 0. 31*x
Document Page
Influence of GDP per capita on the average life satisfaction score 6
Hence, a unit increase in the GDP per capita leads to a 0.31 increase in the average life
satisfaction score. It can also be established that the slope coefficient is statistically
significant since p<0.05.
From table 2 above, it is evident that 33% of the variability can be accounted for by the
factors in the model. On the other hand, 67% of the variability can be explained by factors
which are not in the model. Hence, the regression equation does provide a good fit.
Re-estimated Regression
It was noted that Luxembourg, Ireland, and Norway were outliers in terms of GDP per capita.
Hence, the three countries were removed, and the regression model was re-estimated. The
results are as follows:
Table 5: Regression Statistics
The new regression model had an adjusted R-square of 0.48. Hence, 48 percent of the
variability was explained by factors in the model while 52 percent was explained by factors
which are not in the model. The adjusted r-square increased from 0.33 to 0.48 when the
outliers were removed from the regression model.
Table 6: ANOVA
The re-estimated regression was statistically significant since the p-value is less than 0.05.
Document Page
Influence of GDP per capita on the average life satisfaction score 7
Table 7: Re-estimated regression statistics
The new estimated regression equation is as shown below:
y = 4.56 + 0.55*x
Hence, a unit increase in the GDP per capita leads to a 0.55 average life satisfaction score.
Moreover, the slope coefficient is statistically significant (p < 0.05).
It can be noted that the removal of the outliers leads to an increase in the adjusted r-square
thereby improving the goodness of fit. Additionally, removing the outliers leads to an
increase in the impact of the slope coefficient though it remained statistically significant.
Discussion
From the regression analysis, it was established that there was a positive relationship between
average life satisfaction and GDP per capita. Hence, a unit increase in GDP per capita leads
to a 0.55 increase in the overall life satisfaction of an economy (outliers have been factored
out). Hence, the regression output supports the findings of Costanza et al., (2014) which
proved that life satisfaction has a positive relationship with GDP per capita.
Recommendations
Government and policy makers should come up with action-oriented policies which focus on
increasing the overall happiness of the nationals through an increase in the GDP per capita
and economic growth. For starters, policies which focus on increasing consumption should be
implemented. It has been established that increasing consumption leads to greater utility and
greater prosperity both in the short term and the long term.
tabler-icon-diamond-filled.svg

Paraphrase This Document

Need a fresh take? Get an instant paraphrase of this document with our AI Paraphraser
Document Page
Influence of GDP per capita on the average life satisfaction score 8
The government should also focus on providing better health care services in a bid to
improve the quality of life by treating illnesses and diseases. As a result, the life expectancy
of the economy will grow.
The standard of education should also be improved due to the benefits that come with
education such as increased and diverse skill sets and literacy among the people thereby
leading to more happiness within the economies.
Policymakers should act fast in coming up with policies which will enable not only the
government but other stakeholders to create jobs. Creation of jobs not only leads to a growth
in the economy but also the overall happiness of the people due to a decline in crime rates
and alienation.
Document Page
Influence of GDP per capita on the average life satisfaction score 9
References
Binder, M., & Coad, A. 2013. Life satisfaction and self-employment: a matching
approach. Small Business Economics, 40(4), 1009-1033.
Costanza, R., Kubiszewski, I., Giovannini, E., Lovins, H., McGlade, J., Pickett, K. E., &
Wilkinson, R. 2014. Development: Time to leave GDP behind. Nature
News, 505(7483), 283.
Glaesmer, H., Grande, G., Braehler, E., & Roth, M. 2011. The German version of the
satisfaction with life scale (SWLS). European Journal of Psychological Assessment.
Proto, E., & Rustichini, A. 2013. A reassessment of the relationship between GDP and life
satisfaction. PloS one, 8(11), e79358.
Document Page
Influence of GDP per capita on the average life satisfaction score 10
Appendix
Country Average life satisfaction Annual GDP per capita
Greece 5.2 $24,076.69
Portugal 5.2 $28,106.39
Hungary 5.3 $25,817.20
Turkey 5.5 $24,915.17
Estonia 5.6 $28,429.82
Slovenia 5.8 $30,388.25
Italy 5.9 $34,178.53
Japan 5.9 $38,195.72
Korea 5.9 $35,968.09
Latvia 5.9 $24,092.42
Poland 6.0 $26,129.21
Slovak Republic 6.1 $29,901.86
France 6.4 $37,843.04
Spain 6.4 $33,696.31
Czech Republic 6.6 $31,798.03
Mexico 6.6 $17,122.53
Chile 6.7 $20,815.21
United Kingdom 6.7 $39,331.89
Belgium 6.9 $41,788.98
Luxembourg 6.9 $86,788.14
United States 6.9 $53,219.42
Austria 7.0 $44,109.21
Germany 7.0 $44,066.19
Ireland 7.0 $66,362.55
Israel 7.2 $32,442.54
Australia 7.3 $46,248.03
Canada 7.3 $43,274.12
New Zealand 7.3 $34,851.66
Sweden 7.3 $45,208.56
Netherlands 7.4 $47,973.21
Denmark 7.5 $46,180.44
Finland 7.5 $39,671.81
Iceland 7.5 $46,911.26
Norway 7.5 $60,396.24
Switzerland 7.5 $55,104.24
chevron_up_icon
1 out of 10
circle_padding
hide_on_mobile
zoom_out_icon
logo.png

Your All-in-One AI-Powered Toolkit for Academic Success.

Available 24*7 on WhatsApp / Email

[object Object]