Real GDP Per Capita Analysis: A Business Statistics Report

Verified

Added on  2023/06/09

|6
|1024
|495
Report
AI Summary
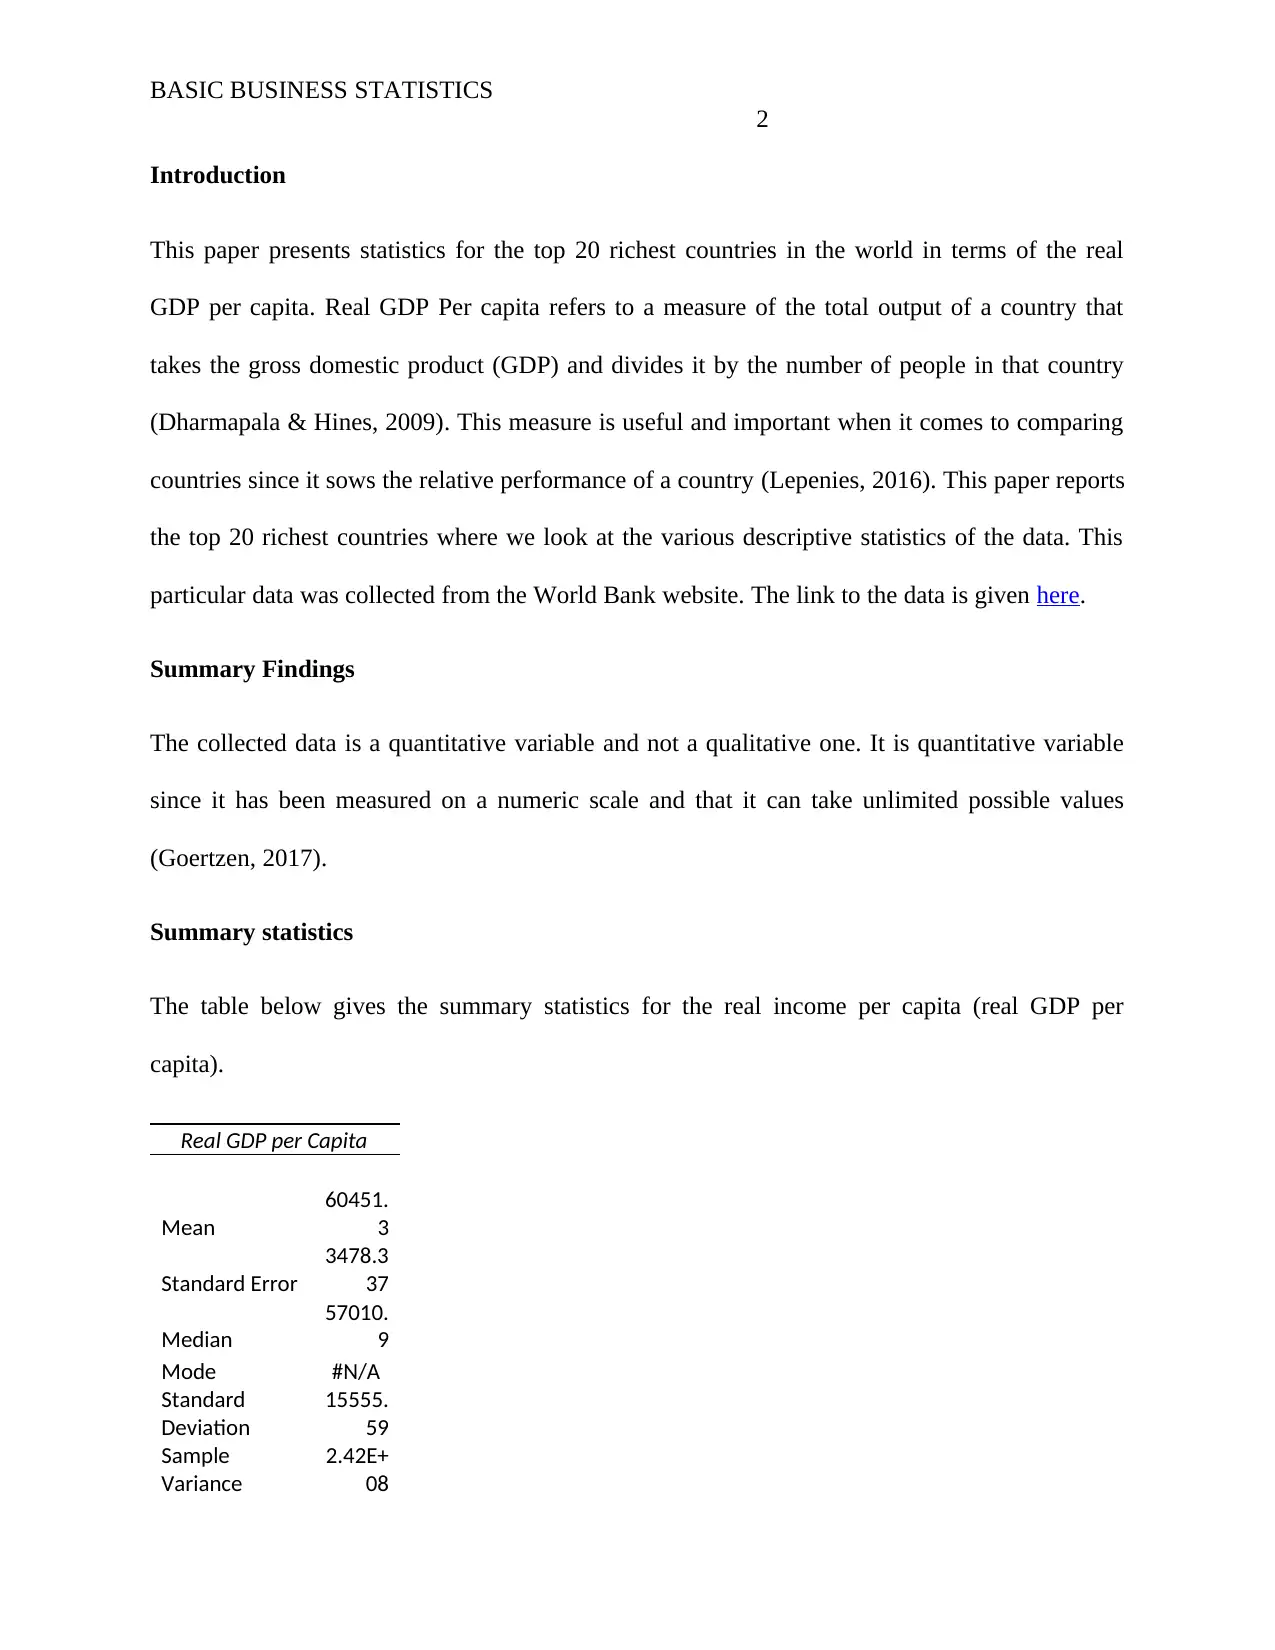
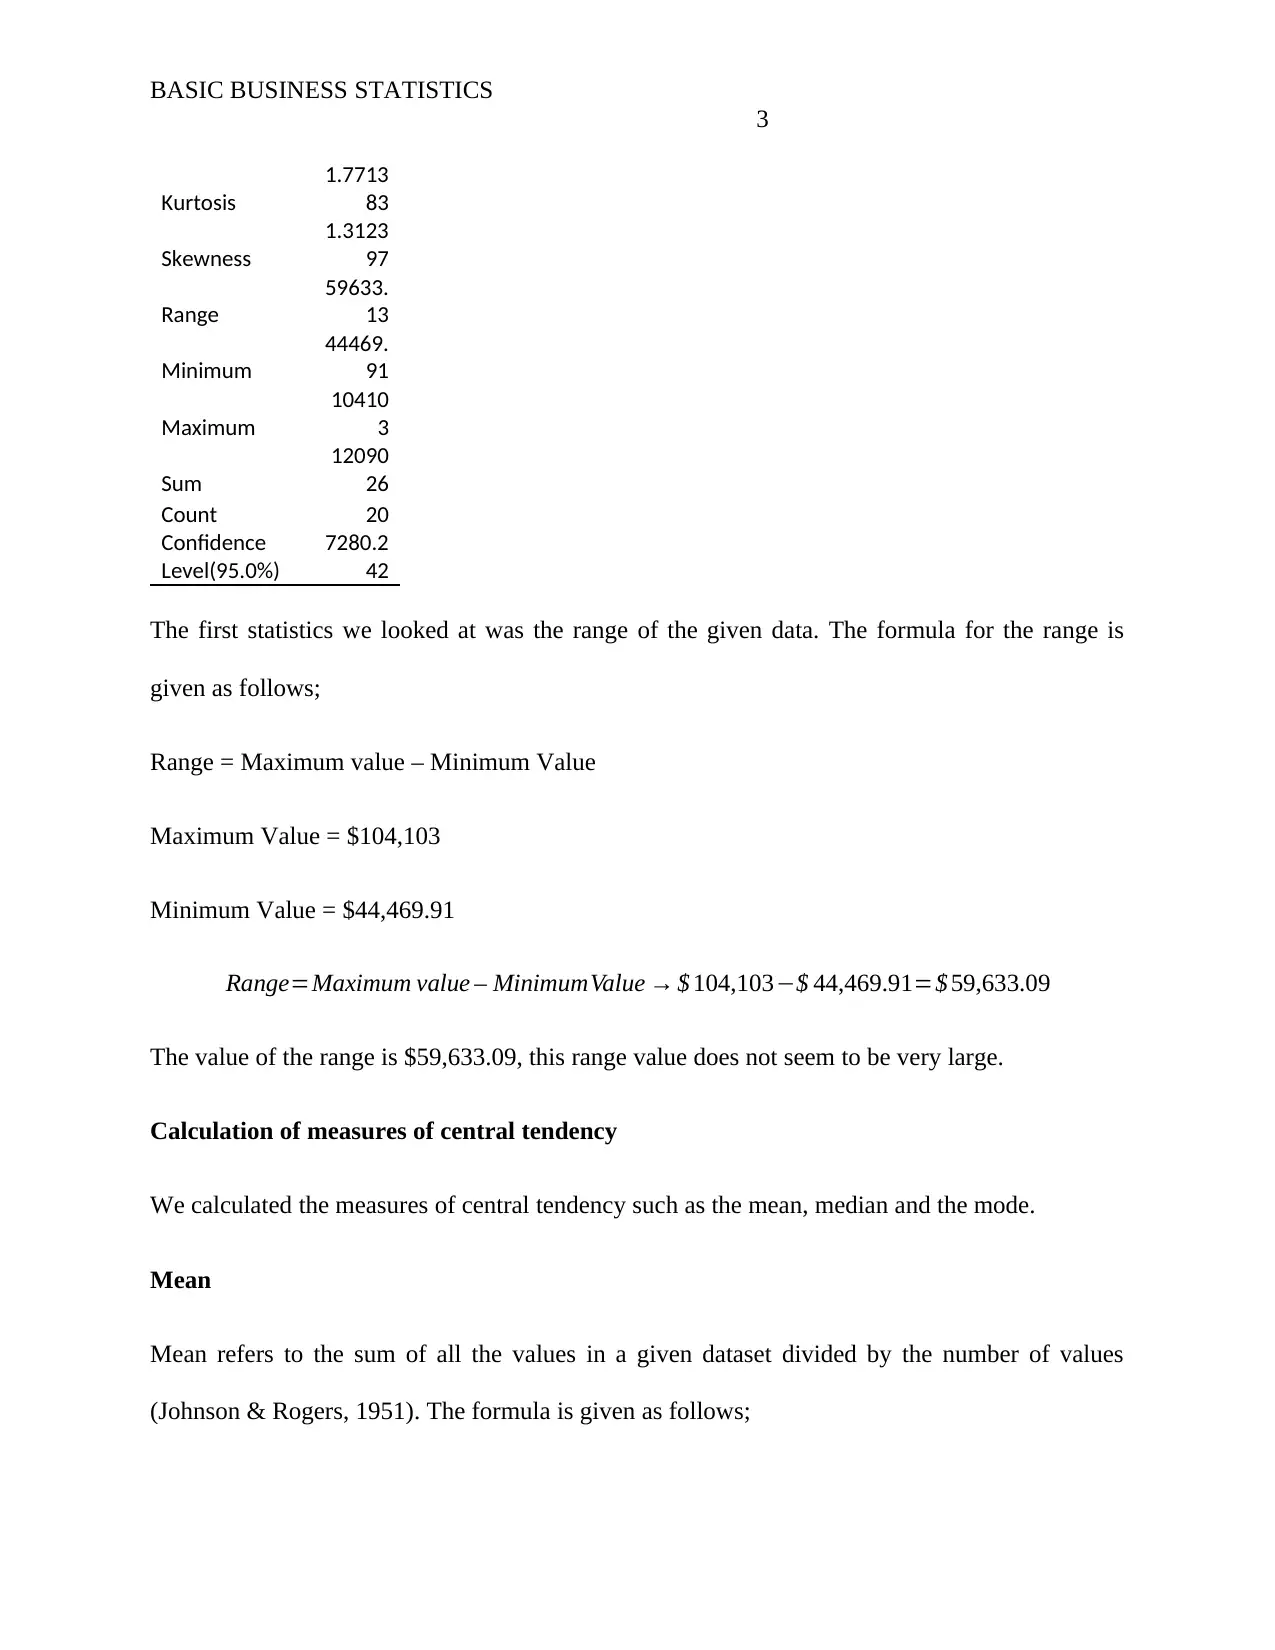
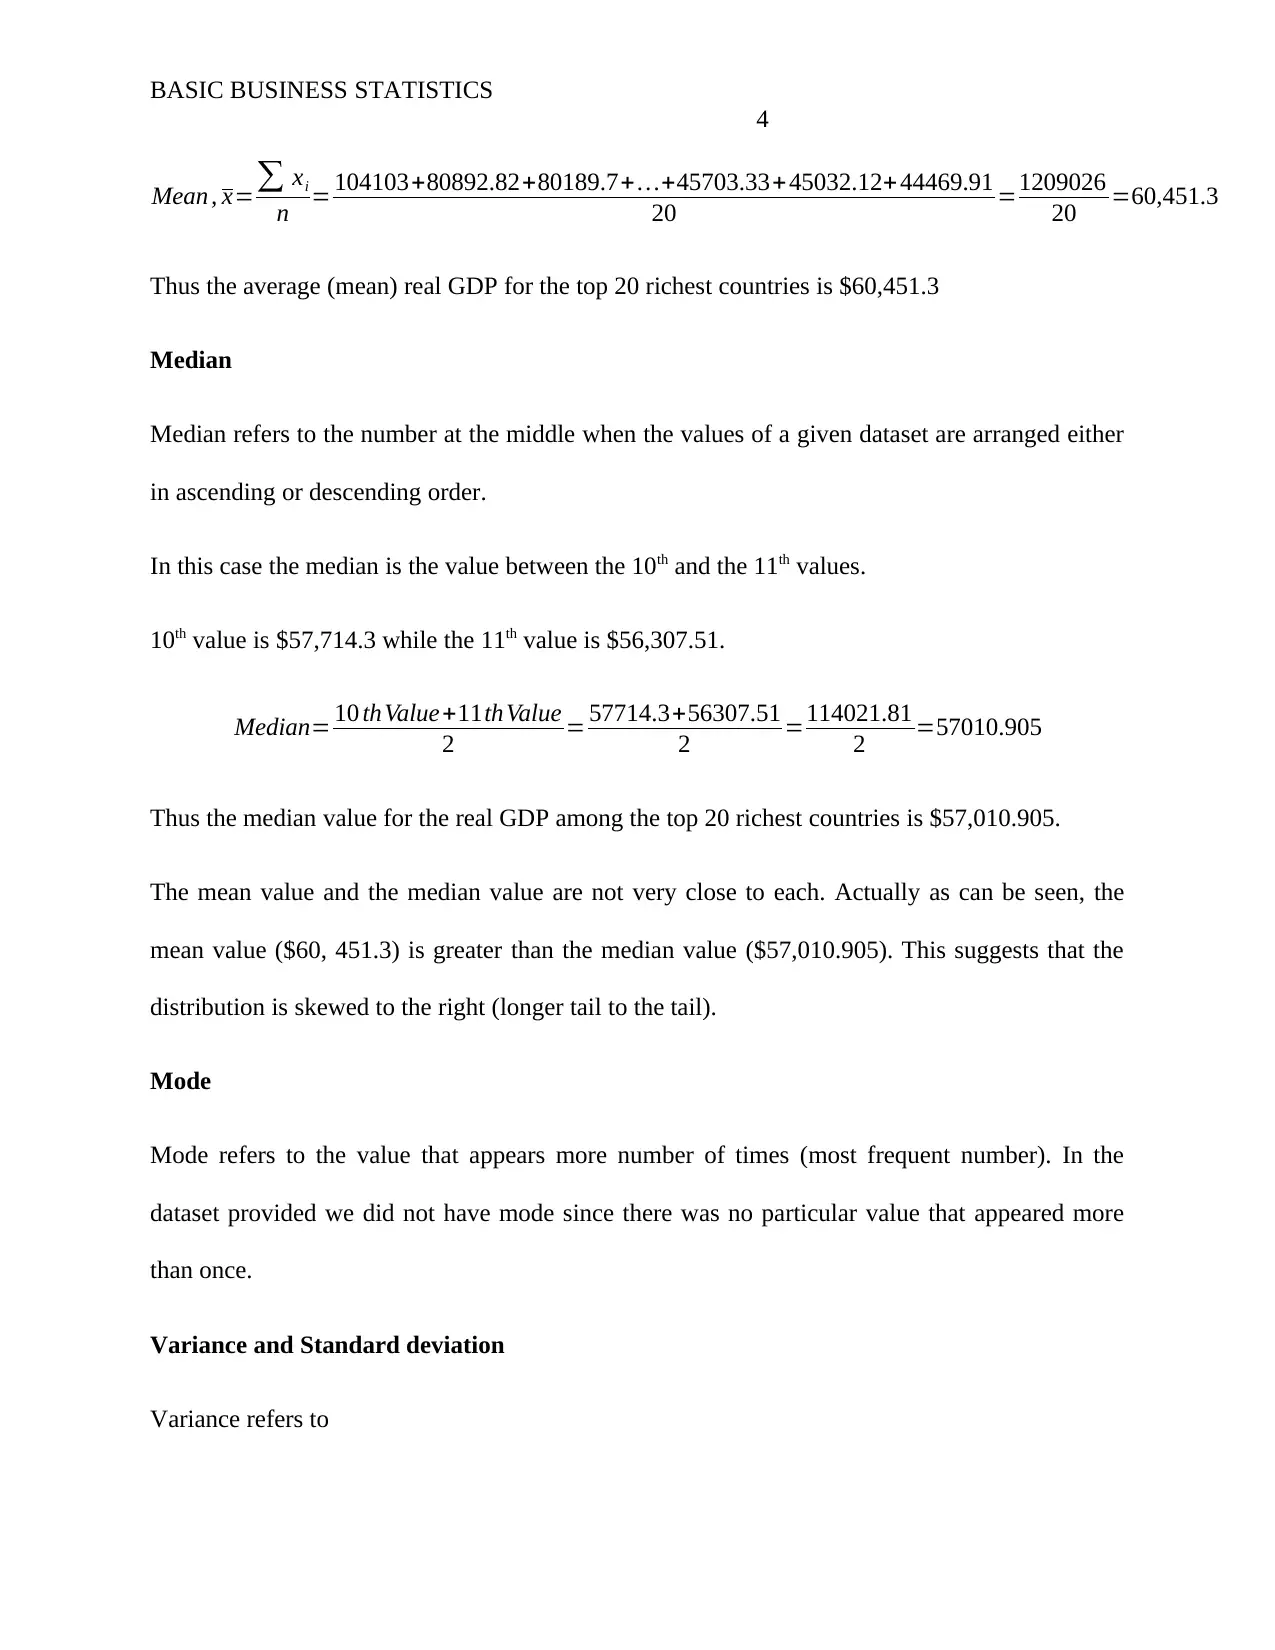
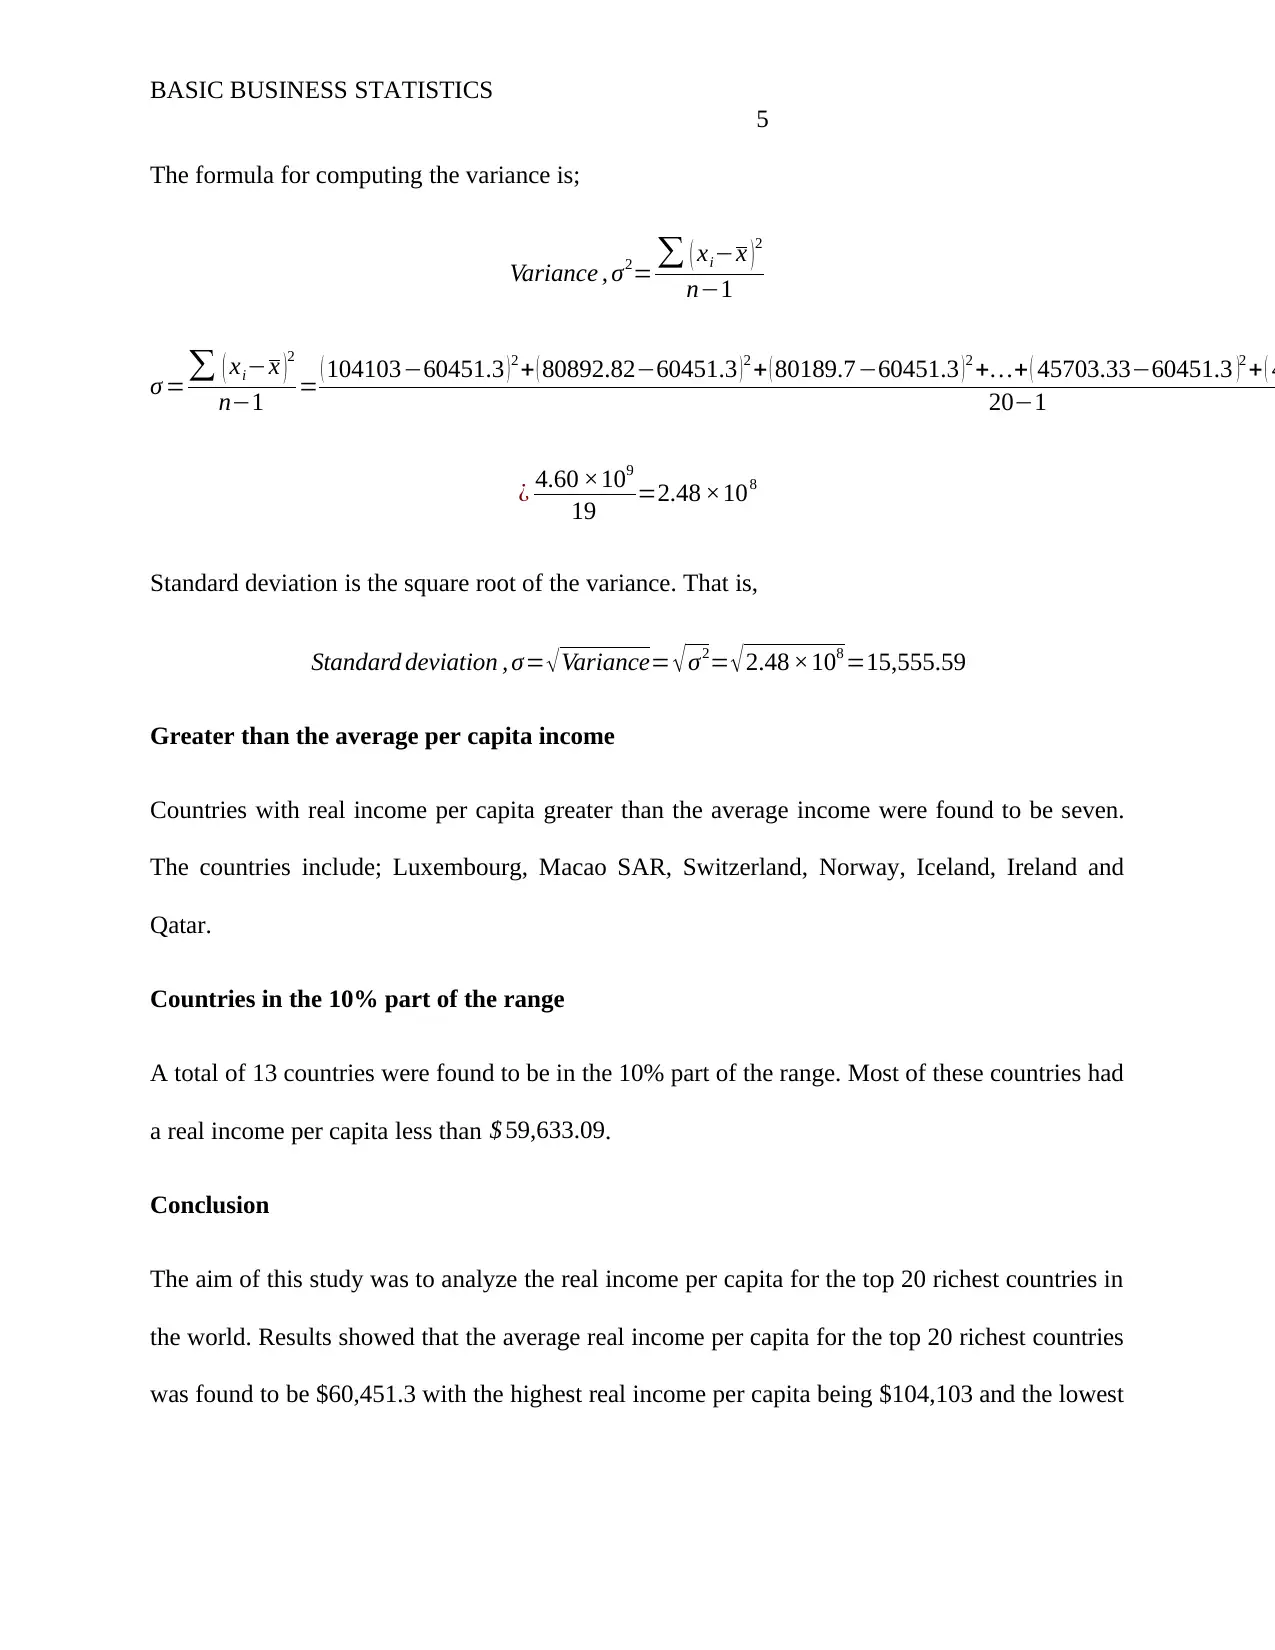
This report presents a statistical analysis of real GDP per capita for the top 20 richest countries, utilizing data from the World Bank. The study focuses on descriptive statistics, including the mean, median, mode, range, variance, and standard deviation. The mean real GDP per capita was calculated to be $60,451.3, with a median of $57,010.905, indicating a right-skewed distribution. The report identifies countries with per capita incomes above the average and those within the 10% range of the data. The analysis concludes by summarizing the findings, highlighting the highest and lowest real income values, and noting the proportion of countries exceeding the average income. The report aims to provide insights into the economic performance and income distribution of these nations.
Document Page
Running Head: BASIC BUSINESS STATISTICS 1
Basic Business Statistics
Name:
Institution:
22nd July 2018
tabler-icon-diamond-filled.svg

Paraphrase This Document

Need a fresh take? Get an instant paraphrase of this document with our AI Paraphraser
Document Page
BASIC BUSINESS STATISTICS
2
Introduction
This paper presents statistics for the top 20 richest countries in the world in terms of the real
GDP per capita. Real GDP Per capita refers to a measure of the total output of a country that
takes the gross domestic product (GDP) and divides it by the number of people in that country
(Dharmapala & Hines, 2009). This measure is useful and important when it comes to comparing
countries since it sows the relative performance of a country (Lepenies, 2016). This paper reports
the top 20 richest countries where we look at the various descriptive statistics of the data. This
particular data was collected from the World Bank website. The link to the data is given here.
Summary Findings
The collected data is a quantitative variable and not a qualitative one. It is quantitative variable
since it has been measured on a numeric scale and that it can take unlimited possible values
(Goertzen, 2017).
Summary statistics
The table below gives the summary statistics for the real income per capita (real GDP per
capita).
Real GDP per Capita
Mean
60451.
3
Standard Error
3478.3
37
Median
57010.
9
Mode #N/A
Standard
Deviation
15555.
59
Sample
Variance
2.42E+
08
Document Page
BASIC BUSINESS STATISTICS
3
Kurtosis
1.7713
83
Skewness
1.3123
97
Range
59633.
13
Minimum
44469.
91
Maximum
10410
3
Sum
12090
26
Count 20
Confidence
Level(95.0%)
7280.2
42
The first statistics we looked at was the range of the given data. The formula for the range is
given as follows;
Range = Maximum value – Minimum Value
Maximum Value = $104,103
Minimum Value = $44,469.91
Range=Maximum value MinimumValue $ 104,103$ 44,469.91=$ 59,633.09
The value of the range is $59,633.09, this range value does not seem to be very large.
Calculation of measures of central tendency
We calculated the measures of central tendency such as the mean, median and the mode.
Mean
Mean refers to the sum of all the values in a given dataset divided by the number of values
(Johnson & Rogers, 1951). The formula is given as follows;
Document Page
BASIC BUSINESS STATISTICS
4
Mean , x= xi
n = 104103+80892.82+80189.7+ +45703.33+ 45032.12+ 44469.91
20 =1209026
20 =60,451.3
Thus the average (mean) real GDP for the top 20 richest countries is $60,451.3
Median
Median refers to the number at the middle when the values of a given dataset are arranged either
in ascending or descending order.
In this case the median is the value between the 10th and the 11th values.
10th value is $57,714.3 while the 11th value is $56,307.51.
Median= 10 thValue+11thValue
2 = 57714.3+56307.51
2 =114021.81
2 =57010.905
Thus the median value for the real GDP among the top 20 richest countries is $57,010.905.
The mean value and the median value are not very close to each. Actually as can be seen, the
mean value ($60, 451.3) is greater than the median value ($57,010.905). This suggests that the
distribution is skewed to the right (longer tail to the tail).
Mode
Mode refers to the value that appears more number of times (most frequent number). In the
dataset provided we did not have mode since there was no particular value that appeared more
than once.
Variance and Standard deviation
Variance refers to
tabler-icon-diamond-filled.svg

Paraphrase This Document

Need a fresh take? Get an instant paraphrase of this document with our AI Paraphraser
Document Page
BASIC BUSINESS STATISTICS
5
The formula for computing the variance is;
Variance , σ2= ( xix )2
n1
σ = ( xix )2
n1 = ( 10410360451.3 )2 + ( 80892.8260451.3 )2 + ( 80189.760451.3 )2 ++ ( 45703.3360451.3 )2 + ( 4
201
¿ 4.60 ×10⁹
19 =2.48 ×10⁸
Standard deviation is the square root of the variance. That is,
Standard deviation , σ= Variance= σ2= 2.48 ×108 =15,555.59
Greater than the average per capita income
Countries with real income per capita greater than the average income were found to be seven.
The countries include; Luxembourg, Macao SAR, Switzerland, Norway, Iceland, Ireland and
Qatar.
Countries in the 10% part of the range
A total of 13 countries were found to be in the 10% part of the range. Most of these countries had
a real income per capita less than $ 59,633.09.
Conclusion
The aim of this study was to analyze the real income per capita for the top 20 richest countries in
the world. Results showed that the average real income per capita for the top 20 richest countries
was found to be $60,451.3 with the highest real income per capita being $104,103 and the lowest
Document Page
BASIC BUSINESS STATISTICS
6
for this group being $44,469.91. 35% (n = 7) of the countries had a real income per capita greater
than the average for the 20 countries.
References
Dharmapala, D., & Hines, J. R. (2009). Which Countries Become Tax Havens? Journal of
Public Economics, 93(9-10), 1058–1068.
Goertzen, M. J. (2017). Introduction to Quantitative Research and Data. Library Technology
Reports, 53(4), 12–18.
Johnson , N. L., & Rogers, C. A. (1951). The moment problem for unimodal distributions.
Annals of Mathematical Statistics, 22(3), 433–439.
Lepenies, P. (2016). The Power of a Single Number: A Political History of GDP. Journal of
Economics, 34-49.
chevron_up_icon
1 out of 6
circle_padding
hide_on_mobile
zoom_out_icon
[object Object]