ECON 101: Life Satisfaction and GDP Per Capita Regression Report
VerifiedAdded on 2023/03/31
|12
|1615
|187
Report
AI Summary
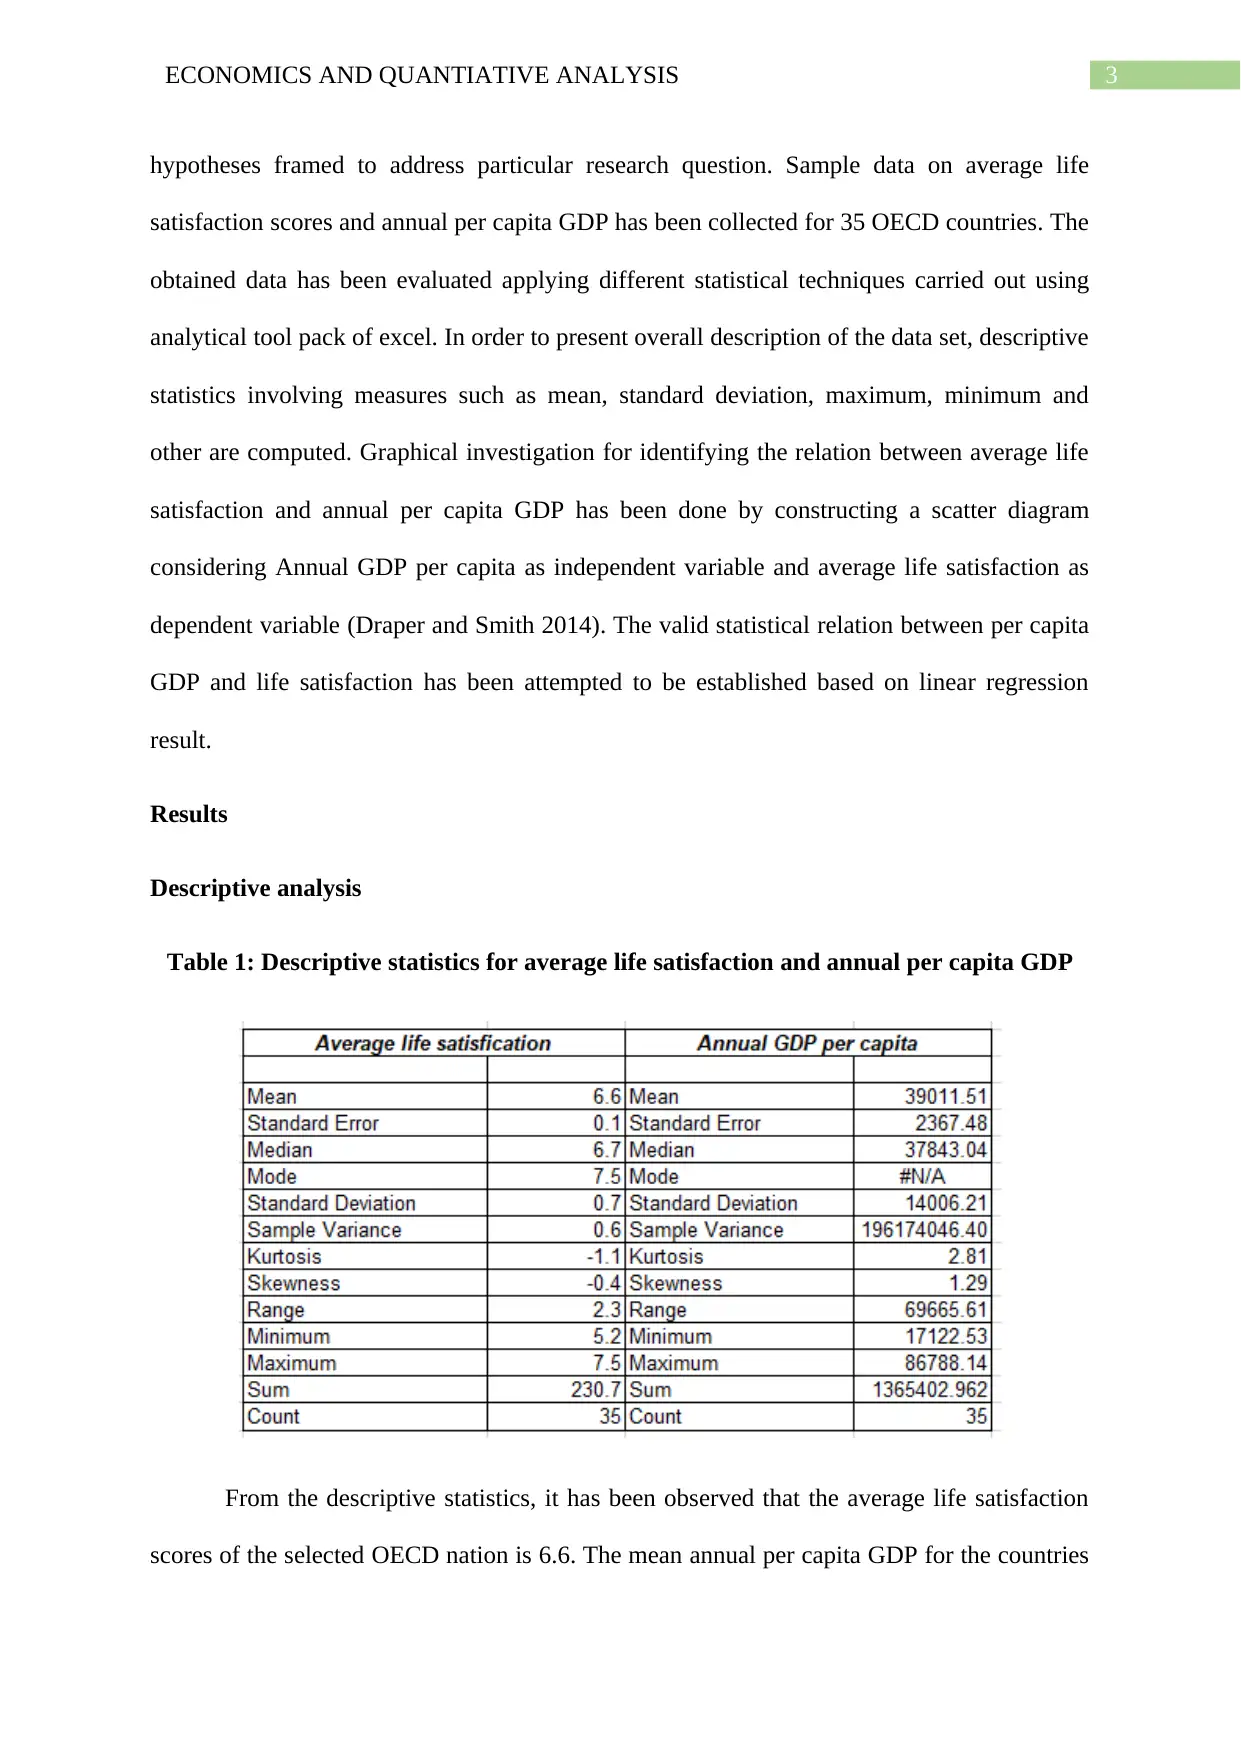
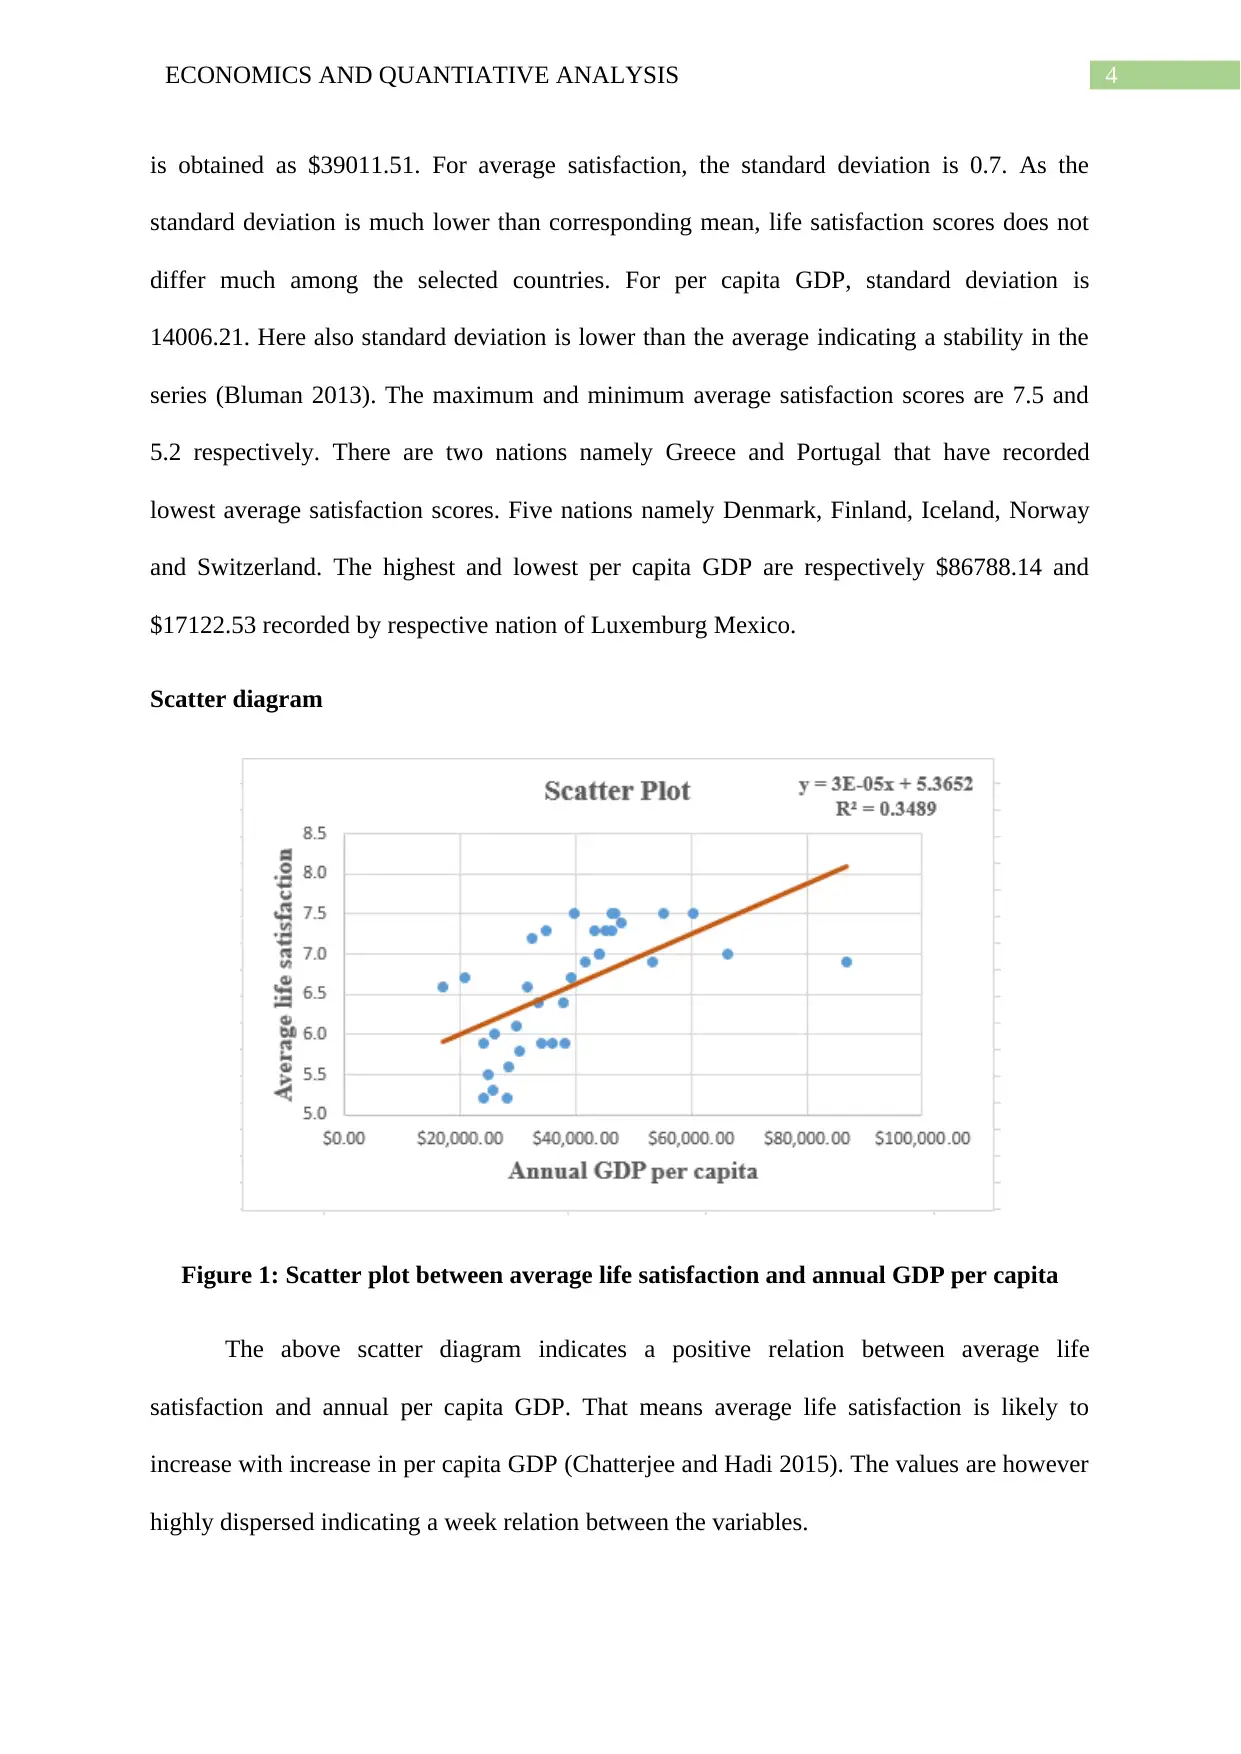
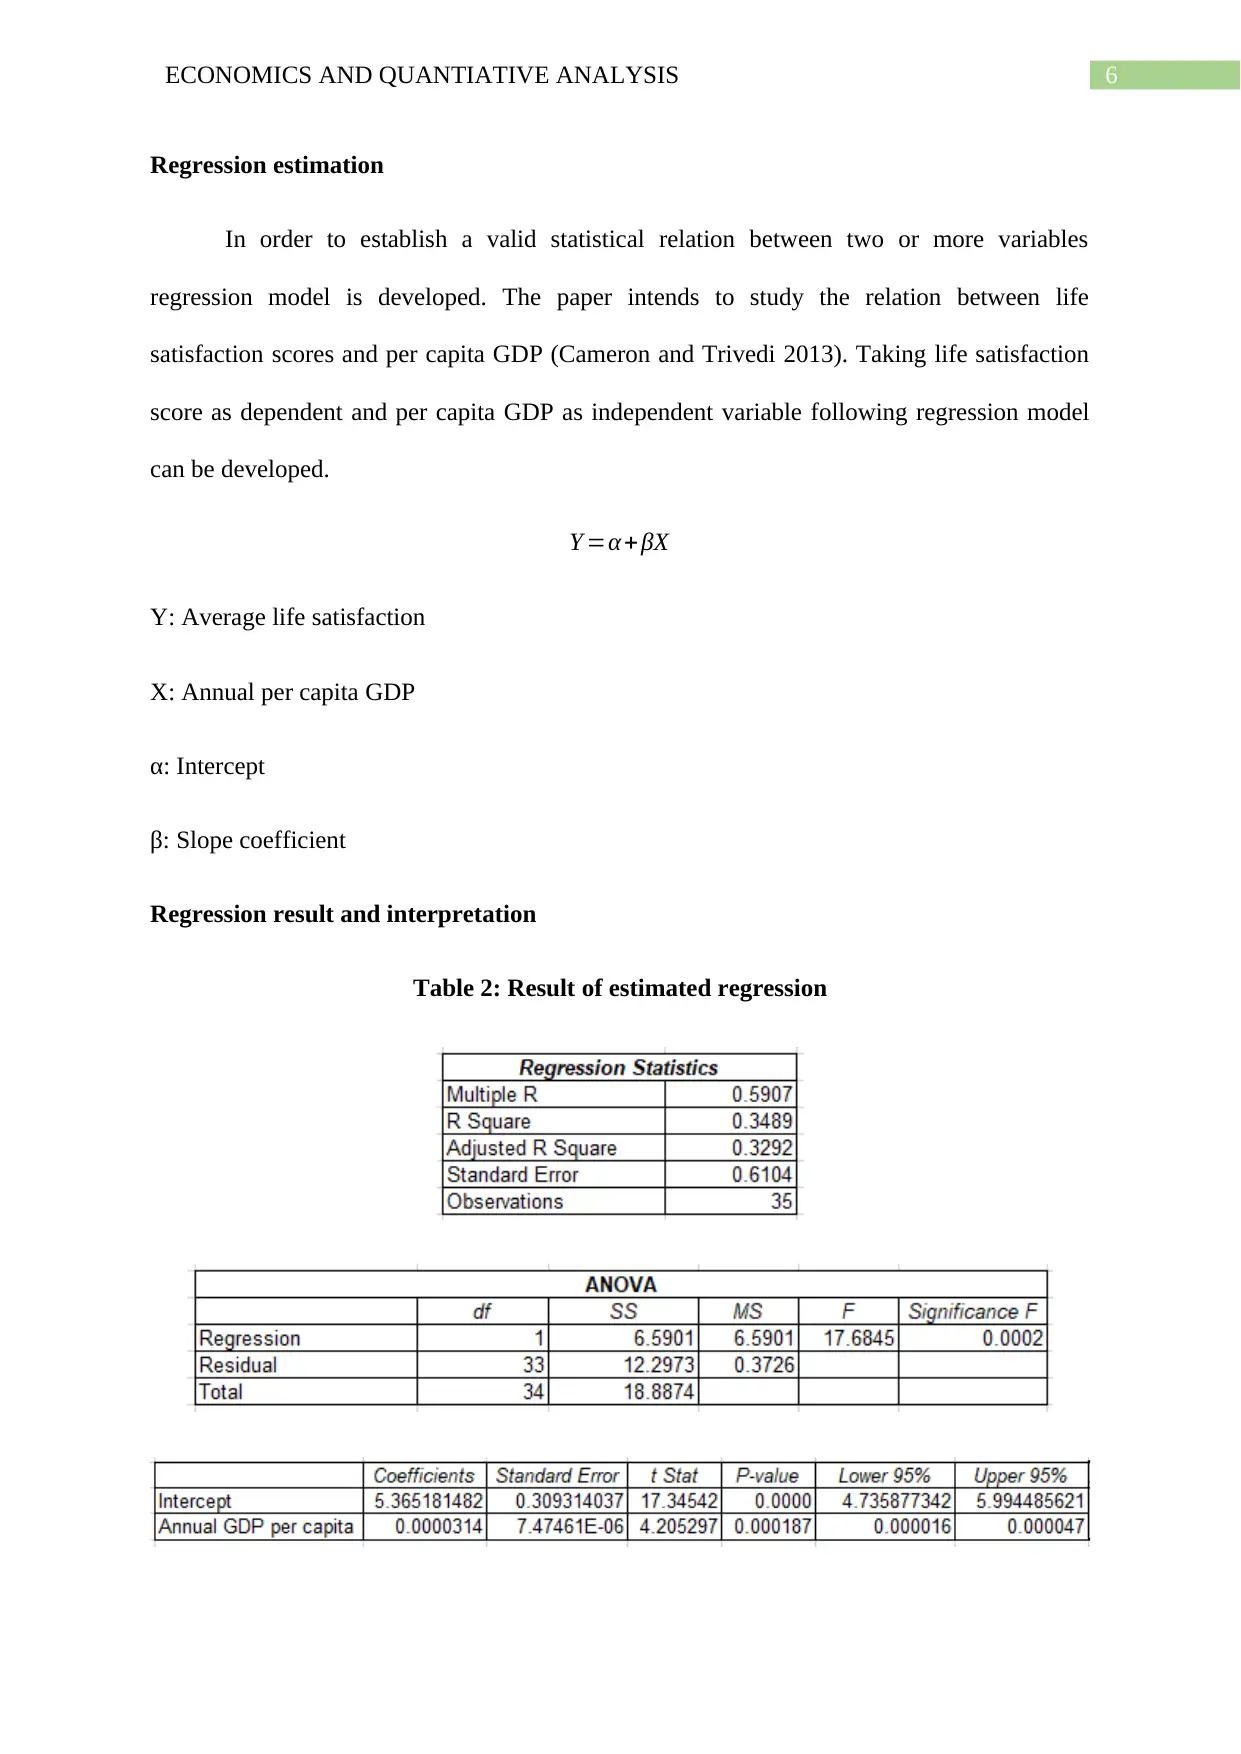
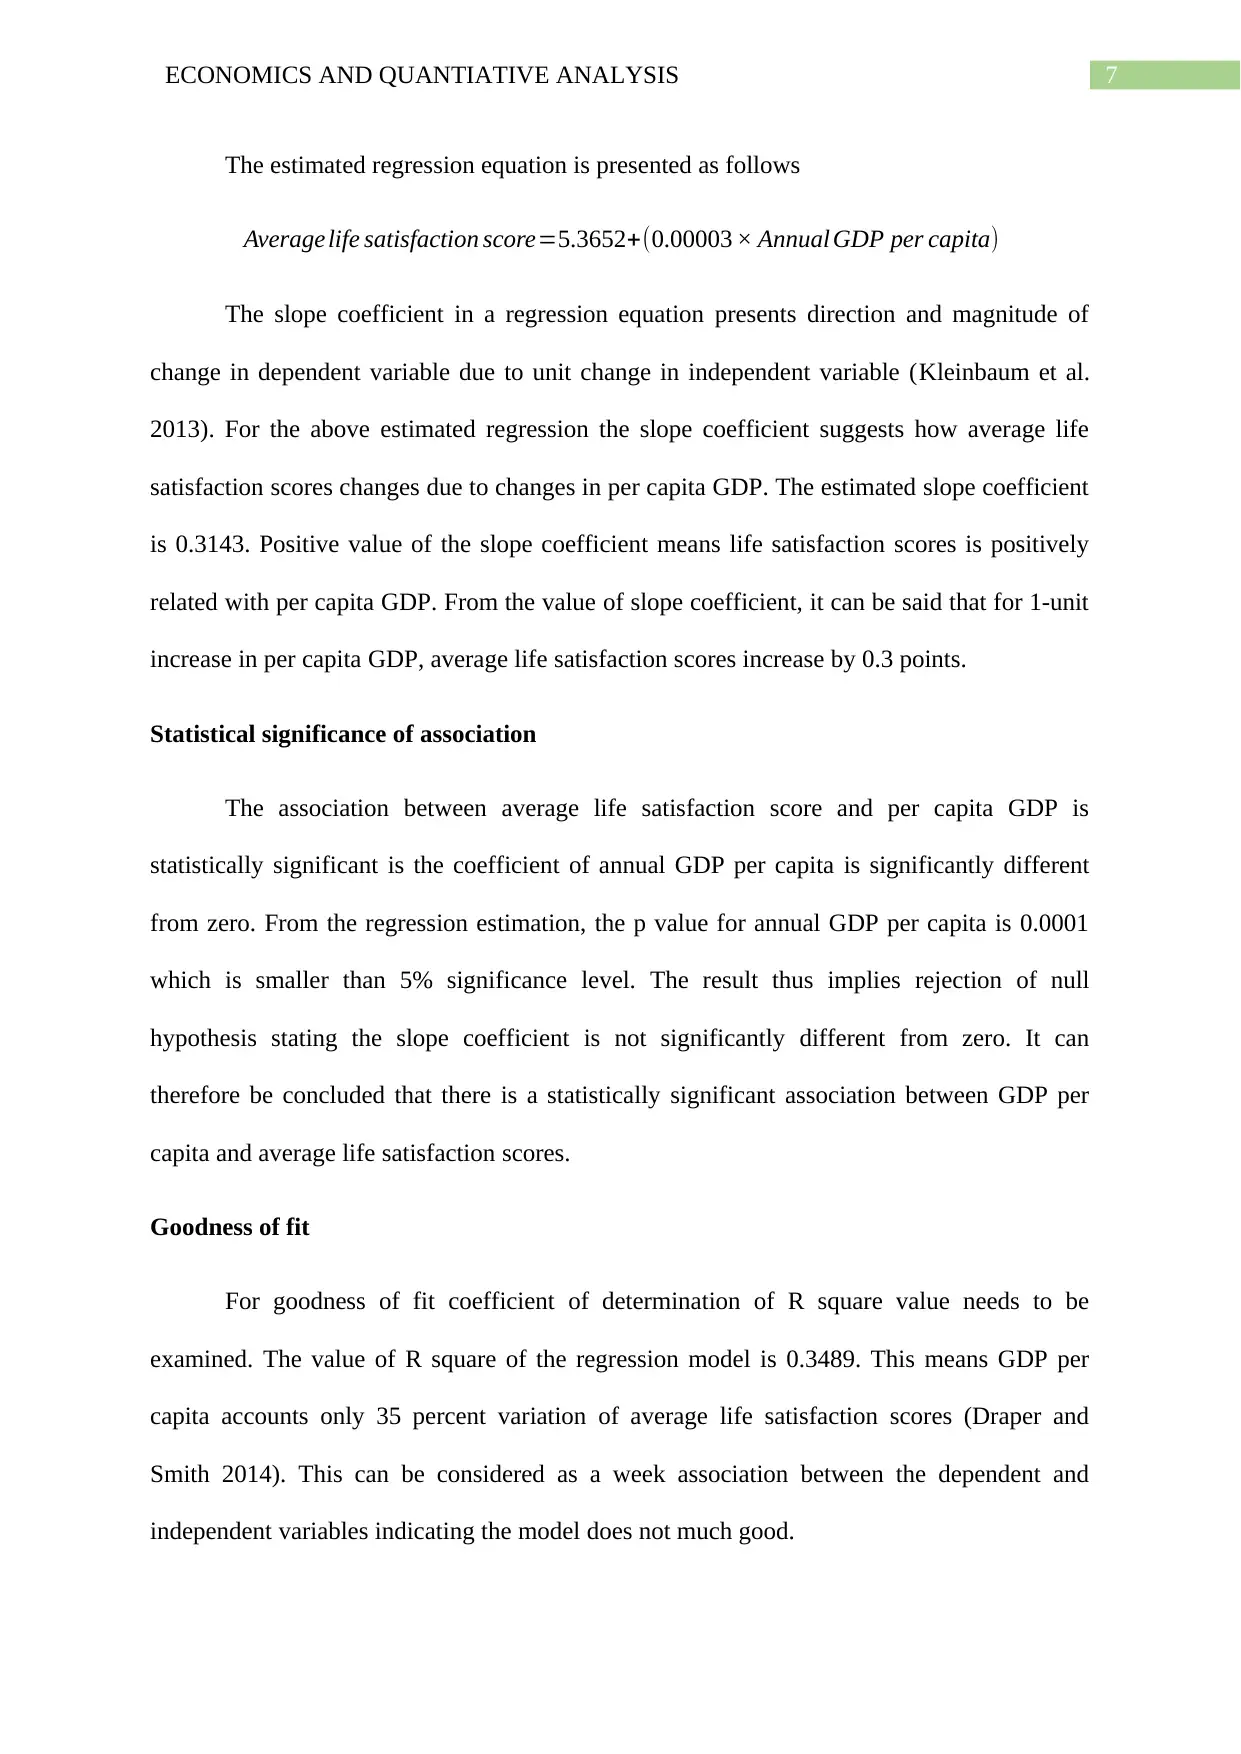
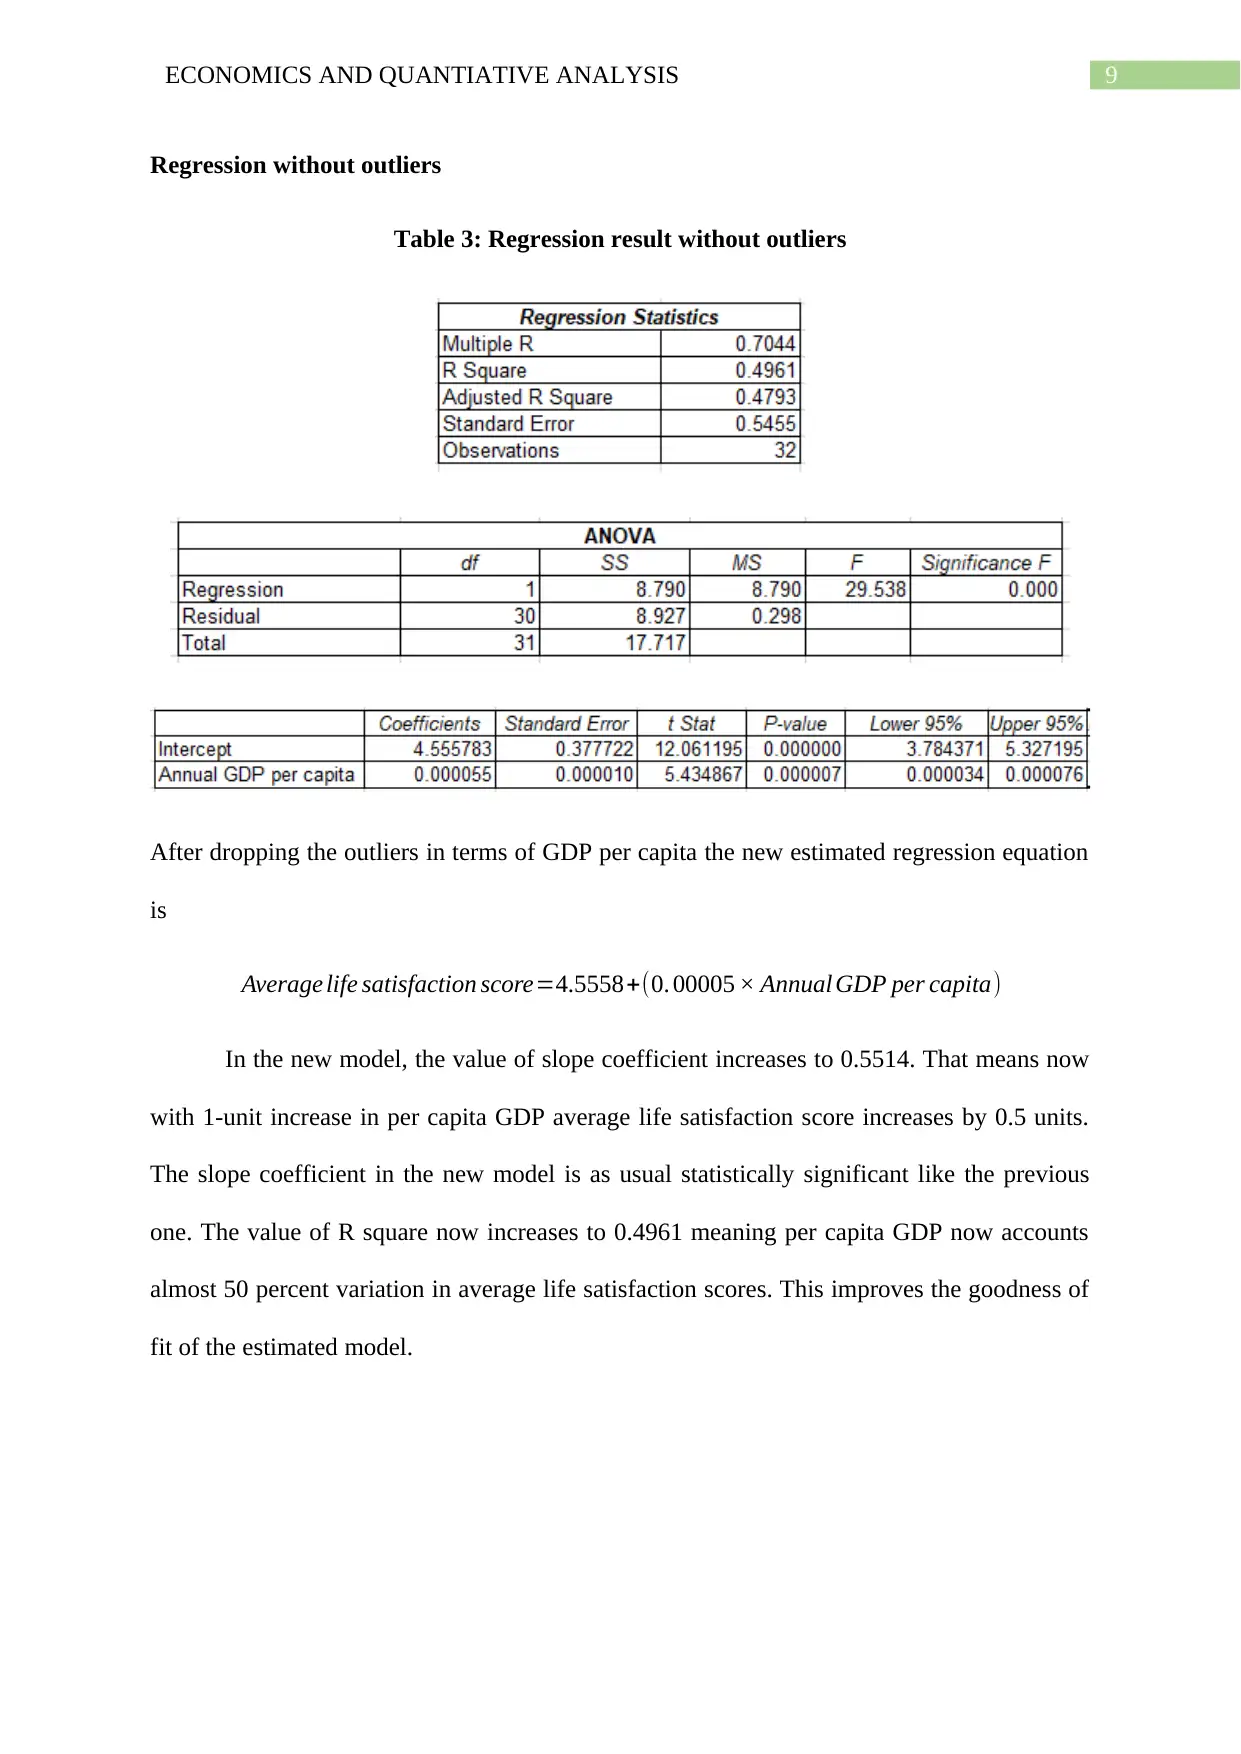
This report examines the statistical association between average life satisfaction and GDP per capita for 35 OECD countries. The analysis begins with a clear statement of purpose and a review of existing literature on the relationship between income and well-being. The methodology section outlines the use of quantitative data analysis, including descriptive statistics, scatter diagrams, and linear regression. The results section presents descriptive statistics, revealing the mean, standard deviation, and range of both life satisfaction scores and per capita GDP. A scatter plot illustrates the initial positive relationship between the two variables. The report then delves into regression analysis, presenting the estimated regression equation, interpretation of the slope coefficient, and the statistical significance of the association. The goodness of fit is assessed using the R-squared value. The analysis is repeated without outliers, with the regression results and goodness of fit being updated. The discussion section addresses the strengths and limitations of the analysis, including the small sample size and the exclusion of other factors affecting life satisfaction. Finally, the report concludes with policy recommendations for improving life satisfaction, such as focusing on health, education, and income distribution.

Running head:ECONOMICS AND QUANTIATIVE ANALYSIS
Economics and Quantiative Analysis
Name of the Student
Name of the University
Course ID
Economics and Quantiative Analysis
Name of the Student
Name of the University
Course ID
Paraphrase This Document
Need a fresh take? Get an instant paraphrase of this document with our AI Paraphraser

1ECONOMICS AND QUANTIATIVE ANALYSIS
Table of Contents
Purpose.......................................................................................................................................2
Background................................................................................................................................2
Method.......................................................................................................................................2
Results........................................................................................................................................3
Descriptive analysis...............................................................................................................3
Scatter diagram.......................................................................................................................4
Regression estimation............................................................................................................5
Regression result and interpretation.......................................................................................5
Statistical significance of association.....................................................................................6
Goodness of fit.......................................................................................................................6
Regression without outliers....................................................................................................7
Discussion..................................................................................................................................8
Recommendation........................................................................................................................8
References..................................................................................................................................9

2ECONOMICS AND QUANTIATIVE ANALYSIS
Purpose
The main purpose of the report is to examine the statistical association between
average life satisfaction and GDP per capita. The debate regarding whether high income of a
nation is association with high level of satisfaction is one of the crucial aspect both for
scientific and policy reason (Proto and Rustichini 2013). The answer may be affirmative or
may be negative.
Background
Per capita GDP of a nation shows average GDP per person. As GDP is considered as
a composite measure of national income, per capita GDP represents average income of a
nation. Per capita GDP is only a quantitative measure. Life satisfaction in contrast refers to
the way people show their feelings, emotions and thinking about present situation and future.
It is an overall measure of well-being (Stevenson and Wolfers 2013). Significant amount of
research has been carried out to find the association between per capita GDP and life
satisfaction. One well-known study confirmed that no significant relationship exists between
aggregate income and happiness (Diener, Tay and Oishi 2013). The study showed in USA per
capita GDP had almost doubled between 1974 and 2004. Despite increase in per capita GDP,
no upward trend had been observed for average happiness. In contrast to this finding, one
study concluded that life satisfaction monotonically increases with increase in average
income at a particular point of time across nations (Steiner, Frey and Hotz 2015). Considering
both side of arguments, the report has carried out independent research in this field.
Method
The relation between life satisfaction and per capita GDP has been evaluated by
adapting technique of quantitative data analysis. In statistical analysis, quantitative data
analysis method refers to the method of evaluating obtained evidences for examining
⊘ This is a preview!⊘
Do you want full access?
Subscribe today to unlock all pages.

Trusted by 1+ million students worldwide

3ECONOMICS AND QUANTIATIVE ANALYSIS
hypotheses framed to address particular research question. Sample data on average life
satisfaction scores and annual per capita GDP has been collected for 35 OECD countries. The
obtained data has been evaluated applying different statistical techniques carried out using
analytical tool pack of excel. In order to present overall description of the data set, descriptive
statistics involving measures such as mean, standard deviation, maximum, minimum and
other are computed. Graphical investigation for identifying the relation between average life
satisfaction and annual per capita GDP has been done by constructing a scatter diagram
considering Annual GDP per capita as independent variable and average life satisfaction as
dependent variable (Draper and Smith 2014). The valid statistical relation between per capita
GDP and life satisfaction has been attempted to be established based on linear regression
result.
Results
Descriptive analysis
Table 1: Descriptive statistics for average life satisfaction and annual per capita GDP
From the descriptive statistics, it has been observed that the average life satisfaction
scores of the selected OECD nation is 6.6. The mean annual per capita GDP for the countries
Paraphrase This Document
Need a fresh take? Get an instant paraphrase of this document with our AI Paraphraser

4ECONOMICS AND QUANTIATIVE ANALYSIS
is obtained as $39011.51. For average satisfaction, the standard deviation is 0.7. As the
standard deviation is much lower than corresponding mean, life satisfaction scores does not
differ much among the selected countries. For per capita GDP, standard deviation is
14006.21. Here also standard deviation is lower than the average indicating a stability in the
series (Bluman 2013). The maximum and minimum average satisfaction scores are 7.5 and
5.2 respectively. There are two nations namely Greece and Portugal that have recorded
lowest average satisfaction scores. Five nations namely Denmark, Finland, Iceland, Norway
and Switzerland. The highest and lowest per capita GDP are respectively $86788.14 and
$17122.53 recorded by respective nation of Luxemburg Mexico.
Scatter diagram
Figure 1: Scatter plot between average life satisfaction and annual GDP per capita
The above scatter diagram indicates a positive relation between average life
satisfaction and annual per capita GDP. That means average life satisfaction is likely to
increase with increase in per capita GDP (Chatterjee and Hadi 2015). The values are however
highly dispersed indicating a week relation between the variables.

5ECONOMICS AND QUANTIATIVE ANALYSIS
⊘ This is a preview!⊘
Do you want full access?
Subscribe today to unlock all pages.

Trusted by 1+ million students worldwide

6ECONOMICS AND QUANTIATIVE ANALYSIS
Regression estimation
In order to establish a valid statistical relation between two or more variables
regression model is developed. The paper intends to study the relation between life
satisfaction scores and per capita GDP (Cameron and Trivedi 2013). Taking life satisfaction
score as dependent and per capita GDP as independent variable following regression model
can be developed.
Y =α +βX
Y: Average life satisfaction
X: Annual per capita GDP
α: Intercept
β: Slope coefficient
Regression result and interpretation
Table 2: Result of estimated regression
Paraphrase This Document
Need a fresh take? Get an instant paraphrase of this document with our AI Paraphraser

7ECONOMICS AND QUANTIATIVE ANALYSIS
The estimated regression equation is presented as follows
Average life satisfaction score=5.3652+(0.00003 × Annual GDP per capita)
The slope coefficient in a regression equation presents direction and magnitude of
change in dependent variable due to unit change in independent variable (Kleinbaum et al.
2013). For the above estimated regression the slope coefficient suggests how average life
satisfaction scores changes due to changes in per capita GDP. The estimated slope coefficient
is 0.3143. Positive value of the slope coefficient means life satisfaction scores is positively
related with per capita GDP. From the value of slope coefficient, it can be said that for 1-unit
increase in per capita GDP, average life satisfaction scores increase by 0.3 points.
Statistical significance of association
The association between average life satisfaction score and per capita GDP is
statistically significant is the coefficient of annual GDP per capita is significantly different
from zero. From the regression estimation, the p value for annual GDP per capita is 0.0001
which is smaller than 5% significance level. The result thus implies rejection of null
hypothesis stating the slope coefficient is not significantly different from zero. It can
therefore be concluded that there is a statistically significant association between GDP per
capita and average life satisfaction scores.
Goodness of fit
For goodness of fit coefficient of determination of R square value needs to be
examined. The value of R square of the regression model is 0.3489. This means GDP per
capita accounts only 35 percent variation of average life satisfaction scores (Draper and
Smith 2014). This can be considered as a week association between the dependent and
independent variables indicating the model does not much good.

8ECONOMICS AND QUANTIATIVE ANALYSIS
⊘ This is a preview!⊘
Do you want full access?
Subscribe today to unlock all pages.

Trusted by 1+ million students worldwide

9ECONOMICS AND QUANTIATIVE ANALYSIS
Regression without outliers
Table 3: Regression result without outliers
After dropping the outliers in terms of GDP per capita the new estimated regression equation
is
Average life satisfaction score=4.5558+(0. 00005 × Annual GDP per capita)
In the new model, the value of slope coefficient increases to 0.5514. That means now
with 1-unit increase in per capita GDP average life satisfaction score increases by 0.5 units.
The slope coefficient in the new model is as usual statistically significant like the previous
one. The value of R square now increases to 0.4961 meaning per capita GDP now accounts
almost 50 percent variation in average life satisfaction scores. This improves the goodness of
fit of the estimated model.
Paraphrase This Document
Need a fresh take? Get an instant paraphrase of this document with our AI Paraphraser

10ECONOMICS AND QUANTIATIVE ANALYSIS
Discussion
The result finds a statistically significant association between GDP per capita and
average life satisfaction scores. That means average income positively influences life
satisfaction scores.
The main strength of the analysis is that it uses quantitative data analysis technique
which is easy to perform and gives simple result. The report however considers sample of
only 35 countries. A relatively small sample is one limitation. Another limitation is that the
model does not consider other factors (except per capita GDP) that may affects satisfaction.
The paper gives consistent result with previous literatures supporting average income
to be a positive determinant of life satisfaction (Oishi and Diener 2014). The findings thus
have a clear policy implication.
Recommendation
Depending on the findings following recommendation can be made for policy makers
aiming to improve life satisfaction score.
Policymakers should focus on improving health and education of nation that can
contribute to a higher per capita GDP and hence, a higher life satisfaction.
In evaluating average life satisfaction policymakers should also considers factors
other than per capita GDP.
Increasing only per capita GDP does not increase life satisfaction of all people. Focus
should also be given to ensure an equal distribution of income as well.

11ECONOMICS AND QUANTIATIVE ANALYSIS
References
Bluman, A.G., 2013. Elementary statistics: A step by step approach: A brief version (No.
519.5 B585E.). McGraw-Hill.
Cameron, A.C. and Trivedi, P.K., 2013. Regression analysis of count data (Vol. 53).
Cambridge university press.
Chatterjee, S. and Hadi, A.S., 2015. Regression analysis by example. John Wiley & Sons.
Diener, E., Tay, L. and Oishi, S., 2013. Rising income and the subjective well-being of
nations. Journal of personality and social psychology, 104(2), p.267.
Draper, N.R. and Smith, H., 2014. Applied regression analysis(Vol. 326). John Wiley &
Sons.
Kleinbaum, D.G., Kupper, L.L., Nizam, A. and Rosenberg, E.S., 2013. Applied regression
analysis and other multivariable methods. Nelson Education.
Oishi, S. and Diener, E., 2014. Residents of poor nations have a greater sense of meaning in
life than residents of wealthy nations. Psychological Science, 25(2), pp.422-430.
Proto, E. and Rustichini, A., 2013. A reassessment of the relationship between GDP and life
satisfaction. PloS one, 8(11), p.e79358.
Steiner, L., Frey, B. and Hotz, S., 2015. European capitals of culture and life
satisfaction. Urban studies, 52(2), pp.374-394.
Stevenson, B. and Wolfers, J., 2013. Subjective well-being and income: Is there any evidence
of satiation?. American Economic Review, 103(3), pp.598-604.
⊘ This is a preview!⊘
Do you want full access?
Subscribe today to unlock all pages.

Trusted by 1+ million students worldwide
1 out of 12
Related Documents
Your All-in-One AI-Powered Toolkit for Academic Success.
+13062052269
info@desklib.com
Available 24*7 on WhatsApp / Email
Unlock your academic potential
Copyright © 2020–2025 A2Z Services. All Rights Reserved. Developed and managed by ZUCOL.


