Essay on Sources of GDP Per Capita Increase (Post WWII)
VerifiedAdded on 2022/09/15
|12
|2068
|17
Essay
AI Summary
This essay delves into the macroeconomic factors driving the steady increase in GDP per capita across developed and developing countries since the Second World War. It begins with an introduction to macroeconomic models, emphasizing the role of aggregate demand and supply. The essay explores various economic indicators, including GDP, national income, and employment, and highlights the economic shifts post-World War II. It then examines the components of aggregate demand (consumption, investment, government expenditure, and net exports) and aggregate supply, illustrating their relationship to GDP growth. The essay discusses national income, circular flow of the economy and GDP deflator. The analysis incorporates statistical data to support the arguments and concludes by summarizing the key factors contributing to economic growth during different historical periods.
ECONOMICS
Paraphrase This Document
Need a fresh take? Get an instant paraphrase of this document with our AI Paraphraser

Contents
Introduction................................................................................................................................3
Macroeconomic models.............................................................................................................3
Conclusion..................................................................................................................................9
References................................................................................................................................10
Topic 2
With the assistance of economic models and statistical data, identify and explain the
fundamental sources of the steady increase in GDP per capita in most developed and
developing countries around the world since the Second World War.
Introduction
The essay brings out a discussion on macroeconomics, which will show the impact on
national economics. The economic models will measure these balances and economic
circumstances. Main source of increasing GDP per capita is directly related to the concept of
aggregate demand and aggregate supply. Other more indicators will include GDP (domestic
income), national income (NNP), total employment contribution. The essay will further show
dynamic changes occurred in the world economy after Second World War. It is often said
that the era of World War is the greatest era, in which economic expansion has showed its
golden times in both developing as well as developed country.
US has experienced high economic growth, which will be differently shown as the collective
impact on economic models. Current policy makers have been offering greater scope to
address systemic issue, which will continuously hamper the progress of sustainable goals for
the economy (Russo, Riccetti, & Gallegati, 2016). Macro economies indicates the reflection
of high aggregate demand to high aggregate supply. In context to Indian economy, which is a
developing economy, it is seen that every model is either positively or negatively
proportional GDP rate (Bohanon, 2012).
Macroeconomic models
Economic models describes demand of goods, supply of goods, national income generated,
total employment, and GDP growth (Leduc, & Liu, 2016).
⊘ This is a preview!⊘
Do you want full access?
Subscribe today to unlock all pages.
Trusted by 1+ million students worldwide
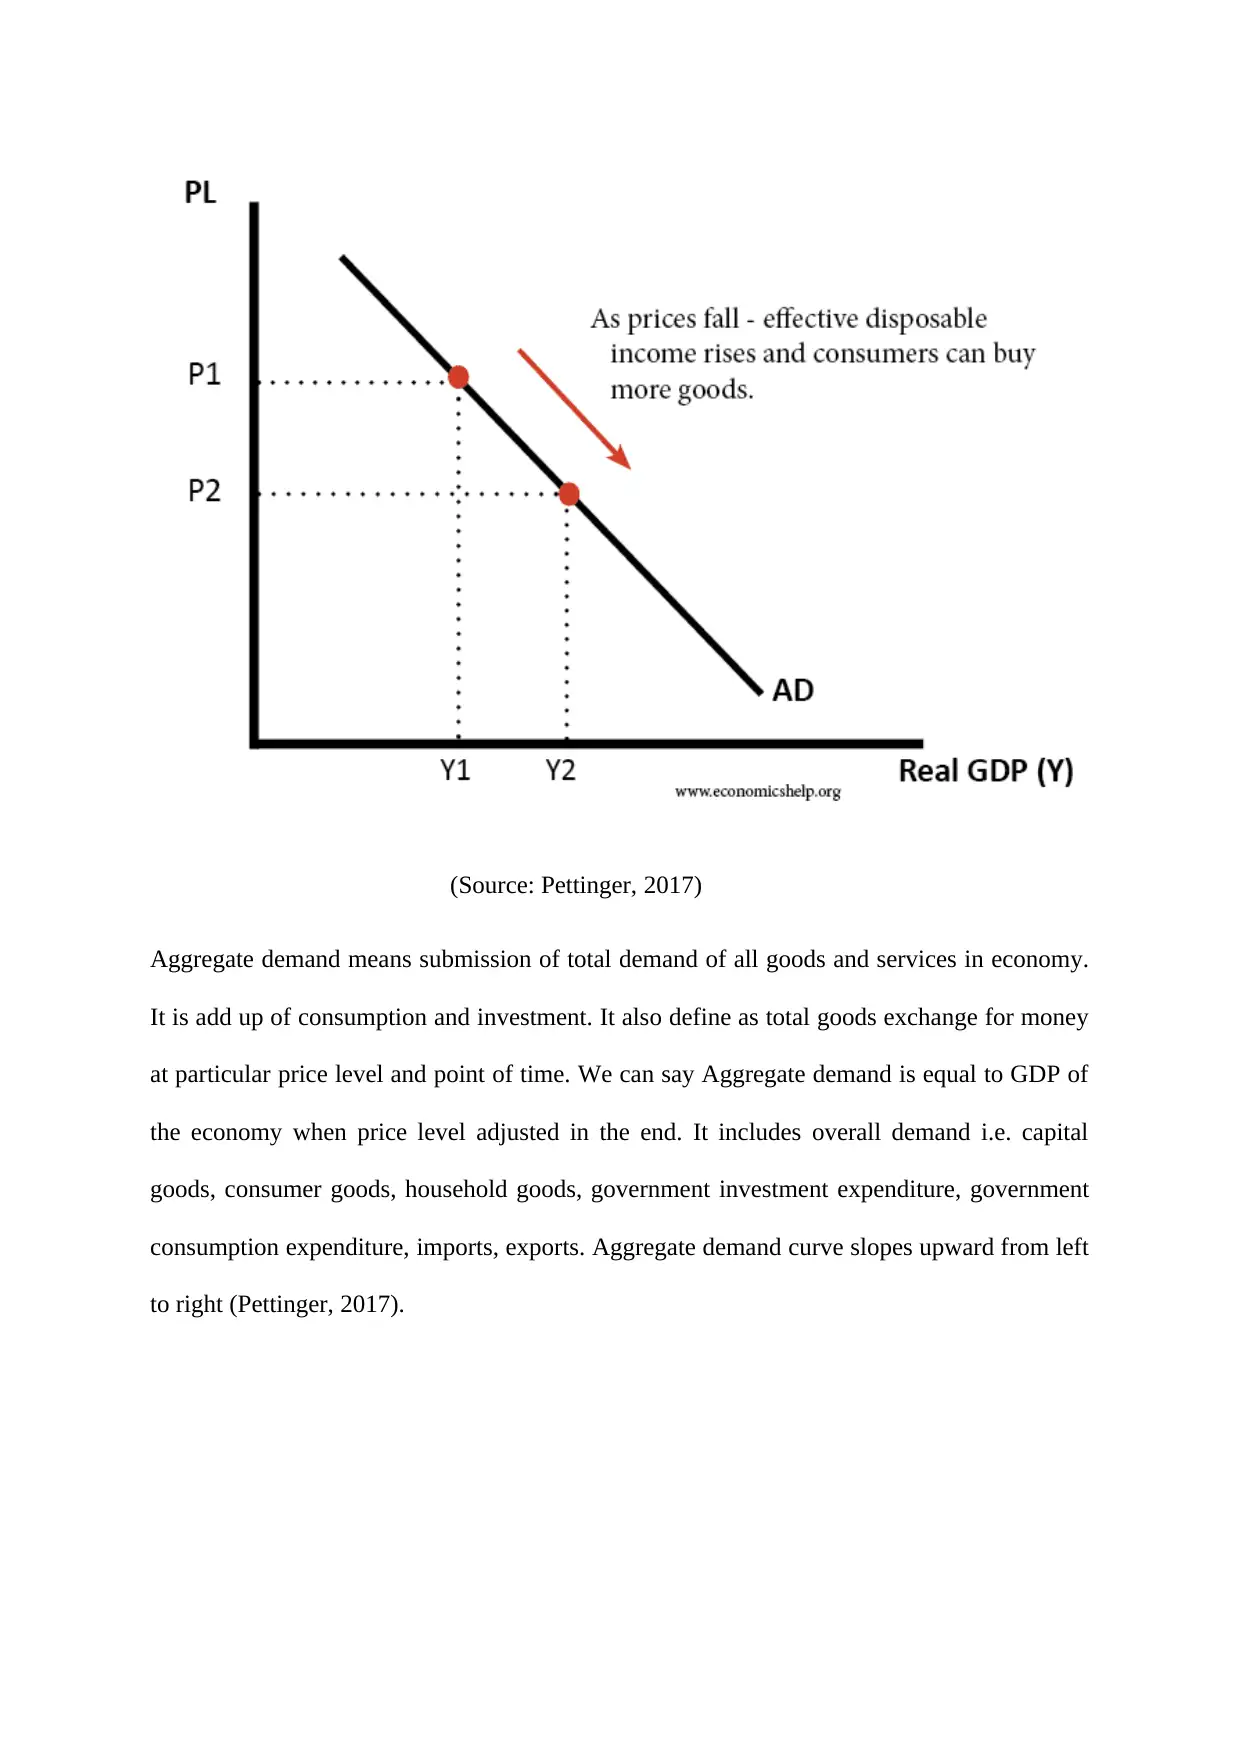
(Source: Pettinger, 2017)
Aggregate demand means submission of total demand of all goods and services in economy.
It is add up of consumption and investment. It also define as total goods exchange for money
at particular price level and point of time. We can say Aggregate demand is equal to GDP of
the economy when price level adjusted in the end. It includes overall demand i.e. capital
goods, consumer goods, household goods, government investment expenditure, government
consumption expenditure, imports, exports. Aggregate demand curve slopes upward from left
to right (Pettinger, 2017).
Paraphrase This Document
Need a fresh take? Get an instant paraphrase of this document with our AI Paraphraser
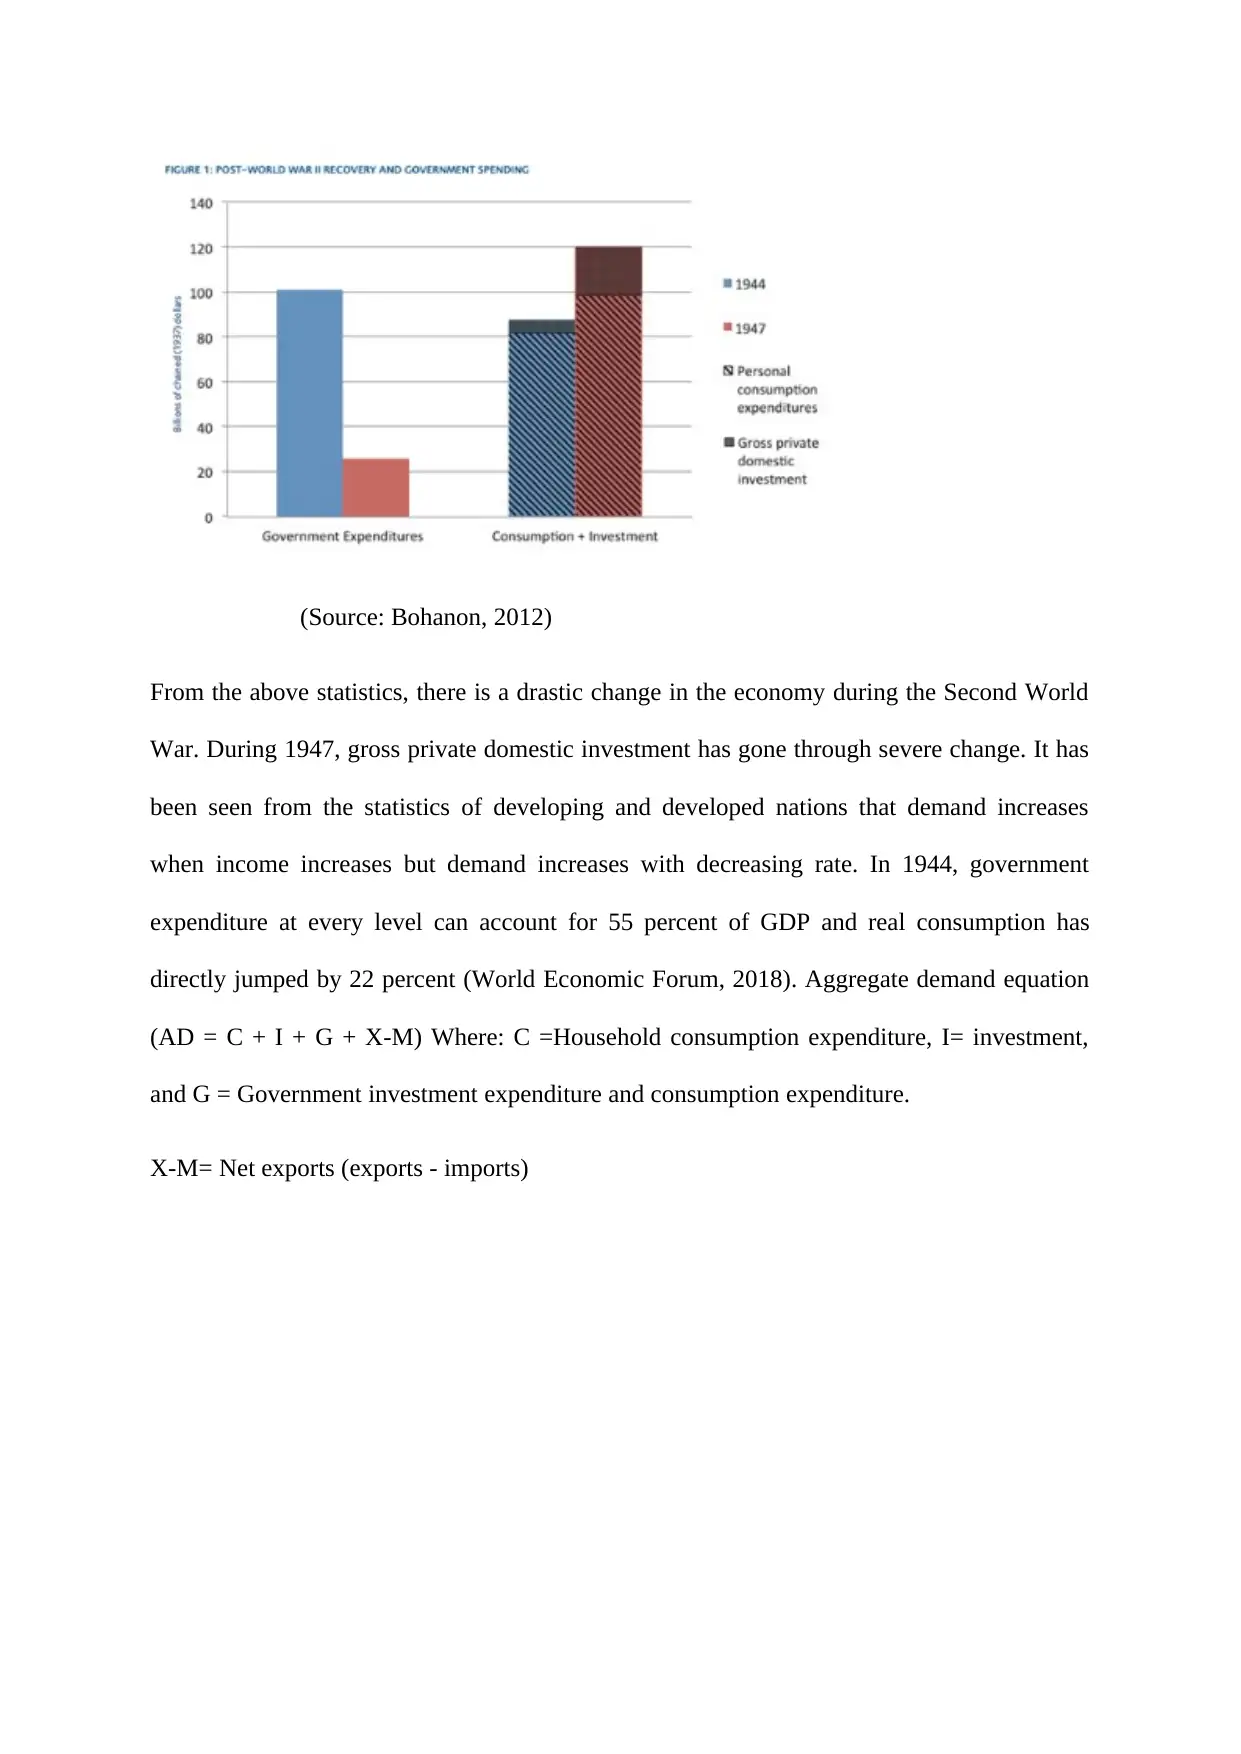
(Source: Bohanon, 2012)
From the above statistics, there is a drastic change in the economy during the Second World
War. During 1947, gross private domestic investment has gone through severe change. It has
been seen from the statistics of developing and developed nations that demand increases
when income increases but demand increases with decreasing rate. In 1944, government
expenditure at every level can account for 55 percent of GDP and real consumption has
directly jumped by 22 percent (World Economic Forum, 2018). Aggregate demand equation
(AD = C + I + G + X-M) Where: C =Household consumption expenditure, I= investment,
and G = Government investment expenditure and consumption expenditure.
X-M= Net exports (exports - imports)
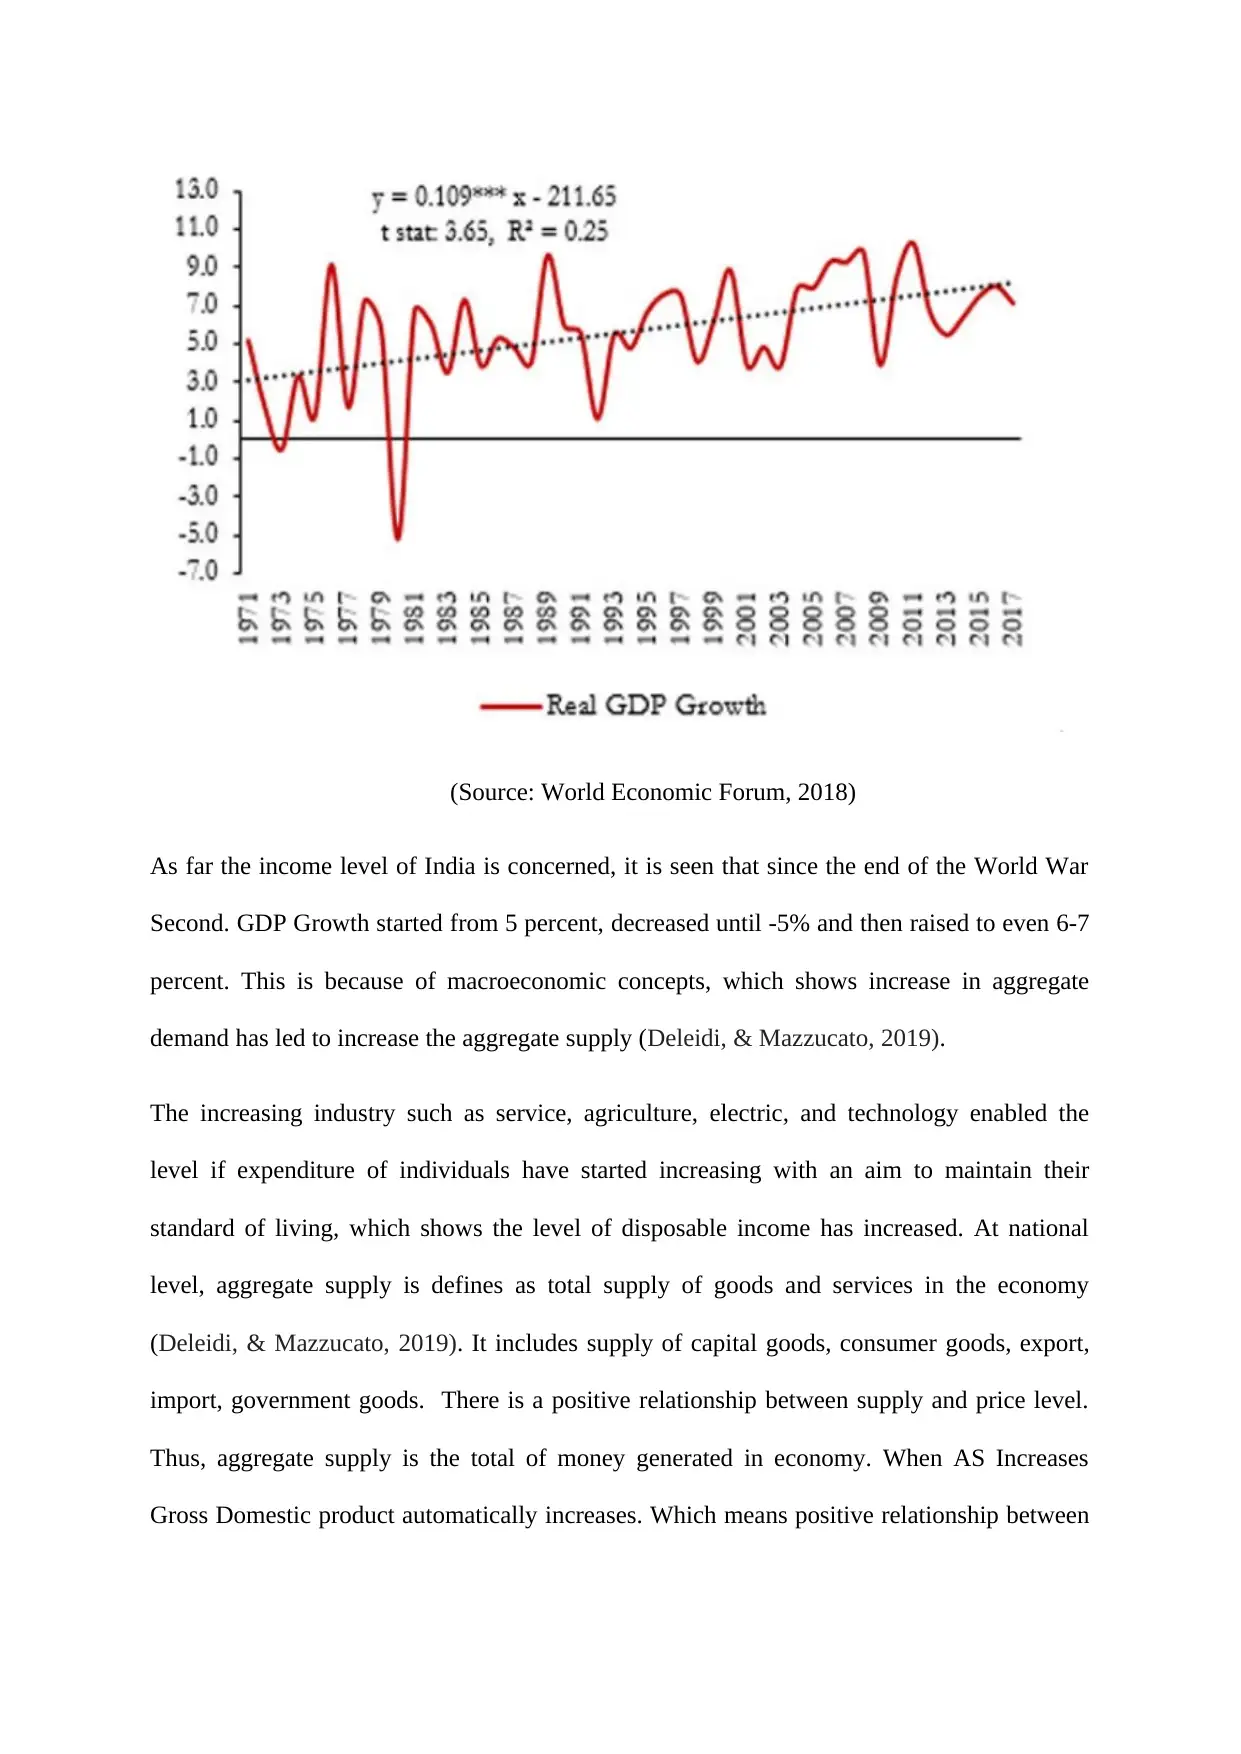
(Source: World Economic Forum, 2018)
As far the income level of India is concerned, it is seen that since the end of the World War
Second. GDP Growth started from 5 percent, decreased until -5% and then raised to even 6-7
percent. This is because of macroeconomic concepts, which shows increase in aggregate
demand has led to increase the aggregate supply (Deleidi, & Mazzucato, 2019).
The increasing industry such as service, agriculture, electric, and technology enabled the
level if expenditure of individuals have started increasing with an aim to maintain their
standard of living, which shows the level of disposable income has increased. At national
level, aggregate supply is defines as total supply of goods and services in the economy
(Deleidi, & Mazzucato, 2019). It includes supply of capital goods, consumer goods, export,
import, government goods. There is a positive relationship between supply and price level.
Thus, aggregate supply is the total of money generated in economy. When AS Increases
Gross Domestic product automatically increases. Which means positive relationship between
⊘ This is a preview!⊘
Do you want full access?
Subscribe today to unlock all pages.
Trusted by 1+ million students worldwide
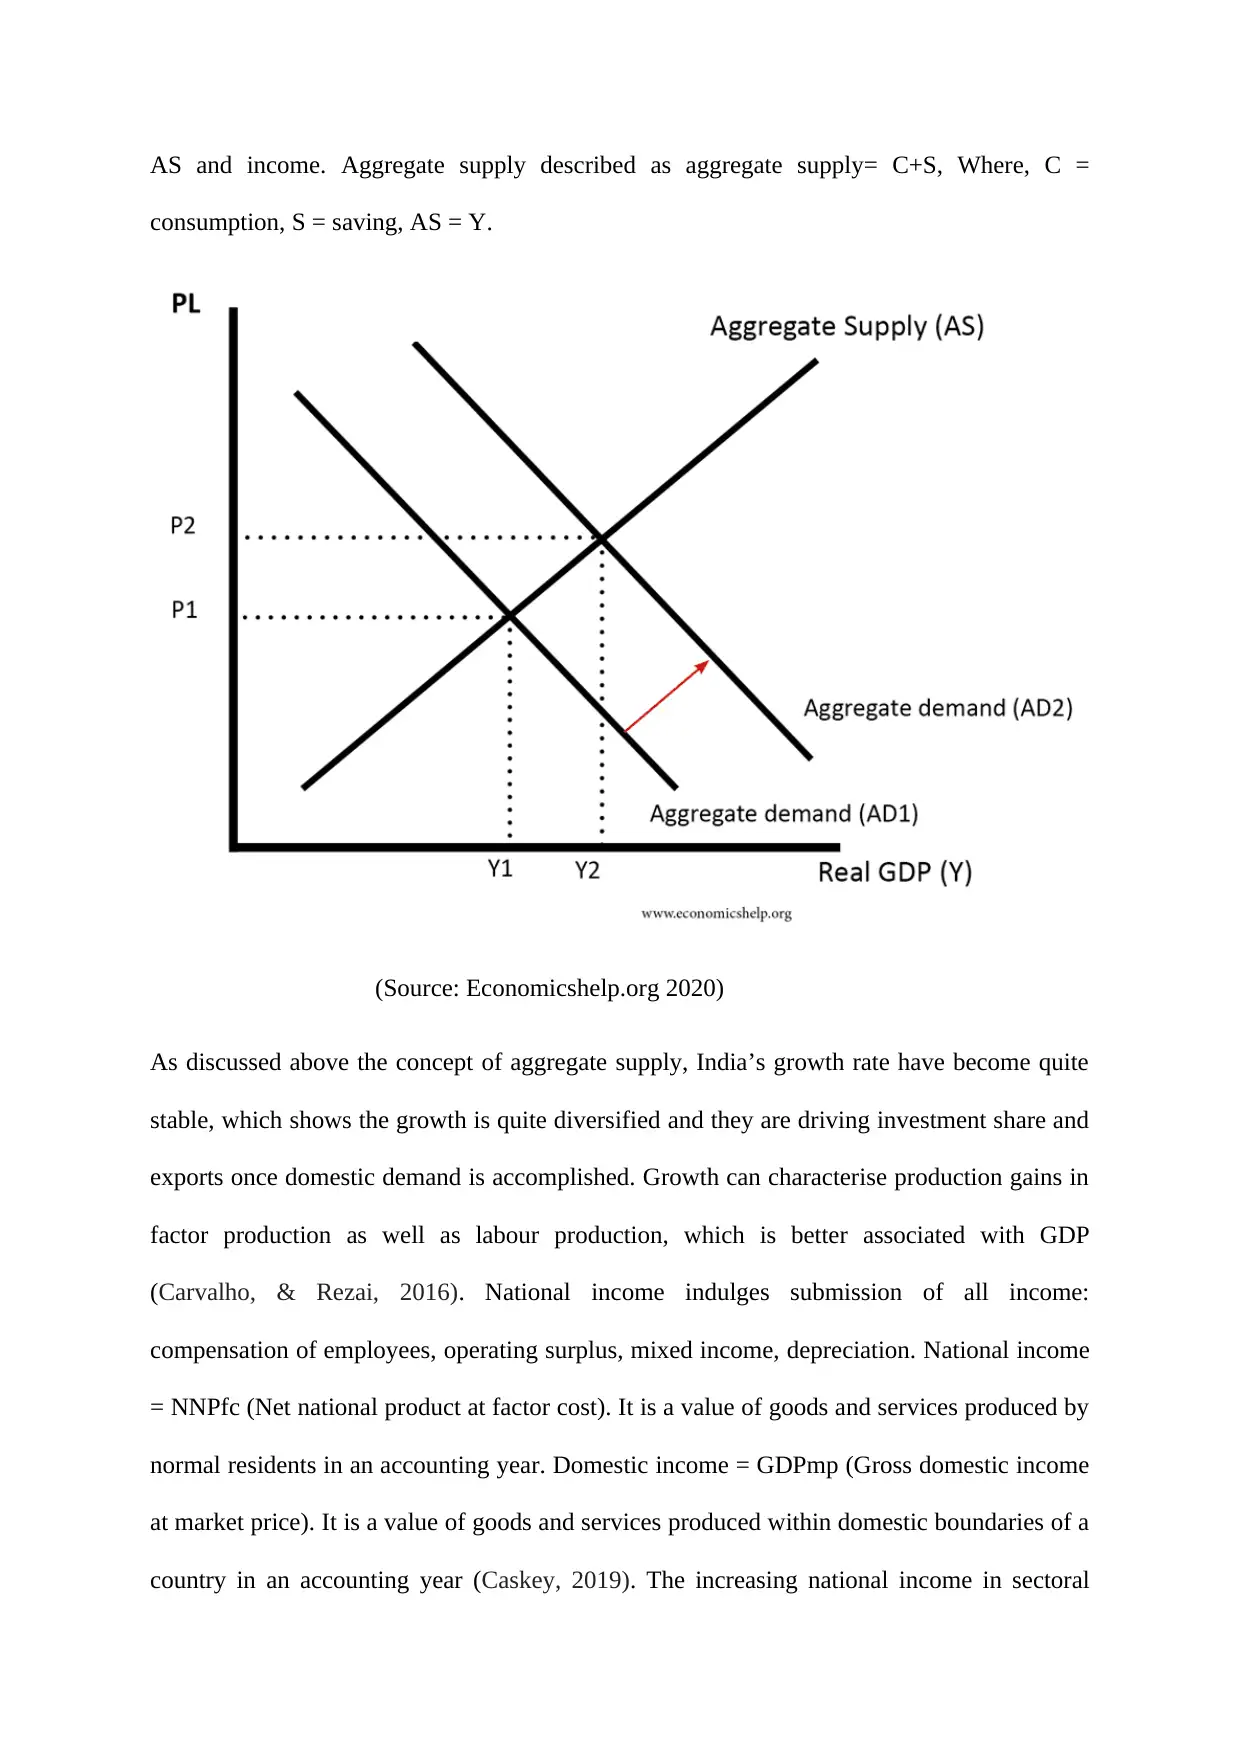
AS and income. Aggregate supply described as aggregate supply= C+S, Where, C =
consumption, S = saving, AS = Y.
(Source: Economicshelp.org 2020)
As discussed above the concept of aggregate supply, India’s growth rate have become quite
stable, which shows the growth is quite diversified and they are driving investment share and
exports once domestic demand is accomplished. Growth can characterise production gains in
factor production as well as labour production, which is better associated with GDP
(Carvalho, & Rezai, 2016). National income indulges submission of all income:
compensation of employees, operating surplus, mixed income, depreciation. National income
= NNPfc (Net national product at factor cost). It is a value of goods and services produced by
normal residents in an accounting year. Domestic income = GDPmp (Gross domestic income
at market price). It is a value of goods and services produced within domestic boundaries of a
country in an accounting year (Caskey, 2019). The increasing national income in sectoral
Paraphrase This Document
Need a fresh take? Get an instant paraphrase of this document with our AI Paraphraser
distribution, which took place in India planning period. In 1950 and 1951, the portion of
primary sector was the major contributor with 55 percent, which contributes to 16.1 percent
for secondary sector. The national income in India has perceived that it has achieved 9142
crore in 1951, which has increased to 10,92,962 in 1997 that has improved by 119 times for
last 46 years. Nominal national income is estimated at 181 lakh crore in 2019 and 2020
(World Economic Forum, 2018).
Average propensity to consume is the proportion of aggregate demand and income. It is
known as APC. It reflects the ratio of consumption from the income. APC=
Consumption/income. Average propensity to save is the proportion of aggregate supply and
income. It is known as APS. It reflects the percentage of saving in the income earned (Leduc,
& Liu, 2016). APS= saving/ income, Addition of APC and APS is equal to one.
National income is sum total of income generated in territory by normal residents of country.
In addition, when income generated within domestic territory, does not affected by residents
or non-residents then it is known as domestic income (Suman, 2019).
Circular flow of economy is a persistent flow of money among different sector of economy. It
cannot be neither start nor stop. It is an economic model, which show economy system
between households and firms (Carvalho, & Rezai, 2016). According to this model household
offers factor services i.e. land, labour, capital, entrepreneur to the producing firms. In return,
of it firms offer rent for land, wages for labour, and interest for capital and profit for
entrepreneur (World Economic Forum, 2018). The money offered by firm to household are
expend by them on consumption expenditure. All in all the money paid by firms as factor
payment are returned to firm as expenditure on consumption. GDP deflator is used show
price inflation in an economy. It is proportion of nominal GDP and real GDP multiplying by
100 (World Bank, PwC analysis, 2018). For inflation for both the countries, it is obvious that
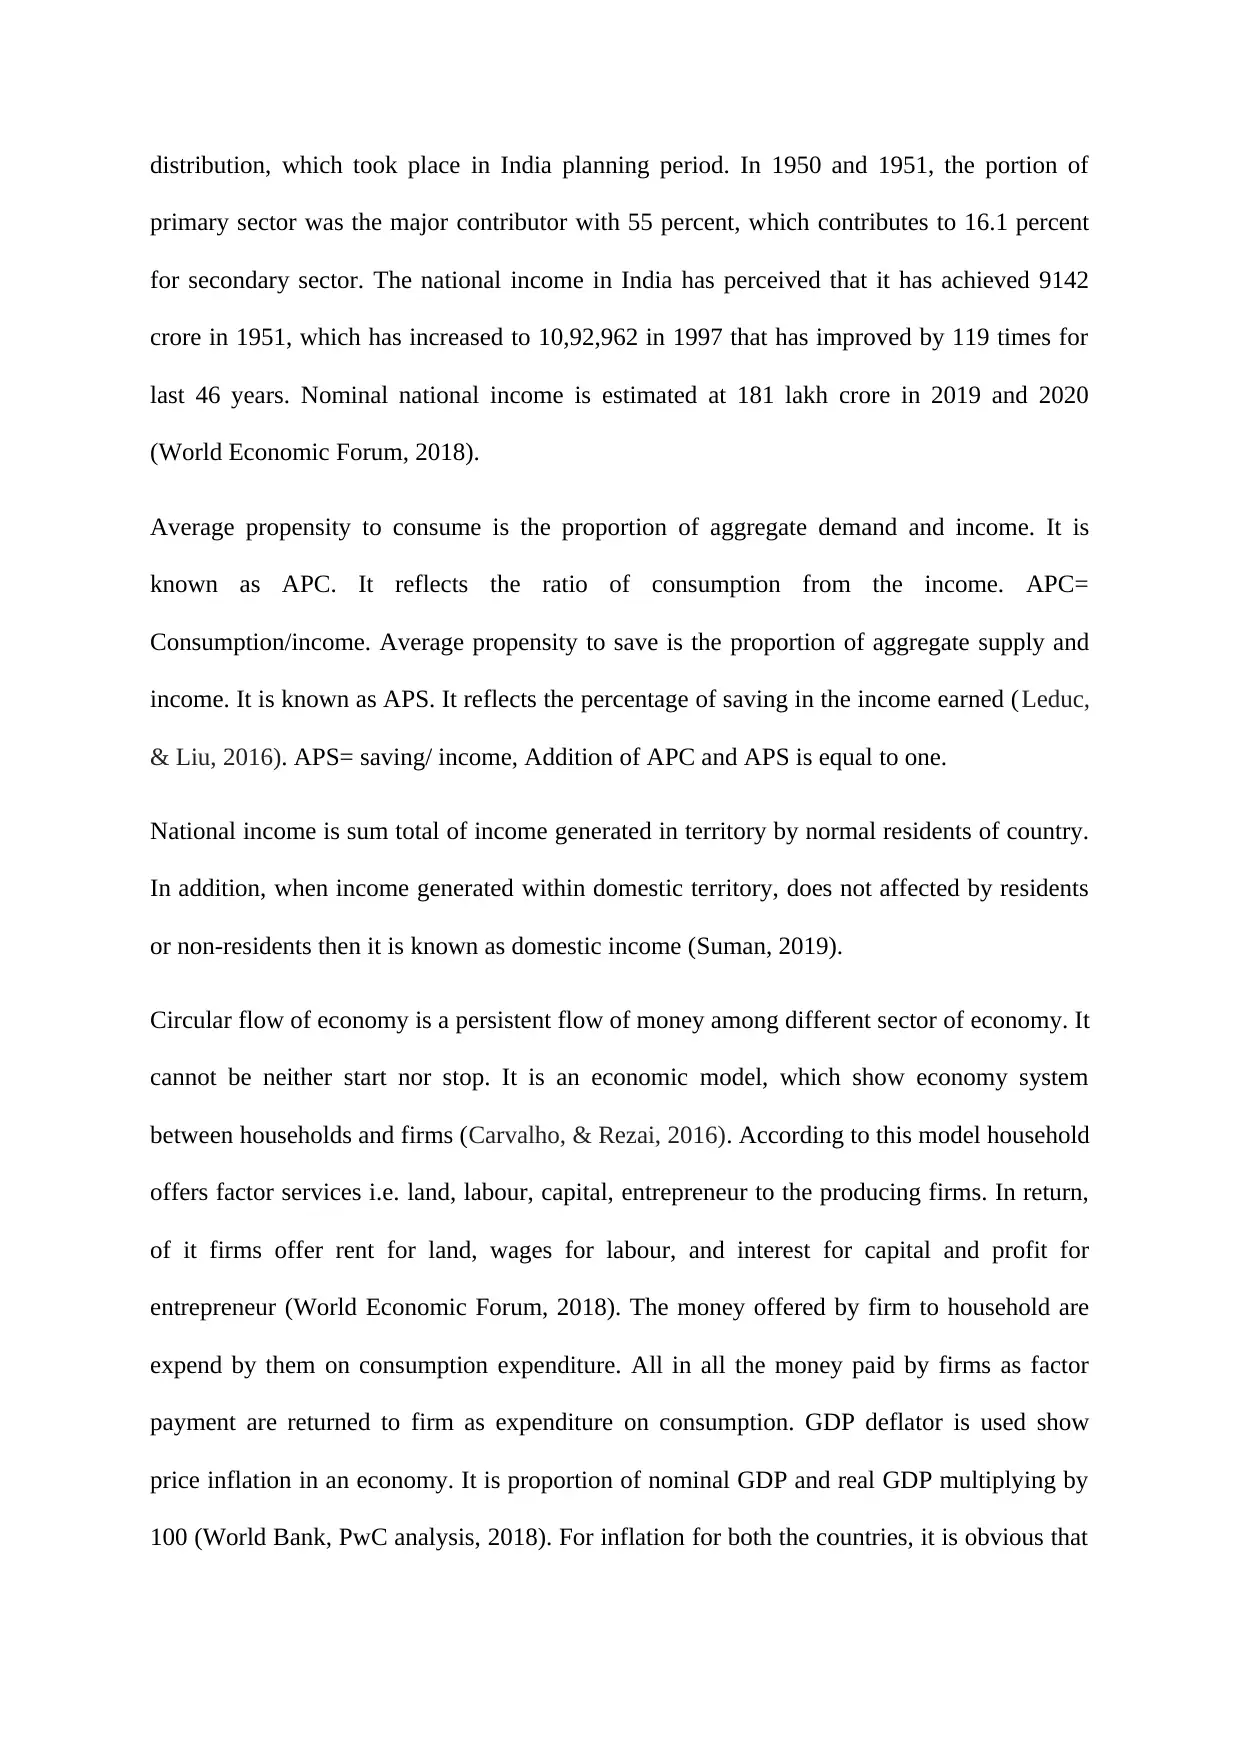
with the increase in purchasing power of customers, the liquidity increases so as inflation.
This propensity to consume and purchase will fasten the circular flow of income in the
economy. The GDP deflator is measured according to producer prices, change in producer
price form previous year, and the export price (Economicshelp.org 2020). For India, GDP
deflator will be 138.8 for 2020. For US, the GDP deflator is expected at 112.75. Lower is the
GDP Deflator; positive is the impact on the GDP and economy.
(Source: Tutor2u, 2018)
Conclusion
From the above discussion, it is important to note each historical period such as 1945-1970,
and 1980-2016 and so on has incurred unique situations in the economy. Destructive
conflicts, which subject to economic regulation with an aim to generate maximum economic
health by generating and maximising private spending as defined in aggregate demand. Price
mechanism is free to use efficiently direct resource for best valued according to the aggregate
supply of country. It implies that regulations, which can impede market procedure, which will
⊘ This is a preview!⊘
Do you want full access?
Subscribe today to unlock all pages.
Trusted by 1+ million students worldwide

be eliminated as the spending government declines. From the above discussion, it is seen that
America has enjoyed higher prosperity after Second World War, which is the result of
political agenda as the by-product of how government has promoted private spending and
investments.
America has enjoyed higher prosperity after Second World War, which is the result of
political agenda as the by-product of how government has promoted private spending and
investments.
Paraphrase This Document
Need a fresh take? Get an instant paraphrase of this document with our AI Paraphraser
References
Bohanon, C., (2012). Economic Recovery: Lessons from the Post-World War II Period.
Retrieved from: https://www.mercatus.org/publications/economic-history/economic-
recovery-lessons-post-world-war-ii-period
Carvalho, L., & Rezai, A. (2016). Personal income inequality and aggregate
demand. Cambridge Journal of Economics, 40(2), 491-505.
Caskey, J. (2019). Debt commitments and aggregate demand: a critique of the neoclassical
synthesis and policy. Financial Dynamics and Business Cycles: New Perspectives,
188
Deleidi, M., & Mazzucato, M. (2019). Putting austerity to bed: Technical progress, aggregate
demand and the supermultiplier. Review of Political Economy, 1-21...
Economicshelp.org (2020). Shape of aggregate supply curves (AS). Retrieved from:
https://www.economicshelp.org/blog/glossary/shape-of-aggregate-supply-curves-as/
Garriga, C., Manuelli, R., & Peralta-Alva, A. (2019). A macroeconomic model of price
swings in the housing market. American Economic Review, 109(6), 2036-72.
Kumphong, J., Satiennam, T., & Satiennam, W. (2016). A correlation of traffic accident
fatalities, speed enforcement and the gross national income of Thailand and its cross-
border countries. International Journal of Technology, 7(7), 1141-1146.
Leduc, S., & Liu, Z. (2016). Uncertainty shocks are aggregate demand shocks. Journal of
Monetary Economics, 82, 20-35
Obst, T., Onaran, Ö., & Nikolaidi, M. (2019). The effects of income distribution and fiscal
policy on aggregate demand, investment, and the budget balance: the case of
Europe. Cambridge Journal of Economics.
Pettinger, T., (2017). Why is the aggregate demand (AD) curve downward sloping? Retrieved
from: https://www.economicshelp.org/blog/11437/economics/why-is-the-aggregate-
demand-ad-curve-downward-sloping/
Russo, A., Riccetti, L., & Gallegati, M. (2016). Increasing inequality, consumer credit and
financial fragility in an agent based macroeconomic model. Journal of Evolutionary
Economics, 26(1), 25-47.
Suman, S., (2019). Sectoral Change in India’s National Income. Retrieved from:
http://www.economicsdiscussion.net/national-income/sectoral-change/sectoral-
change-in-indias-national-income/12850
Tutor2u, (2018). Understanding the Circular Flow of Income and Spending. Retrieved from:
https://www.tutor2u.net/economics/reference/circular-flow-of-income-and-spending
World Bank, PwC analysis, (2018). Future of India the Winning Leap. Retrieved from:
https://www.pwc.in/assets/pdfs/future-of-india/future-of-india-the-winning-leap.pdf
World Economic Forum, (2018). This is the story of India's GDP growth. Retrieved from:
https://www.weforum.org/agenda/2018/04/india-s-remarkably-robust-and-resilient-
growth-story
⊘ This is a preview!⊘
Do you want full access?
Subscribe today to unlock all pages.
Trusted by 1+ million students worldwide
1 out of 12
Related Documents


Your All-in-One AI-Powered Toolkit for Academic Success.
+13062052269
info@desklib.com
Available 24*7 on WhatsApp / Email
![[object Object]](/_next/static/media/star-bottom.7253800d.svg)
Unlock your academic potential
Copyright © 2020–2026 A2Z Services. All Rights Reserved. Developed and managed by ZUCOL.