Finance and Decision-Making Report: GEC and SIG Plc Analysis, 2016
VerifiedAdded on 2020/02/05
|9
|2583
|72
Report
AI Summary
This report presents a financial analysis of General Electronic Company (GEC) and SIG Plc, focusing on profitability and liquidity. The first part of the report examines GEC's financial performance through ratio analysis, revealing trends in gross profit, net profit, current ratio, and quick ratio over several years. The analysis highlights the importance of financial ratios for decision-making and acknowledges their limitations. The second part evaluates an investment opportunity for SIG Plc, employing Net Present Value (NPV) and Internal Rate of Return (IRR) to assess the project's viability. The report suggests investment based on positive NPV and a higher IRR than the cost of capital. It also discusses financing options and critically analyzes the challenges in mergers and acquisitions (M&A), particularly cultural differences, employee retention, and the impact of technological advancements on the M&A process. The report concludes that the proposed project for SIG Plc is a viable investment opportunity.

FINANCE AND DECISION-MAKING
1
1
Paraphrase This Document
Need a fresh take? Get an instant paraphrase of this document with our AI Paraphraser
Table of Contents
INTRODUCTION................................................................................................................................3
ASSESSMENT 1..................................................................................................................................3
1. Profitability and liquidity ratios...................................................................................................3
2. Analysis and interpretation..........................................................................................................3
3. Critically evaluate the use and limitations of financial ratios......................................................4
ASSESSMENT 2..................................................................................................................................4
Project evaluation............................................................................................................................5
Appraising the financing section.....................................................................................................6
Critically analysing the challenges in M&A....................................................................................6
CONCLUSION....................................................................................................................................7
REFERENCES.....................................................................................................................................8
APPENDIX..........................................................................................................................................9
Appendix 1 Calculation of profitability and liquidity ratios............................................................9
Appendix 2 Calculation of net present value...................................................................................9
2
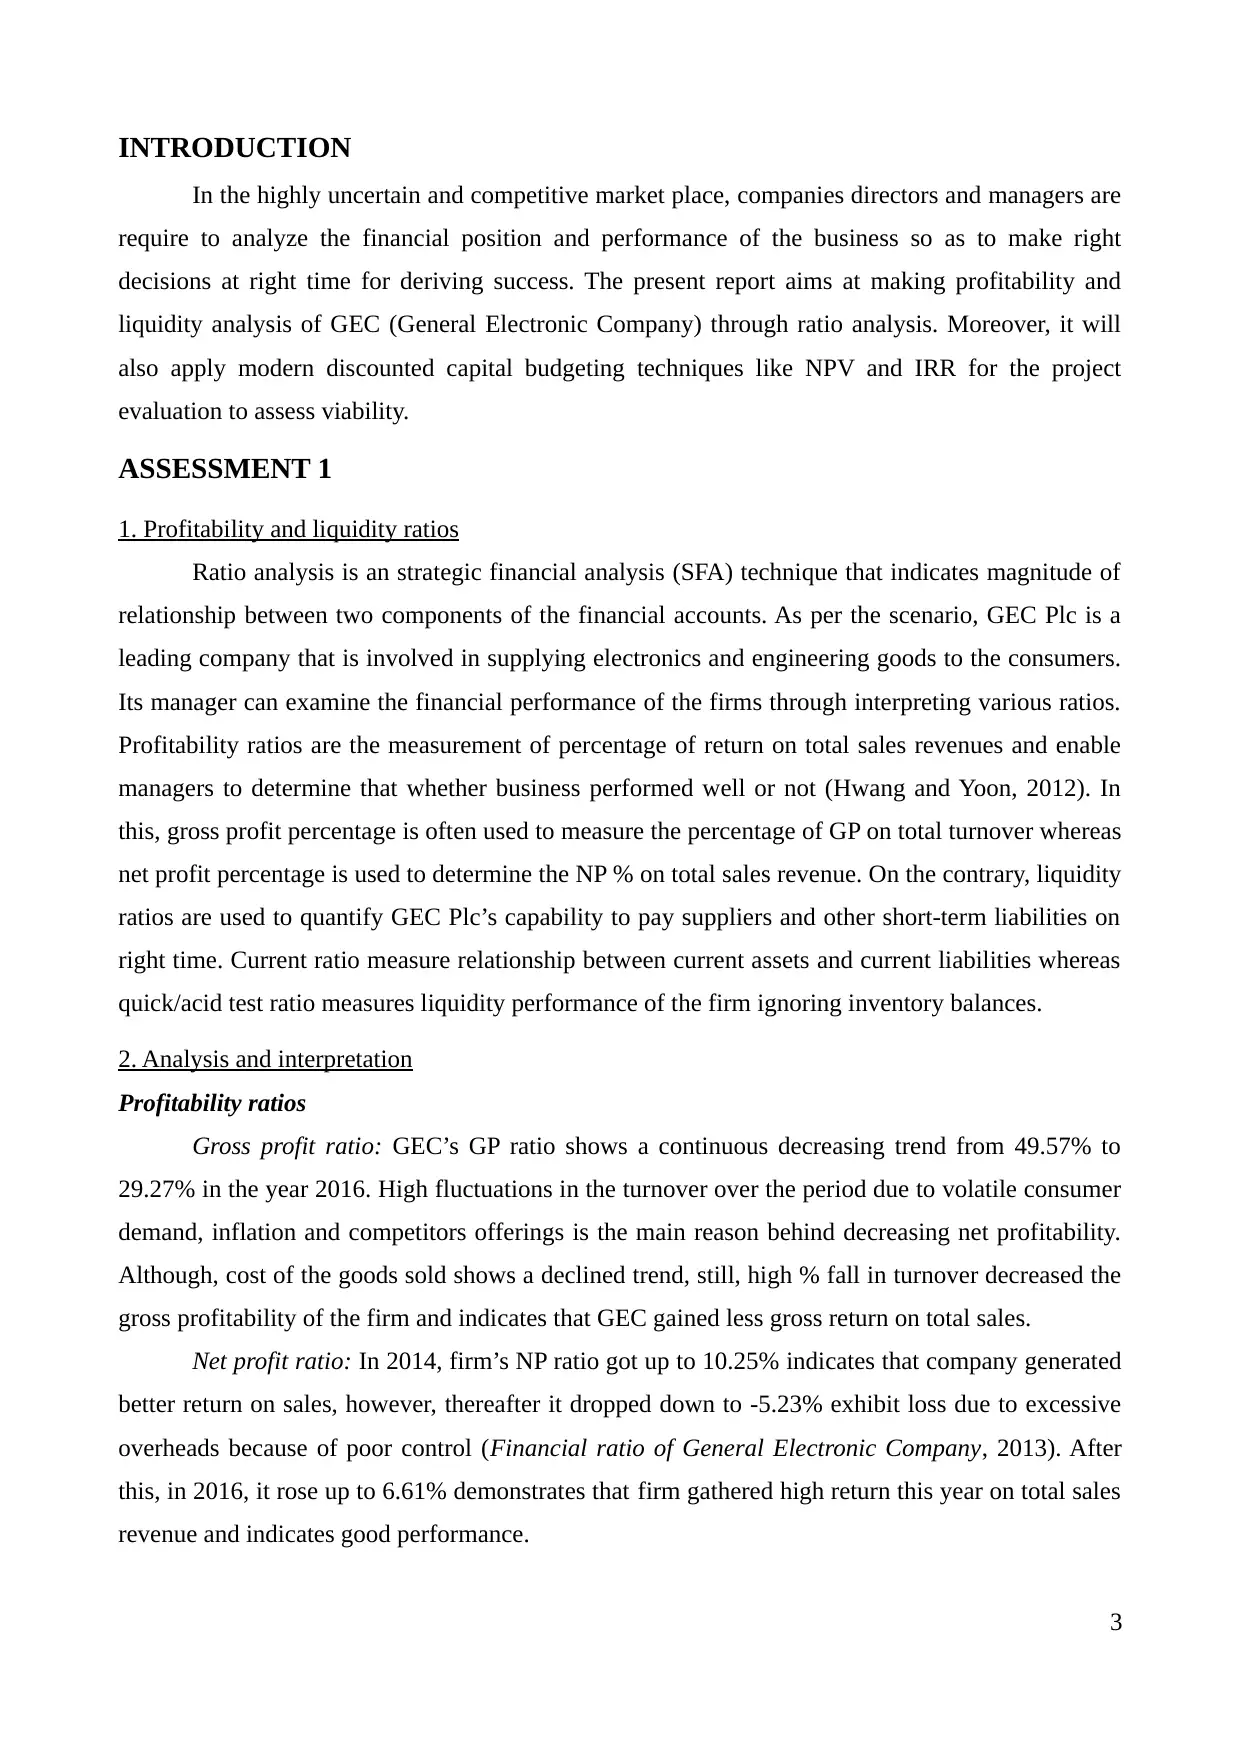
INTRODUCTION
In the highly uncertain and competitive market place, companies directors and managers are
require to analyze the financial position and performance of the business so as to make right
decisions at right time for deriving success. The present report aims at making profitability and
liquidity analysis of GEC (General Electronic Company) through ratio analysis. Moreover, it will
also apply modern discounted capital budgeting techniques like NPV and IRR for the project
evaluation to assess viability.
ASSESSMENT 1
1. Profitability and liquidity ratios
Ratio analysis is an strategic financial analysis (SFA) technique that indicates magnitude of
relationship between two components of the financial accounts. As per the scenario, GEC Plc is a
leading company that is involved in supplying electronics and engineering goods to the consumers.
Its manager can examine the financial performance of the firms through interpreting various ratios.
Profitability ratios are the measurement of percentage of return on total sales revenues and enable
managers to determine that whether business performed well or not (Hwang and Yoon, 2012). In
this, gross profit percentage is often used to measure the percentage of GP on total turnover whereas
net profit percentage is used to determine the NP % on total sales revenue. On the contrary, liquidity
ratios are used to quantify GEC Plc’s capability to pay suppliers and other short-term liabilities on
right time. Current ratio measure relationship between current assets and current liabilities whereas
quick/acid test ratio measures liquidity performance of the firm ignoring inventory balances.
2. Analysis and interpretation
Profitability ratios
Gross profit ratio: GEC’s GP ratio shows a continuous decreasing trend from 49.57% to
29.27% in the year 2016. High fluctuations in the turnover over the period due to volatile consumer
demand, inflation and competitors offerings is the main reason behind decreasing net profitability.
Although, cost of the goods sold shows a declined trend, still, high % fall in turnover decreased the
gross profitability of the firm and indicates that GEC gained less gross return on total sales.
Net profit ratio: In 2014, firm’s NP ratio got up to 10.25% indicates that company generated
better return on sales, however, thereafter it dropped down to -5.23% exhibit loss due to excessive
overheads because of poor control (Financial ratio of General Electronic Company, 2013). After
this, in 2016, it rose up to 6.61% demonstrates that firm gathered high return this year on total sales
revenue and indicates good performance.
3
⊘ This is a preview!⊘
Do you want full access?
Subscribe today to unlock all pages.
Trusted by 1+ million students worldwide
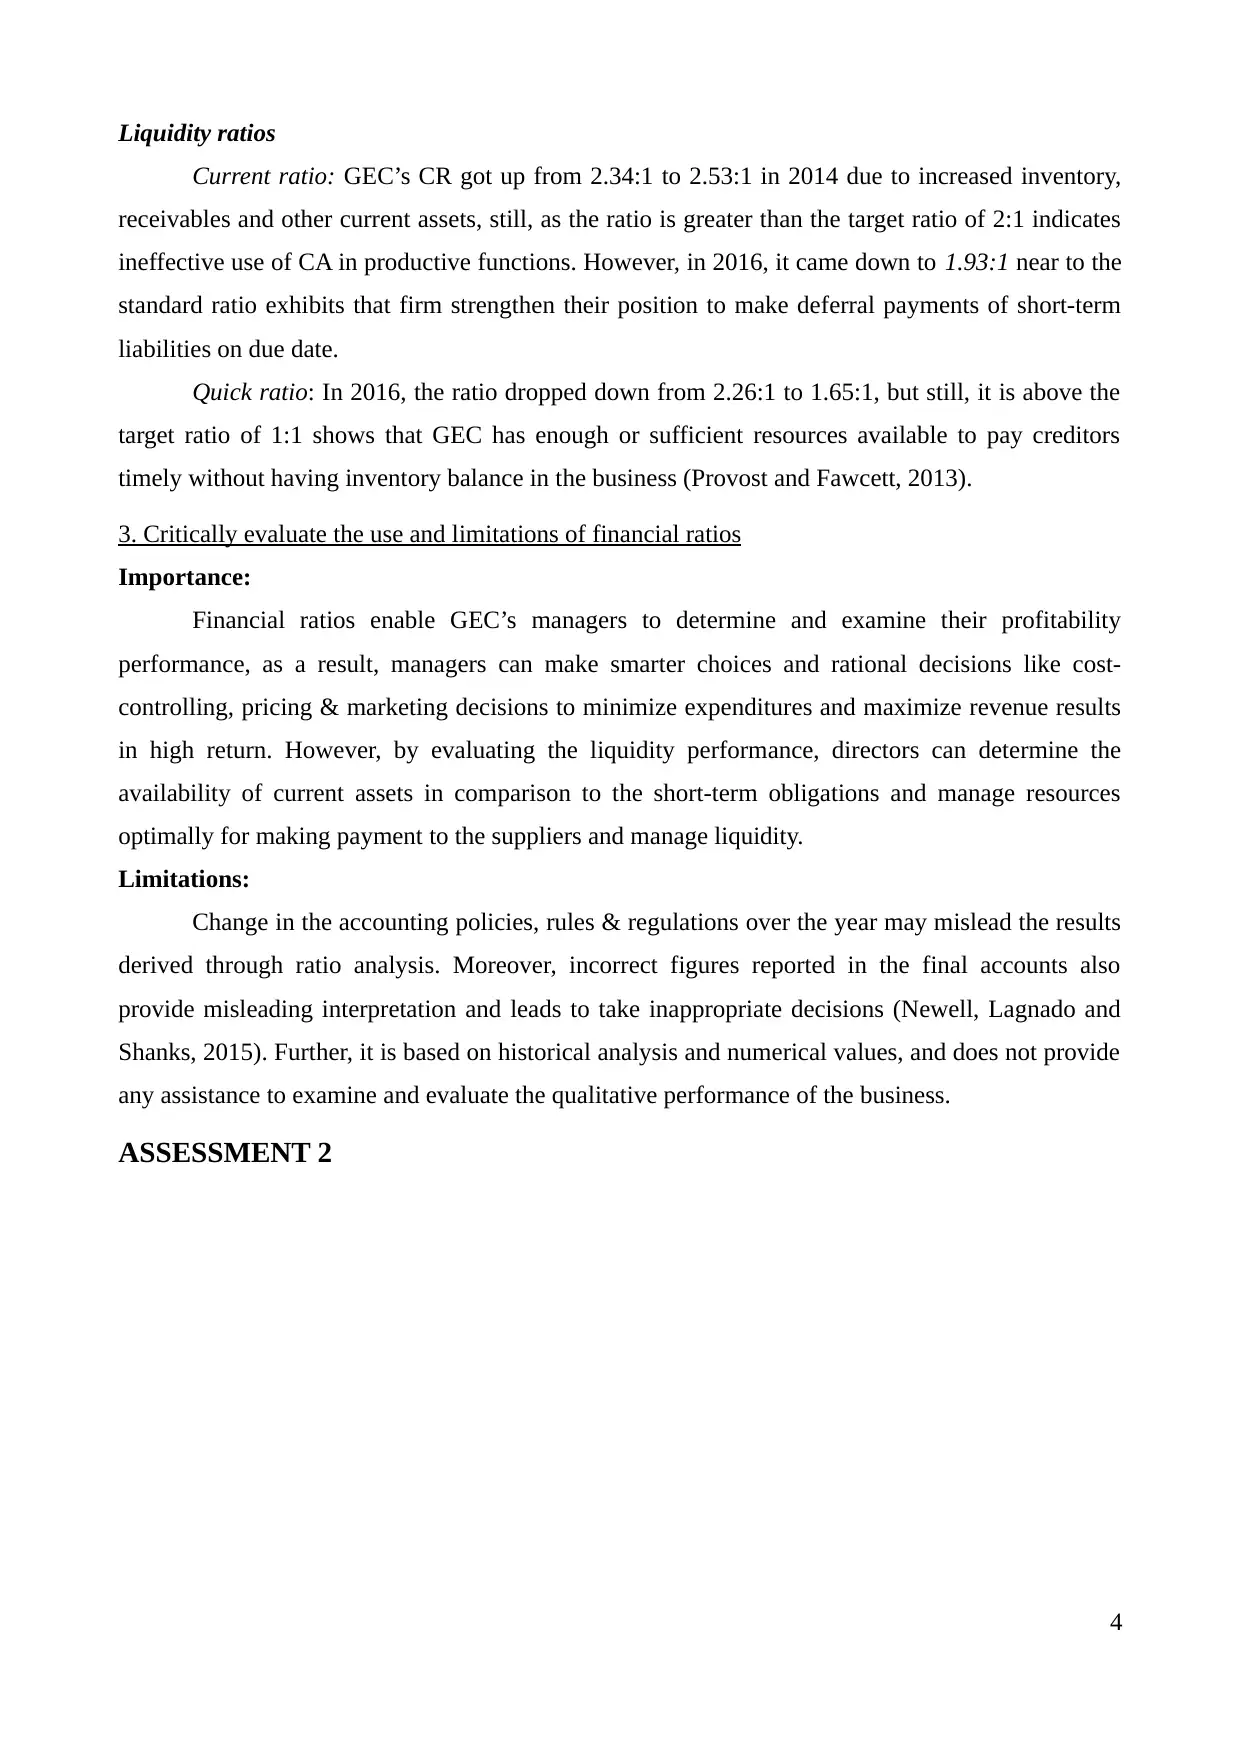
Liquidity ratios
Current ratio: GEC’s CR got up from 2.34:1 to 2.53:1 in 2014 due to increased inventory,
receivables and other current assets, still, as the ratio is greater than the target ratio of 2:1 indicates
ineffective use of CA in productive functions. However, in 2016, it came down to 1.93:1 near to the
standard ratio exhibits that firm strengthen their position to make deferral payments of short-term
liabilities on due date.
Quick ratio: In 2016, the ratio dropped down from 2.26:1 to 1.65:1, but still, it is above the
target ratio of 1:1 shows that GEC has enough or sufficient resources available to pay creditors
timely without having inventory balance in the business (Provost and Fawcett, 2013).
3. Critically evaluate the use and limitations of financial ratios
Importance:
Financial ratios enable GEC’s managers to determine and examine their profitability
performance, as a result, managers can make smarter choices and rational decisions like cost-
controlling, pricing & marketing decisions to minimize expenditures and maximize revenue results
in high return. However, by evaluating the liquidity performance, directors can determine the
availability of current assets in comparison to the short-term obligations and manage resources
optimally for making payment to the suppliers and manage liquidity.
Limitations:
Change in the accounting policies, rules & regulations over the year may mislead the results
derived through ratio analysis. Moreover, incorrect figures reported in the final accounts also
provide misleading interpretation and leads to take inappropriate decisions (Newell, Lagnado and
Shanks, 2015). Further, it is based on historical analysis and numerical values, and does not provide
any assistance to examine and evaluate the qualitative performance of the business.
ASSESSMENT 2
4
Paraphrase This Document
Need a fresh take? Get an instant paraphrase of this document with our AI Paraphraser
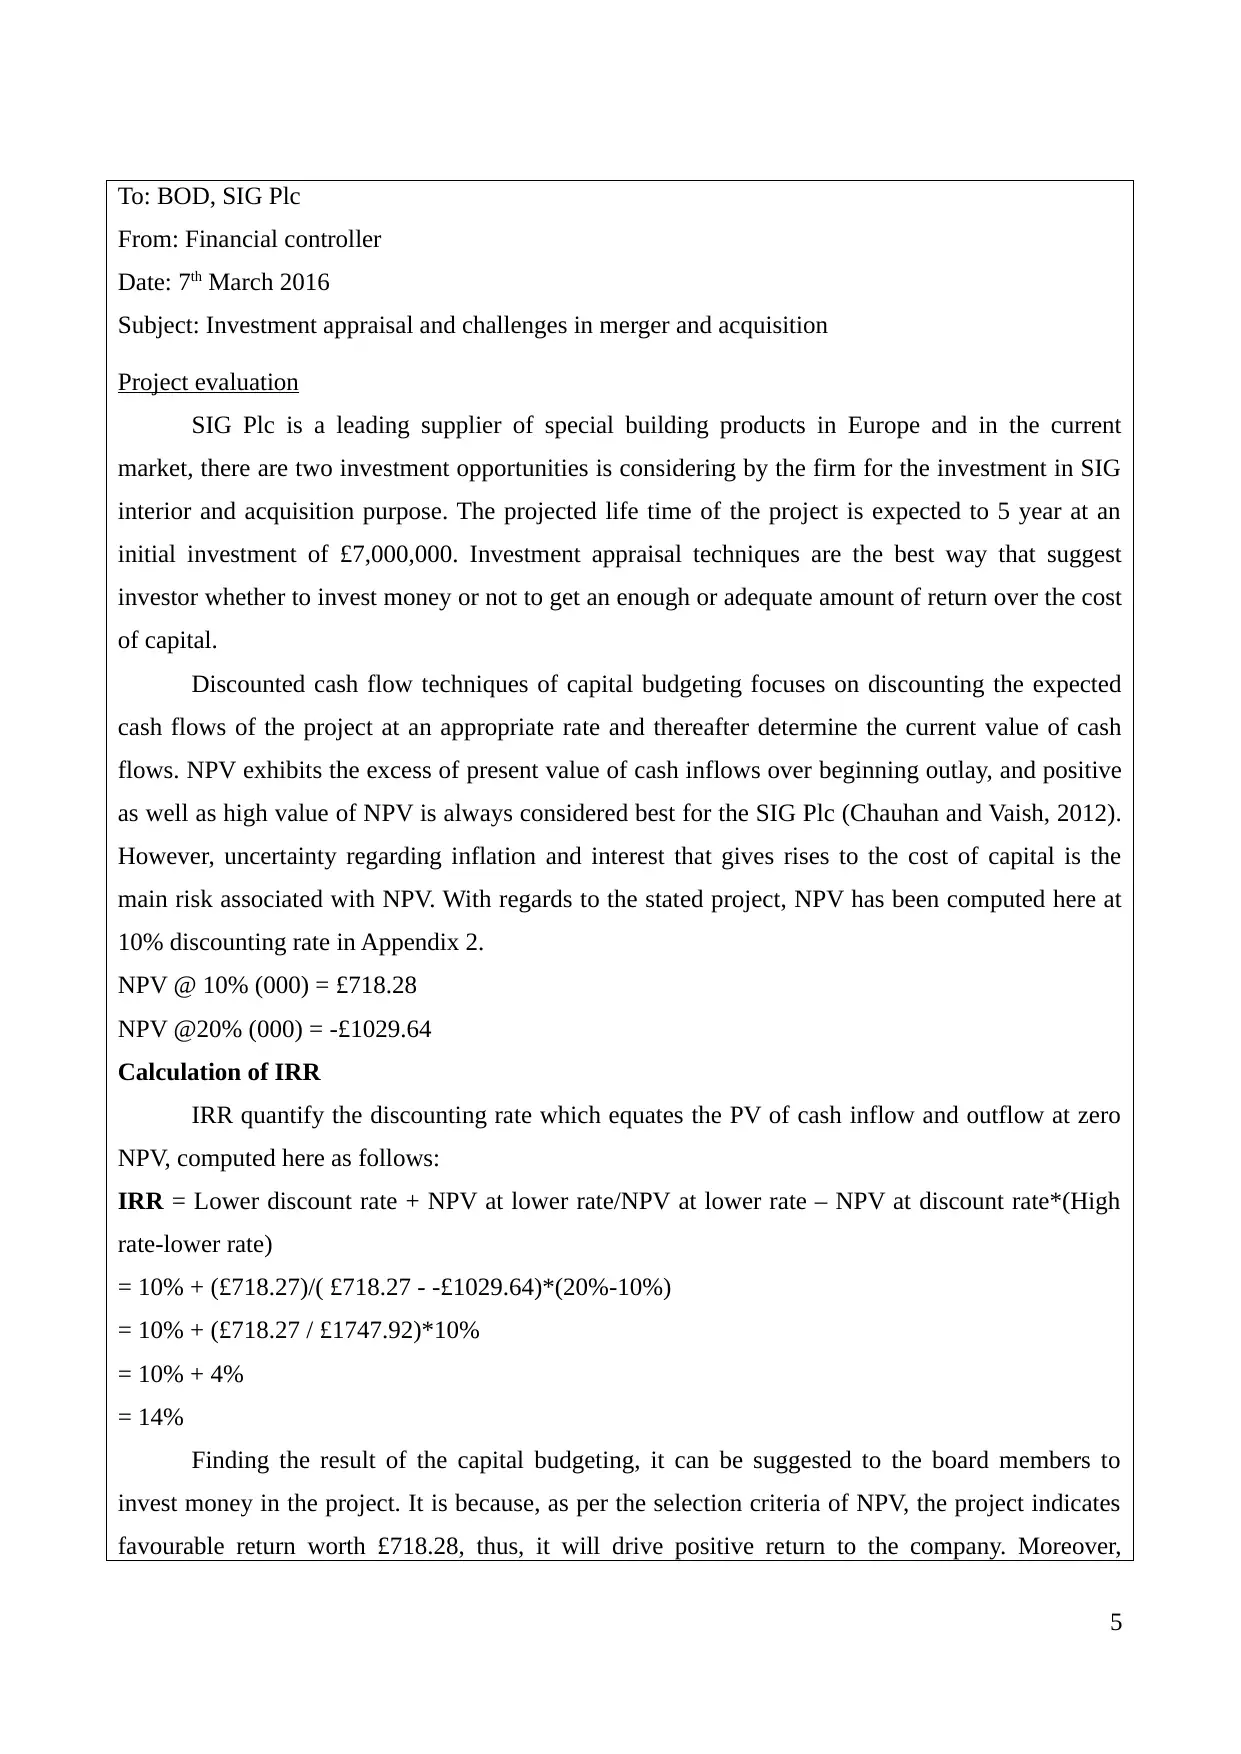
To: BOD, SIG Plc
From: Financial controller
Date: 7th March 2016
Subject: Investment appraisal and challenges in merger and acquisition
Project evaluation
SIG Plc is a leading supplier of special building products in Europe and in the current
market, there are two investment opportunities is considering by the firm for the investment in SIG
interior and acquisition purpose. The projected life time of the project is expected to 5 year at an
initial investment of £7,000,000. Investment appraisal techniques are the best way that suggest
investor whether to invest money or not to get an enough or adequate amount of return over the cost
of capital.
Discounted cash flow techniques of capital budgeting focuses on discounting the expected
cash flows of the project at an appropriate rate and thereafter determine the current value of cash
flows. NPV exhibits the excess of present value of cash inflows over beginning outlay, and positive
as well as high value of NPV is always considered best for the SIG Plc (Chauhan and Vaish, 2012).
However, uncertainty regarding inflation and interest that gives rises to the cost of capital is the
main risk associated with NPV. With regards to the stated project, NPV has been computed here at
10% discounting rate in Appendix 2.
NPV @ 10% (000) = £718.28
NPV @20% (000) = -£1029.64
Calculation of IRR
IRR quantify the discounting rate which equates the PV of cash inflow and outflow at zero
NPV, computed here as follows:
IRR = Lower discount rate + NPV at lower rate/NPV at lower rate – NPV at discount rate*(High
rate-lower rate)
= 10% + (£718.27)/( £718.27 - -£1029.64)*(20%-10%)
= 10% + (£718.27 / £1747.92)*10%
= 10% + 4%
= 14%
Finding the result of the capital budgeting, it can be suggested to the board members to
invest money in the project. It is because, as per the selection criteria of NPV, the project indicates
favourable return worth £718.28, thus, it will drive positive return to the company. Moreover,
5
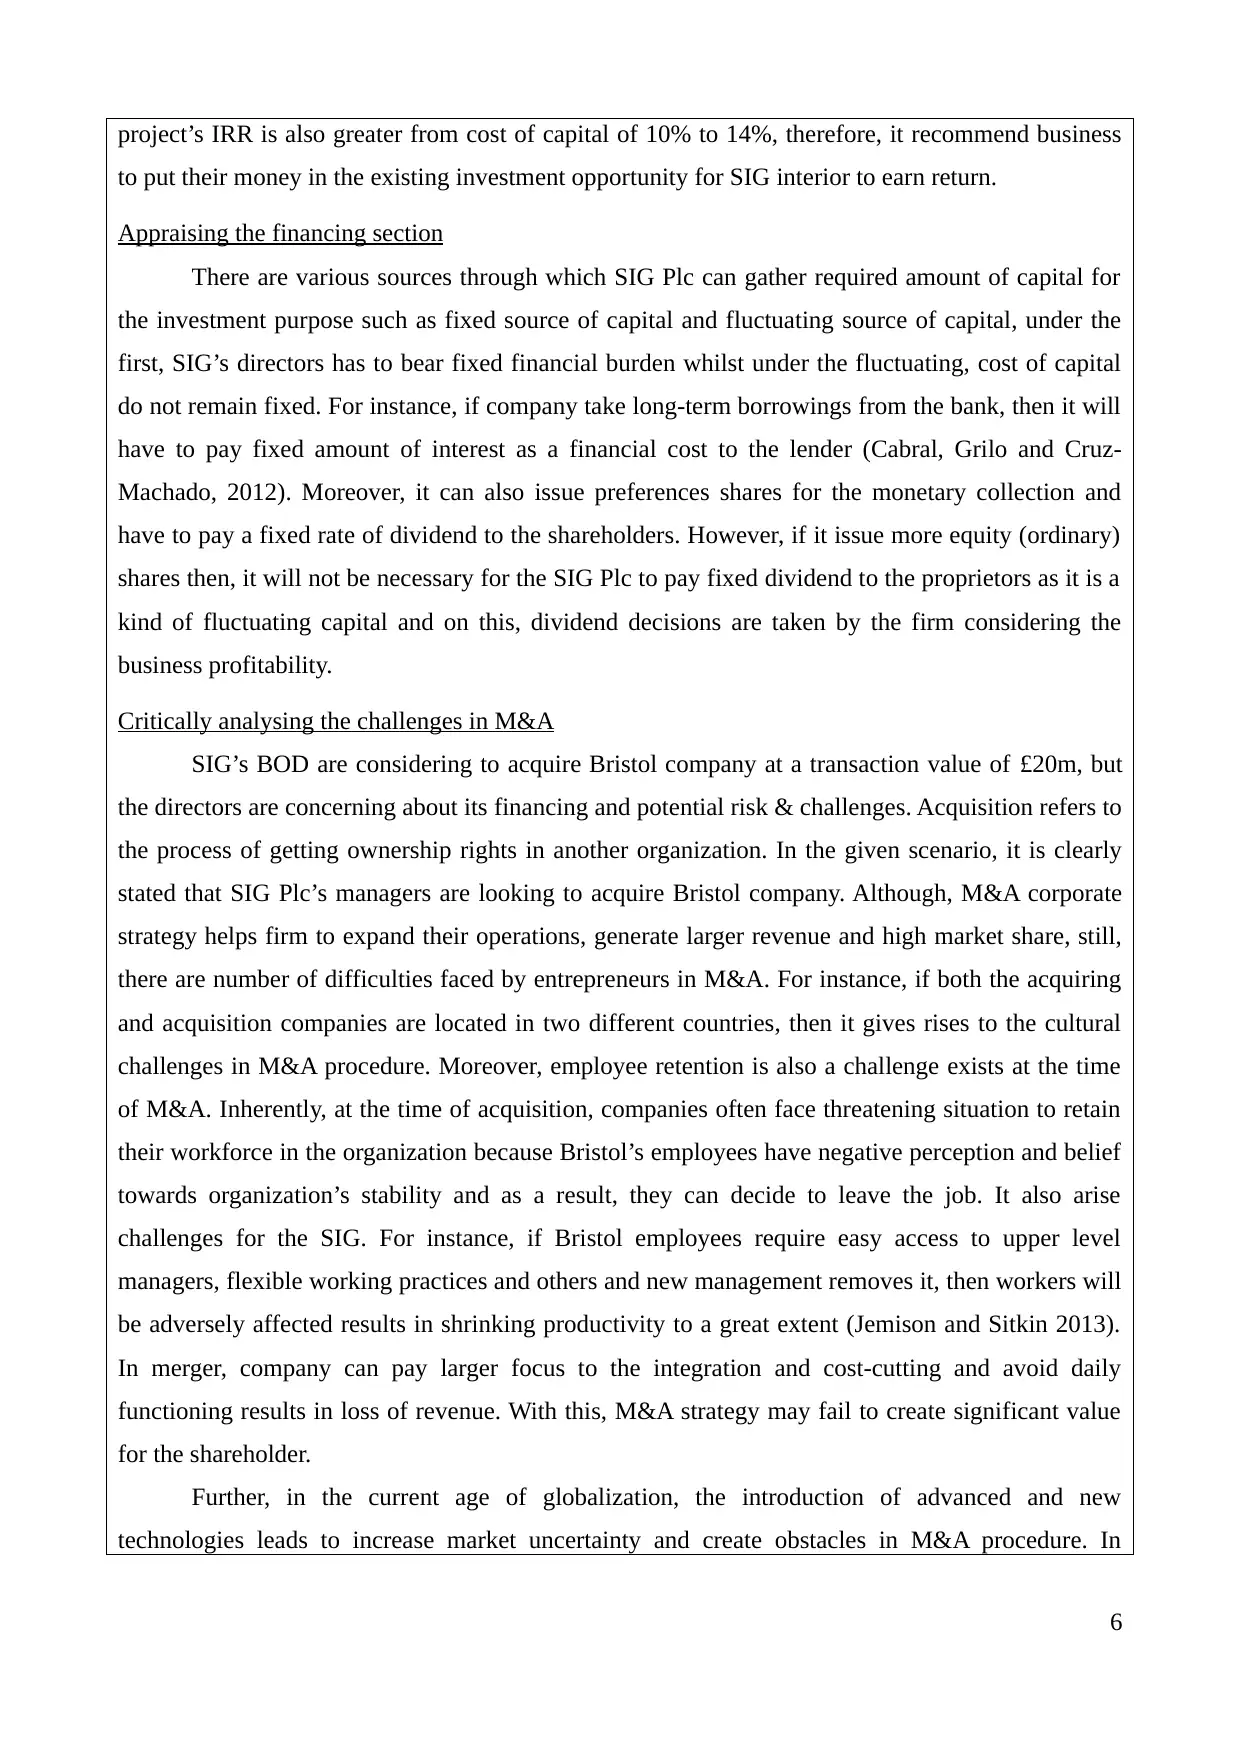
project’s IRR is also greater from cost of capital of 10% to 14%, therefore, it recommend business
to put their money in the existing investment opportunity for SIG interior to earn return.
Appraising the financing section
There are various sources through which SIG Plc can gather required amount of capital for
the investment purpose such as fixed source of capital and fluctuating source of capital, under the
first, SIG’s directors has to bear fixed financial burden whilst under the fluctuating, cost of capital
do not remain fixed. For instance, if company take long-term borrowings from the bank, then it will
have to pay fixed amount of interest as a financial cost to the lender (Cabral, Grilo and Cruz-
Machado, 2012). Moreover, it can also issue preferences shares for the monetary collection and
have to pay a fixed rate of dividend to the shareholders. However, if it issue more equity (ordinary)
shares then, it will not be necessary for the SIG Plc to pay fixed dividend to the proprietors as it is a
kind of fluctuating capital and on this, dividend decisions are taken by the firm considering the
business profitability.
Critically analysing the challenges in M&A
SIG’s BOD are considering to acquire Bristol company at a transaction value of £20m, but
the directors are concerning about its financing and potential risk & challenges. Acquisition refers to
the process of getting ownership rights in another organization. In the given scenario, it is clearly
stated that SIG Plc’s managers are looking to acquire Bristol company. Although, M&A corporate
strategy helps firm to expand their operations, generate larger revenue and high market share, still,
there are number of difficulties faced by entrepreneurs in M&A. For instance, if both the acquiring
and acquisition companies are located in two different countries, then it gives rises to the cultural
challenges in M&A procedure. Moreover, employee retention is also a challenge exists at the time
of M&A. Inherently, at the time of acquisition, companies often face threatening situation to retain
their workforce in the organization because Bristol’s employees have negative perception and belief
towards organization’s stability and as a result, they can decide to leave the job. It also arise
challenges for the SIG. For instance, if Bristol employees require easy access to upper level
managers, flexible working practices and others and new management removes it, then workers will
be adversely affected results in shrinking productivity to a great extent (Jemison and Sitkin 2013).
In merger, company can pay larger focus to the integration and cost-cutting and avoid daily
functioning results in loss of revenue. With this, M&A strategy may fail to create significant value
for the shareholder.
Further, in the current age of globalization, the introduction of advanced and new
technologies leads to increase market uncertainty and create obstacles in M&A procedure. In
6
⊘ This is a preview!⊘
Do you want full access?
Subscribe today to unlock all pages.
Trusted by 1+ million students worldwide
addition to this, in order to cope up with the M&A, SIG’s directors and managers requires too much
time, as a result, there is a risk that they can neglect their core business functioning. Although, there
are number of challenges, still, it provides benefits of size and global reach to the SIG through the
acquisition of Bristol. It helps to strengthen the competitive position through squeezing greater
efficiency; as a result, it can defeat rival firms.
CONCLUSION
Above project report concluded that GEC’s profitability performance and liquidity position
is strong indicates that it is generating good return on their total sales and capable to pay suppliers
on right time. Lastly, report founded that at 10% discounting rate, SIG Plc’s proposed project will
bring positive return and its IRR is also higher to 14% hence, it is a viable investment opportunity.
7
Paraphrase This Document
Need a fresh take? Get an instant paraphrase of this document with our AI Paraphraser
REFERENCES
Books and Journals
Cabral, I., Grilo, A. and Cruz-Machado, V., 2012. A decision-making model for lean, agile, resilient
and green supply chain management. International Journal of Production Research. 50(17).
pp. 4830-4845.
Chauhan, A. and Vaish, R., 2012. Magnetic material selection using multiple attribute decision
making approach. Materials & Design. 36. pp. 1-5.
Hwang, C. L. and Yoon, K., 2012. Multiple attribute decision making: methods and applications a
state-of-the-art survey. Springer Science & Business Media.
Newell, B. R., Lagnado, D. A. and Shanks, D. R., 2015. Straight choices: The psychology of
decision making. Psychology Press.
Provost, F. and Fawcett, T., 2013. Data science and its relationship to big data and data-driven
decision making. Big Data. 1(1). pp. 51-59.
Online
Financial ratio of General Electronic Company. 2013. [Online]. Available through: <
http://financials.morningstar.com/balance-sheet/bs.html?t=GE®ion=usa&culture=en-
US>. [Accessed on 7th March 2016].
Jemison, D. and Sitkin, B. S., 2013. Acquisition: The Process Can be a problem. [Online]. Available
through: https://hbr.org/1986/03/acquisitions-the-process-can-be-a-problem. [Accessed on
7th March 2016].
8
APPENDIX
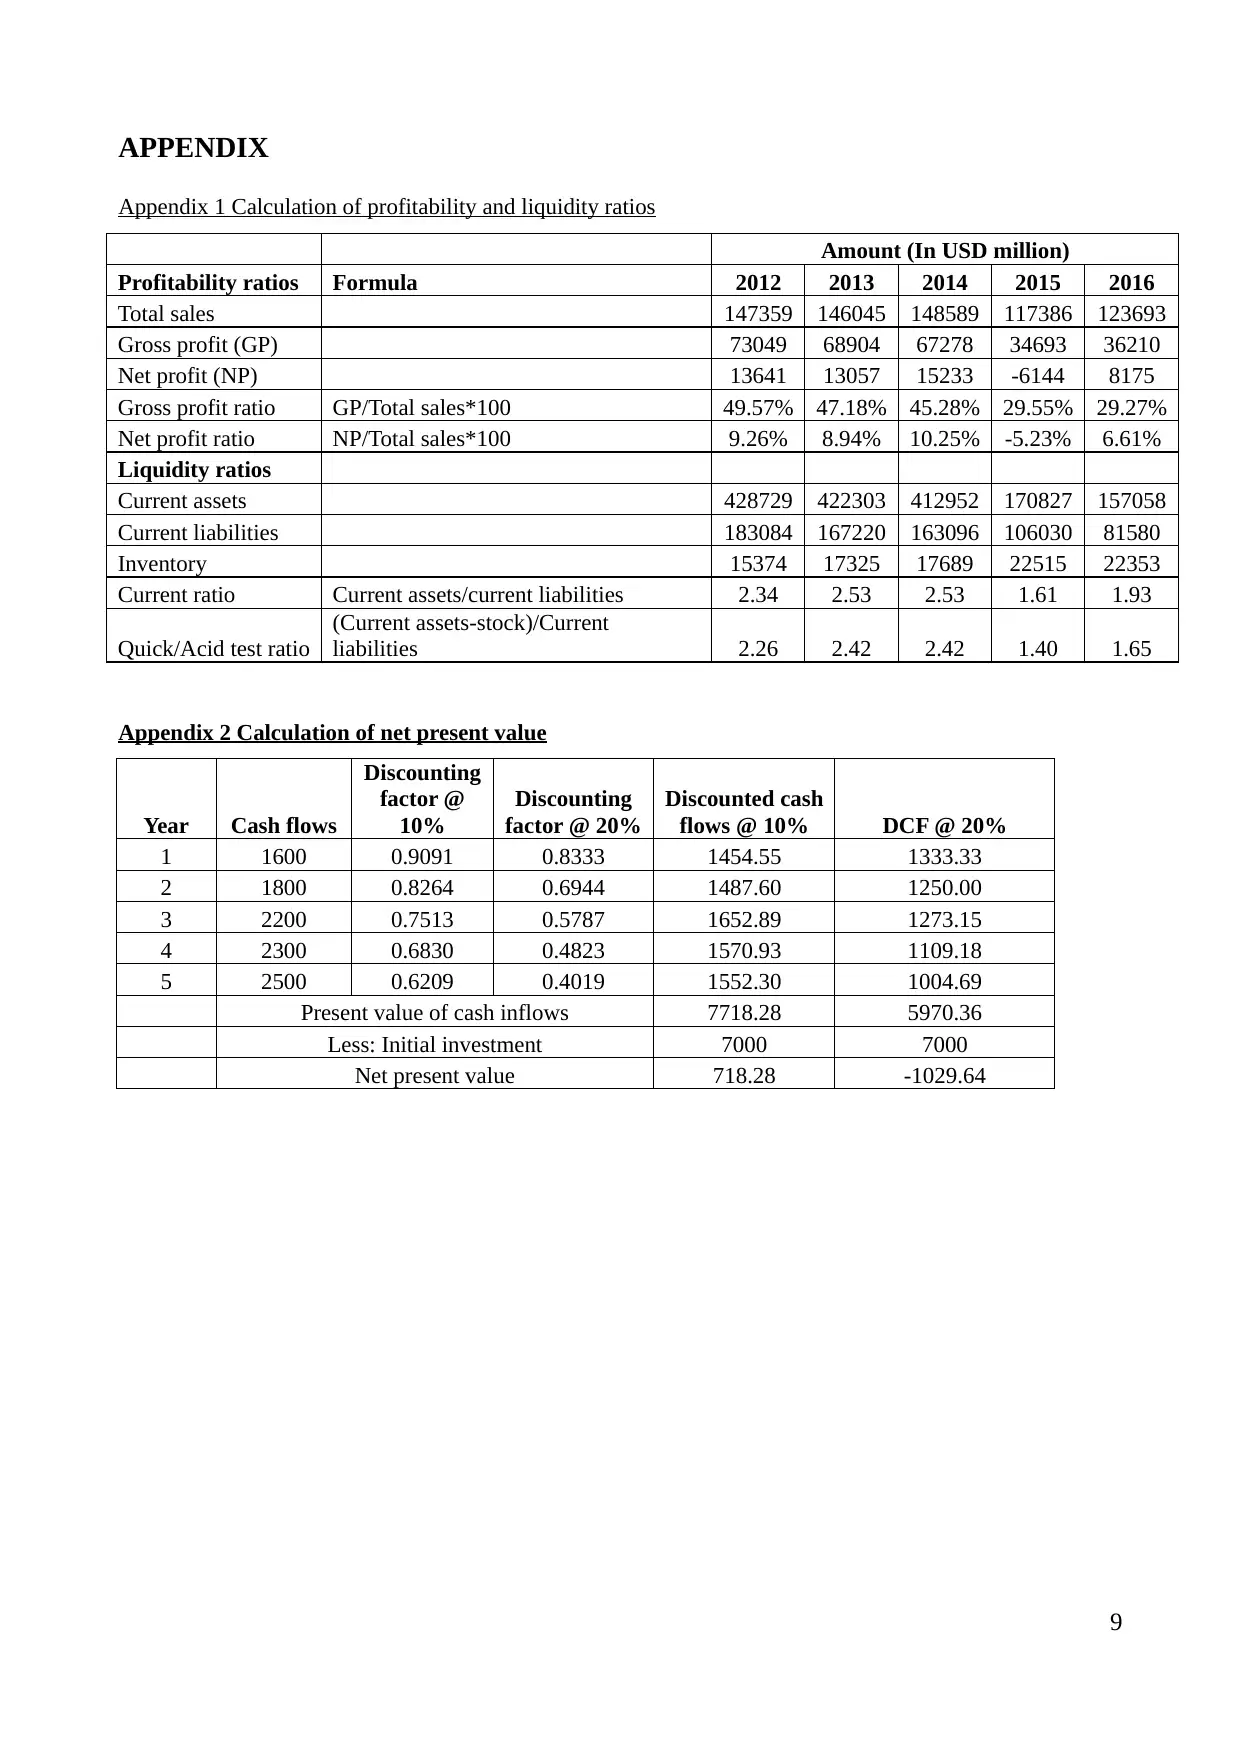
Appendix 1 Calculation of profitability and liquidity ratios
Amount (In USD million)
Profitability ratios Formula 2012 2013 2014 2015 2016
Total sales 147359 146045 148589 117386 123693
Gross profit (GP) 73049 68904 67278 34693 36210
Net profit (NP) 13641 13057 15233 -6144 8175
Gross profit ratio GP/Total sales*100 49.57% 47.18% 45.28% 29.55% 29.27%
Net profit ratio NP/Total sales*100 9.26% 8.94% 10.25% -5.23% 6.61%
Liquidity ratios
Current assets 428729 422303 412952 170827 157058
Current liabilities 183084 167220 163096 106030 81580
Inventory 15374 17325 17689 22515 22353
Current ratio Current assets/current liabilities 2.34 2.53 2.53 1.61 1.93
Quick/Acid test ratio
(Current assets-stock)/Current
liabilities 2.26 2.42 2.42 1.40 1.65
Appendix 2 Calculation of net present value
Year Cash flows
Discounting
factor @
10%
Discounting
factor @ 20%
Discounted cash
flows @ 10% DCF @ 20%
1 1600 0.9091 0.8333 1454.55 1333.33
2 1800 0.8264 0.6944 1487.60 1250.00
3 2200 0.7513 0.5787 1652.89 1273.15
4 2300 0.6830 0.4823 1570.93 1109.18
5 2500 0.6209 0.4019 1552.30 1004.69
Present value of cash inflows 7718.28 5970.36
Less: Initial investment 7000 7000
Net present value 718.28 -1029.64
9
⊘ This is a preview!⊘
Do you want full access?
Subscribe today to unlock all pages.
Trusted by 1+ million students worldwide
1 out of 9
Related Documents


Your All-in-One AI-Powered Toolkit for Academic Success.
+13062052269
info@desklib.com
Available 24*7 on WhatsApp / Email
![[object Object]](/_next/static/media/star-bottom.7253800d.svg)
Unlock your academic potential
Copyright © 2020–2026 A2Z Services. All Rights Reserved. Developed and managed by ZUCOL.