PSY3041 - Global Emotional Intelligence Test (GEIT) Evaluation
VerifiedAdded on 2023/06/12
|36
|10493
|186
Report
AI Summary
This report presents a psychometric evaluation of the Global Emotional Intelligence Test (GEIT), examining its reliability and validity through various statistical analyses. The study involved 287 participants who completed the GEIT, along with the Trait Emotional Intelligence Questionnaire (TEIQue) and the Big Five Inventory (BFI). The research explores the factor structure of the GEIT, its internal consistency, and its correlations with other measures of emotional intelligence and personality traits. Key findings include a Cronbach's alpha of 0.72 for the GEIT, indicating acceptable reliability, and the identification of four factors through principal component analysis. The report discusses the implications of these findings for the use of the GEIT in assessing emotional intelligence and highlights the importance of considering the relationships between trait EI, personality, and other relevant constructs. The results are compared with previous research, and suggestions for future studies are offered. Desklib provides access to this report and other solved assignments for students.
Psychometric evaluation of the
Global Emotional Intelligence Test
(GEIT)
Student Name: Student ID:
Subject Name: Subject ID:
Due Date:
Global Emotional Intelligence Test
(GEIT)
Student Name: Student ID:
Subject Name: Subject ID:
Due Date:
Paraphrase This Document
Need a fresh take? Get an instant paraphrase of this document with our AI Paraphraser
Abstract
A prologue to the hypothesis and psychometric properties of the Global trait emotional
intelligence (GTEI) score had been examined. Analysis for the need of conceptualizing the
expanding number of false intelligences as identity characteristics, as opposed to as
intellectual capacities was conducted. The research work has a reasonable and replicable
factor structure involving four unmistakable, yet interrelated, measurements. Self-Awareness
(SA), Self-Management (SM), Social Awareness (SocA) and Relationship Management
(RM) factors are four attractive psycho-metric attributes and had been used to obtain Global
Emotional Intelligence Test (GEIT) scores. This experiment centres prevalently around the
validity and reliability of GEIT scores. In spite of the fact that there are concrete
psychometric focal points of the TEIQue over the plenty of self-report EI surveys, the most
noteworthy is the hypothesis that backs it. The essentials of attribute EI hypothesis were
produced in Petrides (Petrides and Furnham, 2001) and the most recent rundown was given in
Petrides, Furnham, and Mavroveli (2007). Examinations researched the connection between
total GEIT scores, and between big five scores. The consequences of these investigations
demonstrated that higher passionate insight was related with naturally positive state of mind
and higher confidence.
Table of Contents
Psychometric evaluation of the.............................................................................................................1
Global Emotional Intelligence Test (GEIT)..............................................................................................1
Abstract.................................................................................................................................................2
Introduction...........................................................................................................................................4
Method..................................................................................................................................................5
Participants........................................................................................................................................6
Design................................................................................................................................................6
Procedure..........................................................................................................................................6
Data Analysis.....................................................................................................................................7
Results...................................................................................................................................................8
Discussion............................................................................................................................................10
Reference............................................................................................................................................12
Appendix.............................................................................................................................................13
⊘ This is a preview!⊘
Do you want full access?
Subscribe today to unlock all pages.
Trusted by 1+ million students worldwide
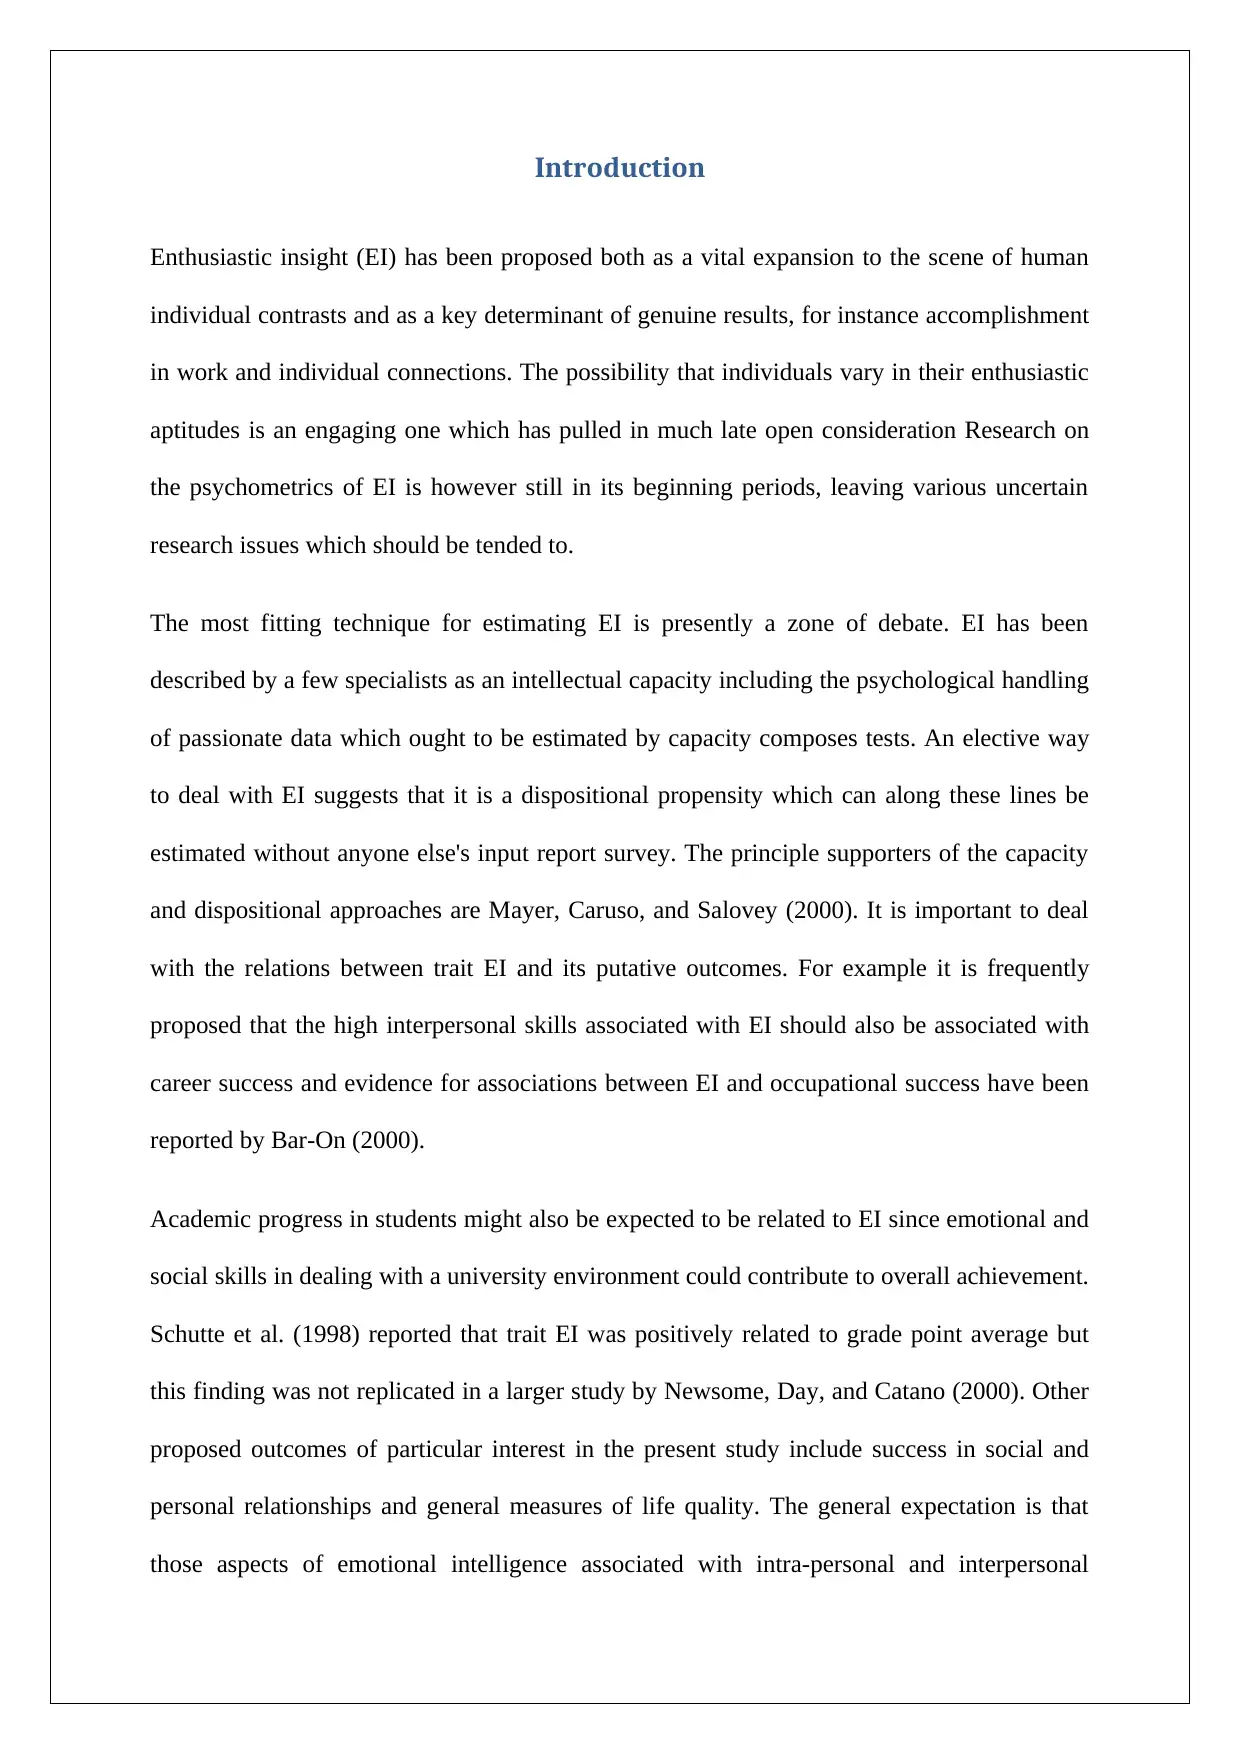
Introduction
Enthusiastic insight (EI) has been proposed both as a vital expansion to the scene of human
individual contrasts and as a key determinant of genuine results, for instance accomplishment
in work and individual connections. The possibility that individuals vary in their enthusiastic
aptitudes is an engaging one which has pulled in much late open consideration Research on
the psychometrics of EI is however still in its beginning periods, leaving various uncertain
research issues which should be tended to.
The most fitting technique for estimating EI is presently a zone of debate. EI has been
described by a few specialists as an intellectual capacity including the psychological handling
of passionate data which ought to be estimated by capacity composes tests. An elective way
to deal with EI suggests that it is a dispositional propensity which can along these lines be
estimated without anyone else's input report survey. The principle supporters of the capacity
and dispositional approaches are Mayer, Caruso, and Salovey (2000). It is important to deal
with the relations between trait EI and its putative outcomes. For example it is frequently
proposed that the high interpersonal skills associated with EI should also be associated with
career success and evidence for associations between EI and occupational success have been
reported by Bar-On (2000).
Academic progress in students might also be expected to be related to EI since emotional and
social skills in dealing with a university environment could contribute to overall achievement.
Schutte et al. (1998) reported that trait EI was positively related to grade point average but
this finding was not replicated in a larger study by Newsome, Day, and Catano (2000). Other
proposed outcomes of particular interest in the present study include success in social and
personal relationships and general measures of life quality. The general expectation is that
those aspects of emotional intelligence associated with intra-personal and interpersonal
Paraphrase This Document
Need a fresh take? Get an instant paraphrase of this document with our AI Paraphraser
emotional facility would be expected to lead to positive associations with happiness/life
satisfaction and quality and extent of social interactions and negative associations with
loneliness. Because mood regulation is a subcomponent of EI, it would be expected to be
negatively associated with measures of depression. There are some findings in this area but
further work is required. Trait EI has been found to be positively correlated with life
satisfaction (Martinez-Pons, 1997).
A progression of investigations of attribute EI have discovered direct and sometimes
extensive connections between's these measures and identity qualities. Attribute EI measures
for the most part indicate expansive critical correlations with Extraversion (E) and
Neuroticism (N) with positive and negative signs, individually, while littler huge positive
connections with Openness (O), Agreeableness (An) and Conscientiousness (C) have
likewise been discovered (Dawda and Hart, 2000; Petrides and Furnham, 2001; Schutte et al.,
1998). One approach to evaluate the issue of the uniqueness of attribute EI is to analyze its
incremental legitimacy in the expectation of life results, i.e. its capacity to anticipate out-
comes when the influences of identity are controlled for. There are as of now not very many
outcomes here yet attribute EI has been appeared to have incremental legitimacy in the
forecast of life (Palmer et al., 2014).
Methodology
Stage-I: Participants
To estimate the psychometric properties of an online emotional intelligence questionnaire
with forty questions, 326 participants were enrolled by Qualtrics, a professional examining
association who spends significant time in surveying research. They were enlisted from
existing on the web boards possessed by Qualtrics, from the individuals who have concurred
in the past to sociological surveying research. Participants were informed about the
experiment procedure and allowed to leave at any stage of the conducted workshop
conducted by the ethical committee of the university. 287 participants mostly in the age
bracket of 20 years were finally selected with 68 male and 214 females after the workshop
session. Ethical form designed by ethical committee was provided to the participants and was
returned by putting their signature. There was no control group for this study as no
hypothetical testing was done.
Stage-II: Design
Emotional Intelligence (EI) questionnaire, titled the Global Emotional Intelligence test –
GEIT (http://globalleadershipfoundation.com/geit/eitest.html) was used to assess the EI
scores. University laboratory was used for the purpose of conducting the test. The
investigator collected the answers from online survey and organised according to the GEIT40
components.
Stage-III: Procedure
Sample matching and sorting were done in few stages, starting with distinguishing some
objective populace with a characterized set of qualities. In the present examination, the
parameters such as age, sexual orientation were distinguished. Second, utilizing their online
answers a separation work was then ascertained based on the numerical score separation of
every individual. The questionnaire asked to respond to the questions related to emotional
intelligence, personality traits and self-esteem. The examinees were guided for the content of
⊘ This is a preview!⊘
Do you want full access?
Subscribe today to unlock all pages.
Trusted by 1+ million students worldwide
the questionnaire distressing them and the Monash University counsellors were available for
assistance.
Stage-IV: Participant’s demographic
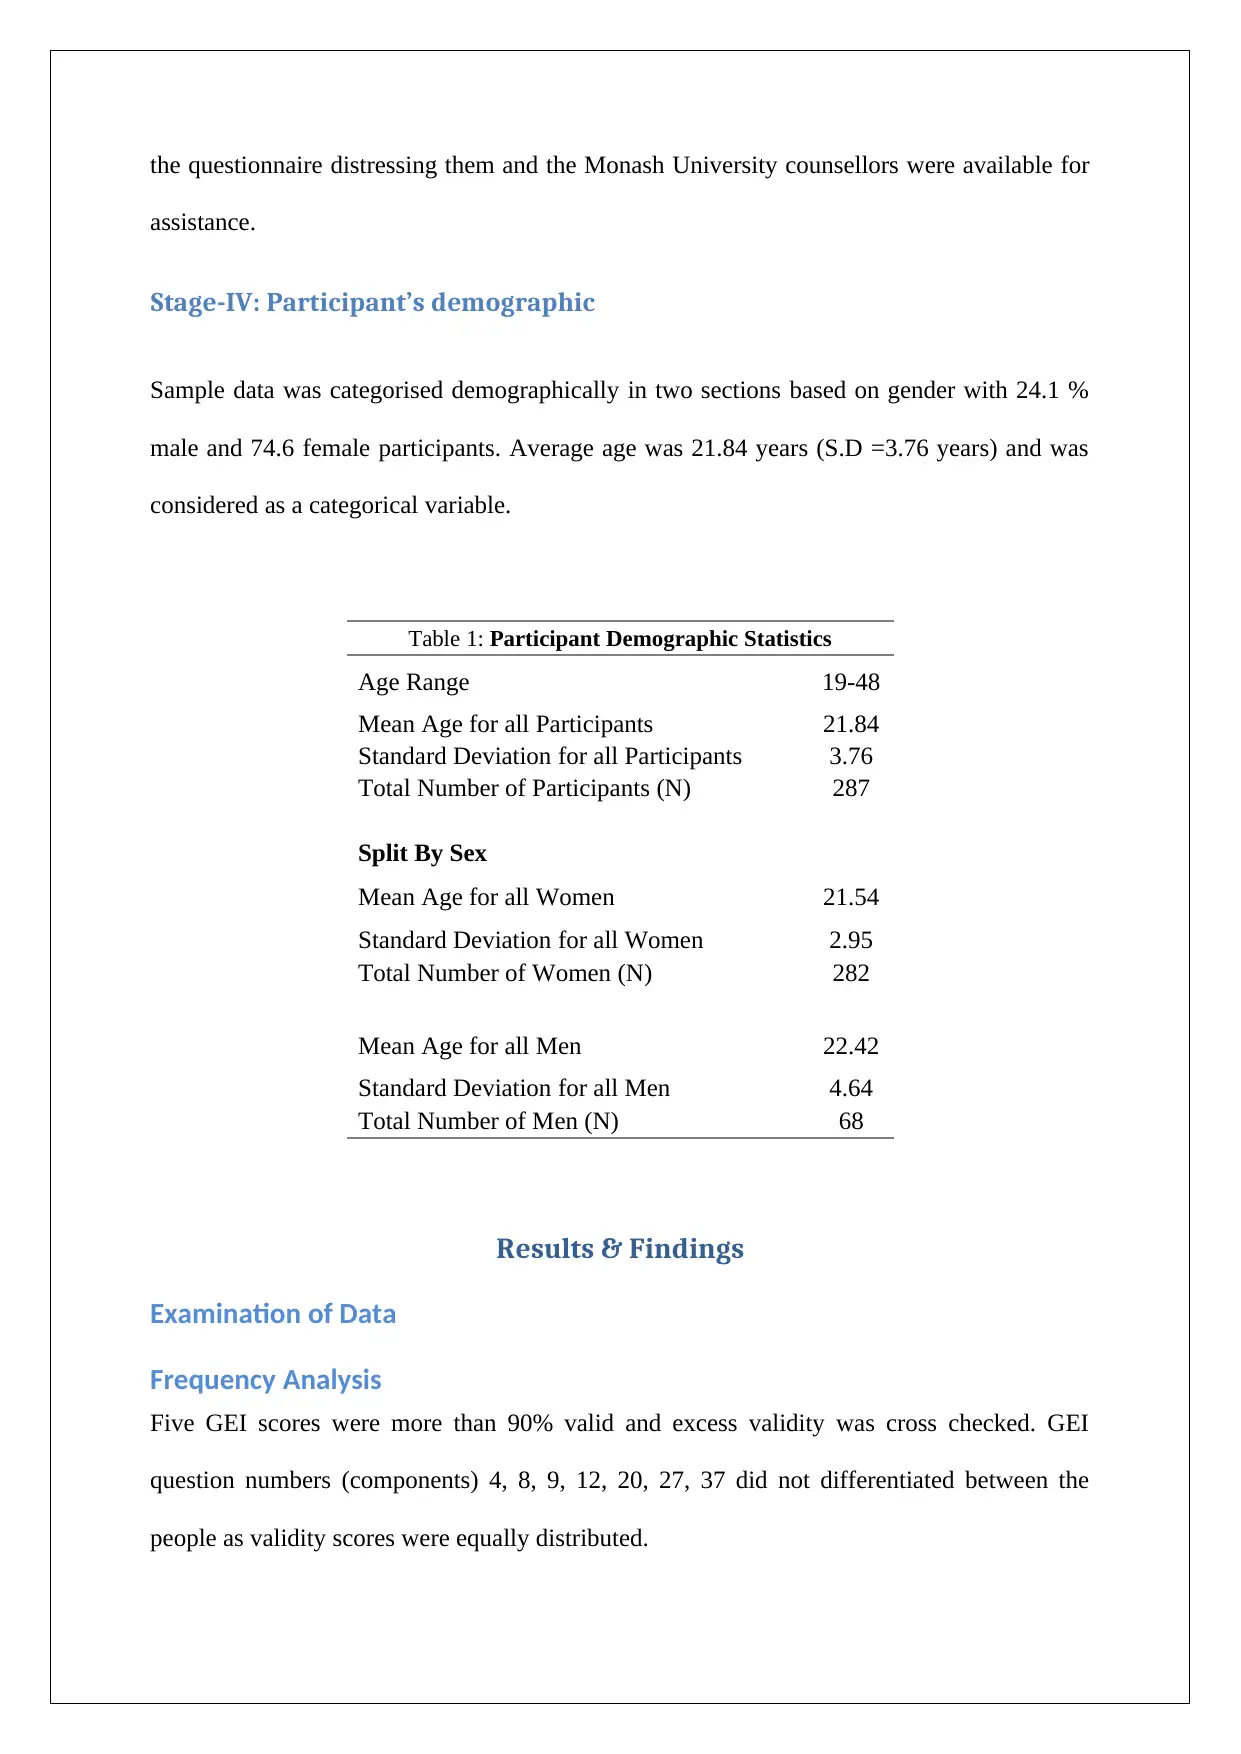
Sample data was categorised demographically in two sections based on gender with 24.1 %
male and 74.6 female participants. Average age was 21.84 years (S.D =3.76 years) and was
considered as a categorical variable.
Table 1: Participant Demographic Statistics
Age Range 19-48
Mean Age for all Participants 21.84
Standard Deviation for all Participants 3.76
Total Number of Participants (N) 287
Split By Sex
Mean Age for all Women 21.54
Standard Deviation for all Women 2.95
Total Number of Women (N) 282
Mean Age for all Men 22.42
Standard Deviation for all Men 4.64
Total Number of Men (N) 68
Results & Findings
Examination of Data
Frequency Analysis
Five GEI scores were more than 90% valid and excess validity was cross checked. GEI
question numbers (components) 4, 8, 9, 12, 20, 27, 37 did not differentiated between the
people as validity scores were equally distributed.
assistance.
Stage-IV: Participant’s demographic
Sample data was categorised demographically in two sections based on gender with 24.1 %
male and 74.6 female participants. Average age was 21.84 years (S.D =3.76 years) and was
considered as a categorical variable.
Table 1: Participant Demographic Statistics
Age Range 19-48
Mean Age for all Participants 21.84
Standard Deviation for all Participants 3.76
Total Number of Participants (N) 287
Split By Sex
Mean Age for all Women 21.54
Standard Deviation for all Women 2.95
Total Number of Women (N) 282
Mean Age for all Men 22.42
Standard Deviation for all Men 4.64
Total Number of Men (N) 68
Results & Findings
Examination of Data
Frequency Analysis
Five GEI scores were more than 90% valid and excess validity was cross checked. GEI
question numbers (components) 4, 8, 9, 12, 20, 27, 37 did not differentiated between the
people as validity scores were equally distributed.
Paraphrase This Document
Need a fresh take? Get an instant paraphrase of this document with our AI Paraphraser
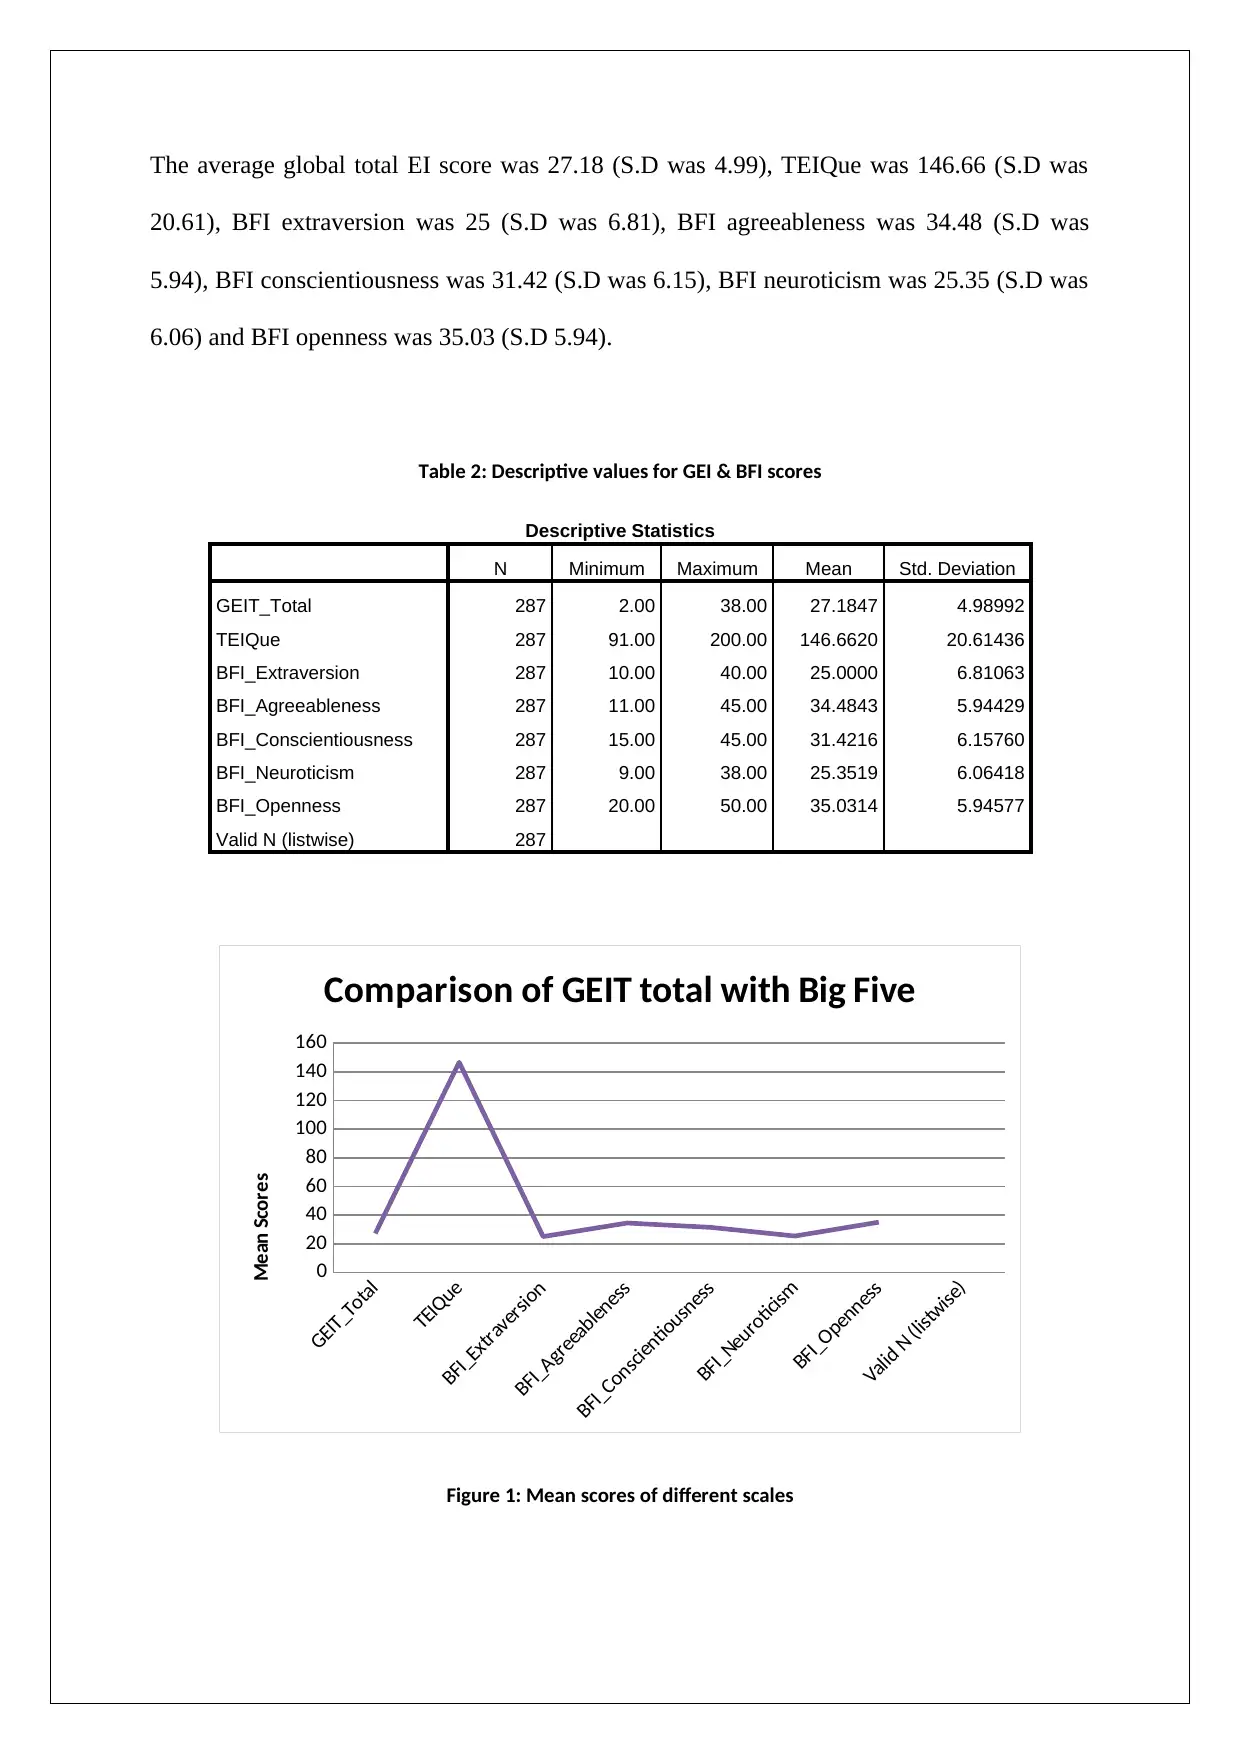
The average global total EI score was 27.18 (S.D was 4.99), TEIQue was 146.66 (S.D was
20.61), BFI extraversion was 25 (S.D was 6.81), BFI agreeableness was 34.48 (S.D was
5.94), BFI conscientiousness was 31.42 (S.D was 6.15), BFI neuroticism was 25.35 (S.D was
6.06) and BFI openness was 35.03 (S.D 5.94).
Table 2: Descriptive values for GEI & BFI scores
Descriptive Statistics
N Minimum Maximum Mean Std. Deviation
GEIT_Total 287 2.00 38.00 27.1847 4.98992
TEIQue 287 91.00 200.00 146.6620 20.61436
BFI_Extraversion 287 10.00 40.00 25.0000 6.81063
BFI_Agreeableness 287 11.00 45.00 34.4843 5.94429
BFI_Conscientiousness 287 15.00 45.00 31.4216 6.15760
BFI_Neuroticism 287 9.00 38.00 25.3519 6.06418
BFI_Openness 287 20.00 50.00 35.0314 5.94577
Valid N (listwise) 287
GEIT_Total
TEIQue
BFI_Extraversion
BFI_Agreeableness
BFI_Conscientiousness
BFI_Neuroticism
BFI_Openness
Valid N (listwise)
0
20
40
60
80
100
120
140
160
Comparison of GEIT total with Big Five
Mean Scores
Figure 1: Mean scores of different scales
Internal Consistency
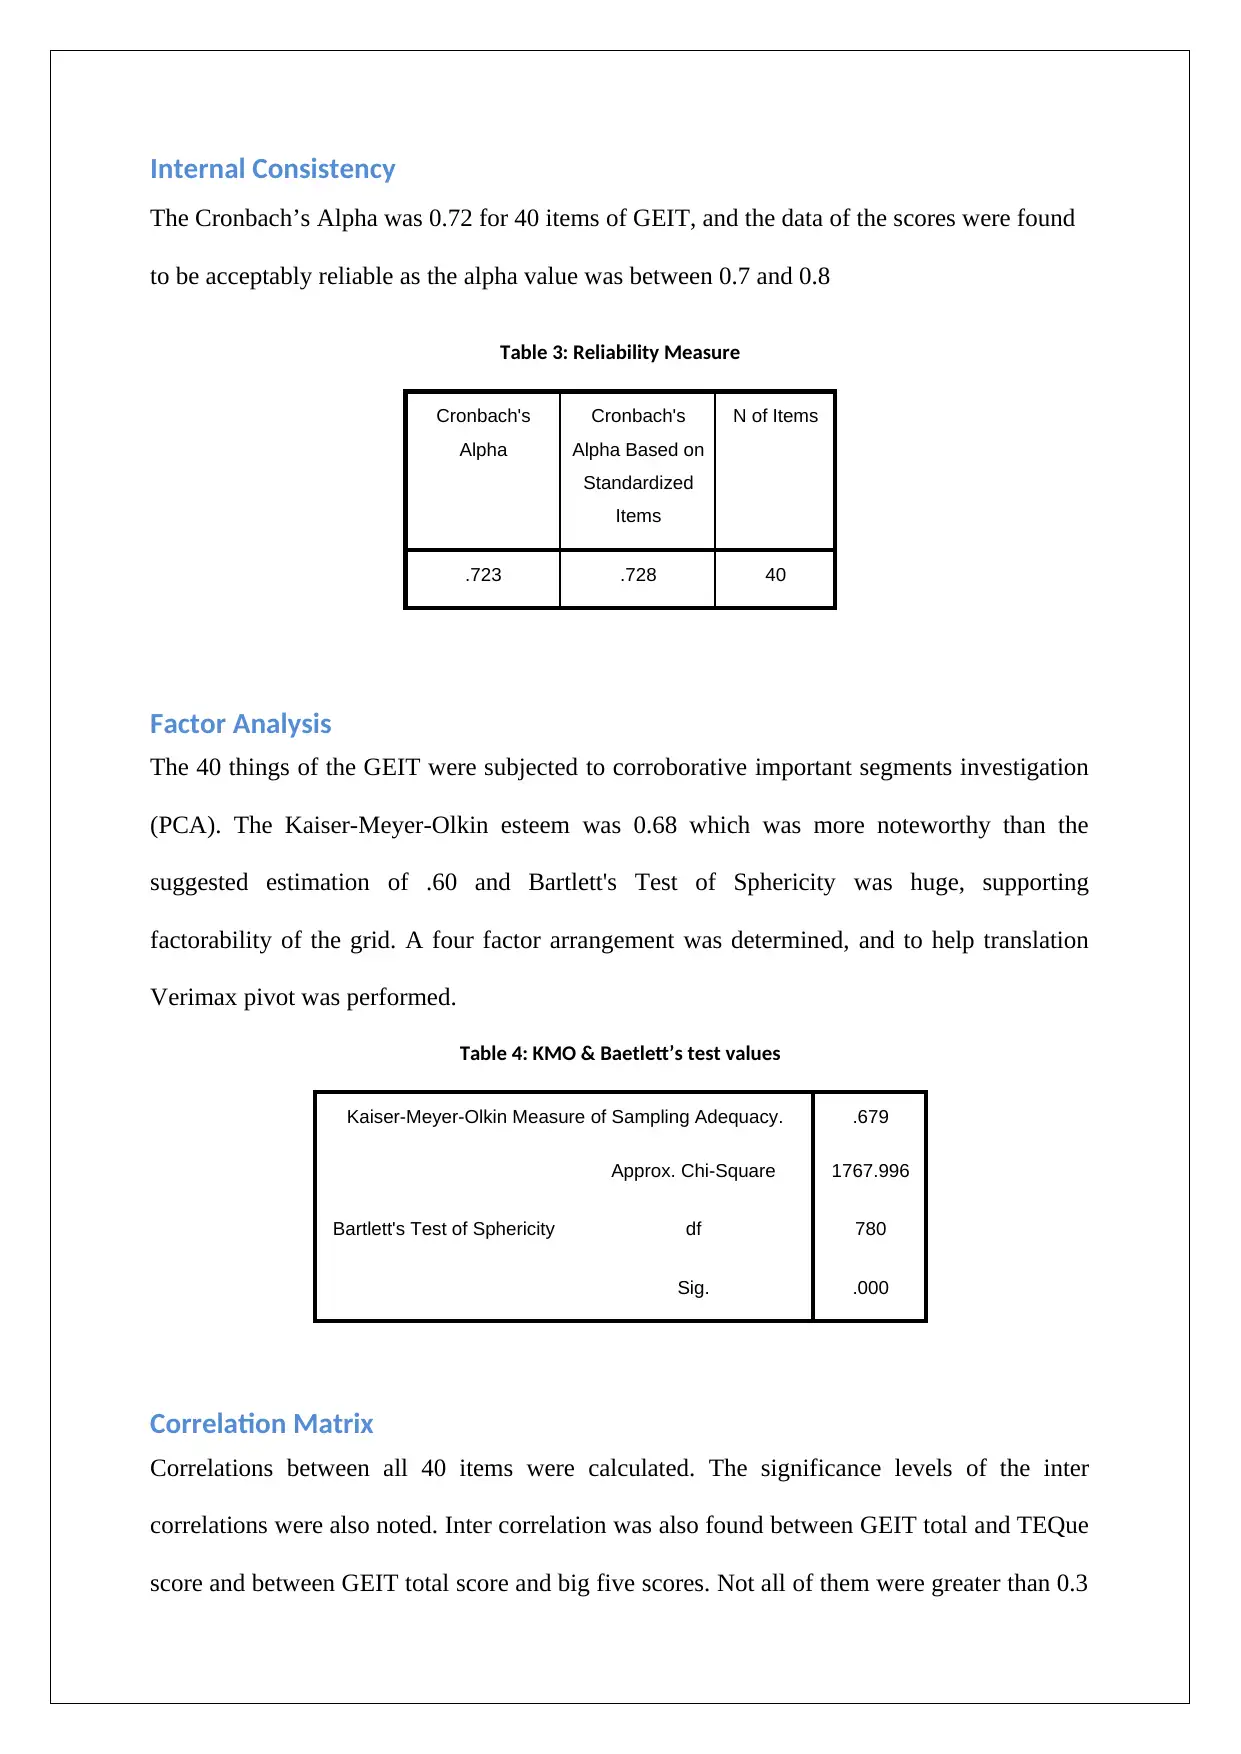
The Cronbach’s Alpha was 0.72 for 40 items of GEIT, and the data of the scores were found
to be acceptably reliable as the alpha value was between 0.7 and 0.8
Table 3: Reliability Measure
Cronbach's
Alpha
Cronbach's
Alpha Based on
Standardized
Items
N of Items
.723 .728 40
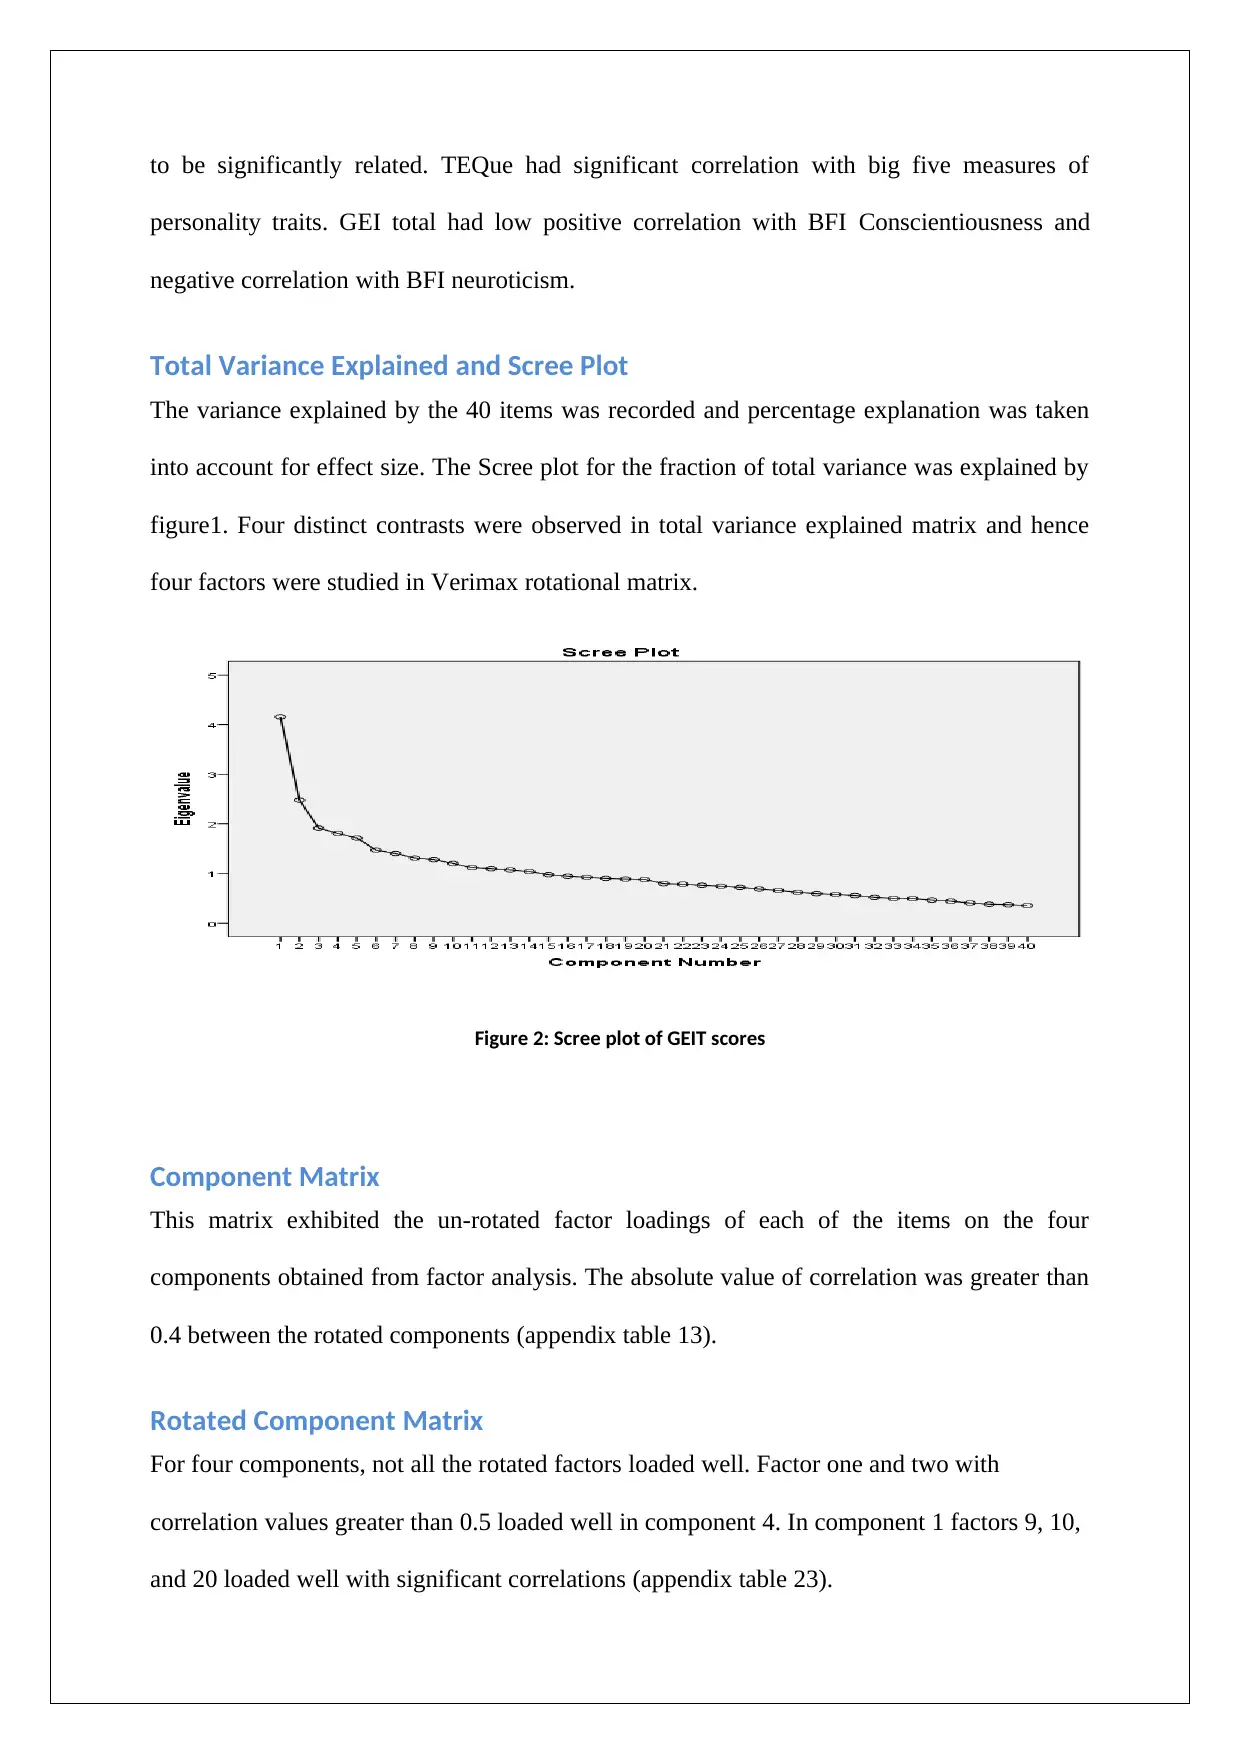
Factor Analysis
The 40 things of the GEIT were subjected to corroborative important segments investigation
(PCA). The Kaiser-Meyer-Olkin esteem was 0.68 which was more noteworthy than the
suggested estimation of .60 and Bartlett's Test of Sphericity was huge, supporting
factorability of the grid. A four factor arrangement was determined, and to help translation
Verimax pivot was performed.
Table 4: KMO & Baetlett’s test values
Kaiser-Meyer-Olkin Measure of Sampling Adequacy. .679
Bartlett's Test of Sphericity
Approx. Chi-Square 1767.996
df 780
Sig. .000
Correlation Matrix
Correlations between all 40 items were calculated. The significance levels of the inter
correlations were also noted. Inter correlation was also found between GEIT total and TEQue
score and between GEIT total score and big five scores. Not all of them were greater than 0.3
The Cronbach’s Alpha was 0.72 for 40 items of GEIT, and the data of the scores were found
to be acceptably reliable as the alpha value was between 0.7 and 0.8
Table 3: Reliability Measure
Cronbach's
Alpha
Cronbach's
Alpha Based on
Standardized
Items
N of Items
.723 .728 40
Factor Analysis
The 40 things of the GEIT were subjected to corroborative important segments investigation
(PCA). The Kaiser-Meyer-Olkin esteem was 0.68 which was more noteworthy than the
suggested estimation of .60 and Bartlett's Test of Sphericity was huge, supporting
factorability of the grid. A four factor arrangement was determined, and to help translation
Verimax pivot was performed.
Table 4: KMO & Baetlett’s test values
Kaiser-Meyer-Olkin Measure of Sampling Adequacy. .679
Bartlett's Test of Sphericity
Approx. Chi-Square 1767.996
df 780
Sig. .000
Correlation Matrix
Correlations between all 40 items were calculated. The significance levels of the inter
correlations were also noted. Inter correlation was also found between GEIT total and TEQue
score and between GEIT total score and big five scores. Not all of them were greater than 0.3
⊘ This is a preview!⊘
Do you want full access?
Subscribe today to unlock all pages.
Trusted by 1+ million students worldwide
to be significantly related. TEQue had significant correlation with big five measures of
personality traits. GEI total had low positive correlation with BFI Conscientiousness and
negative correlation with BFI neuroticism.
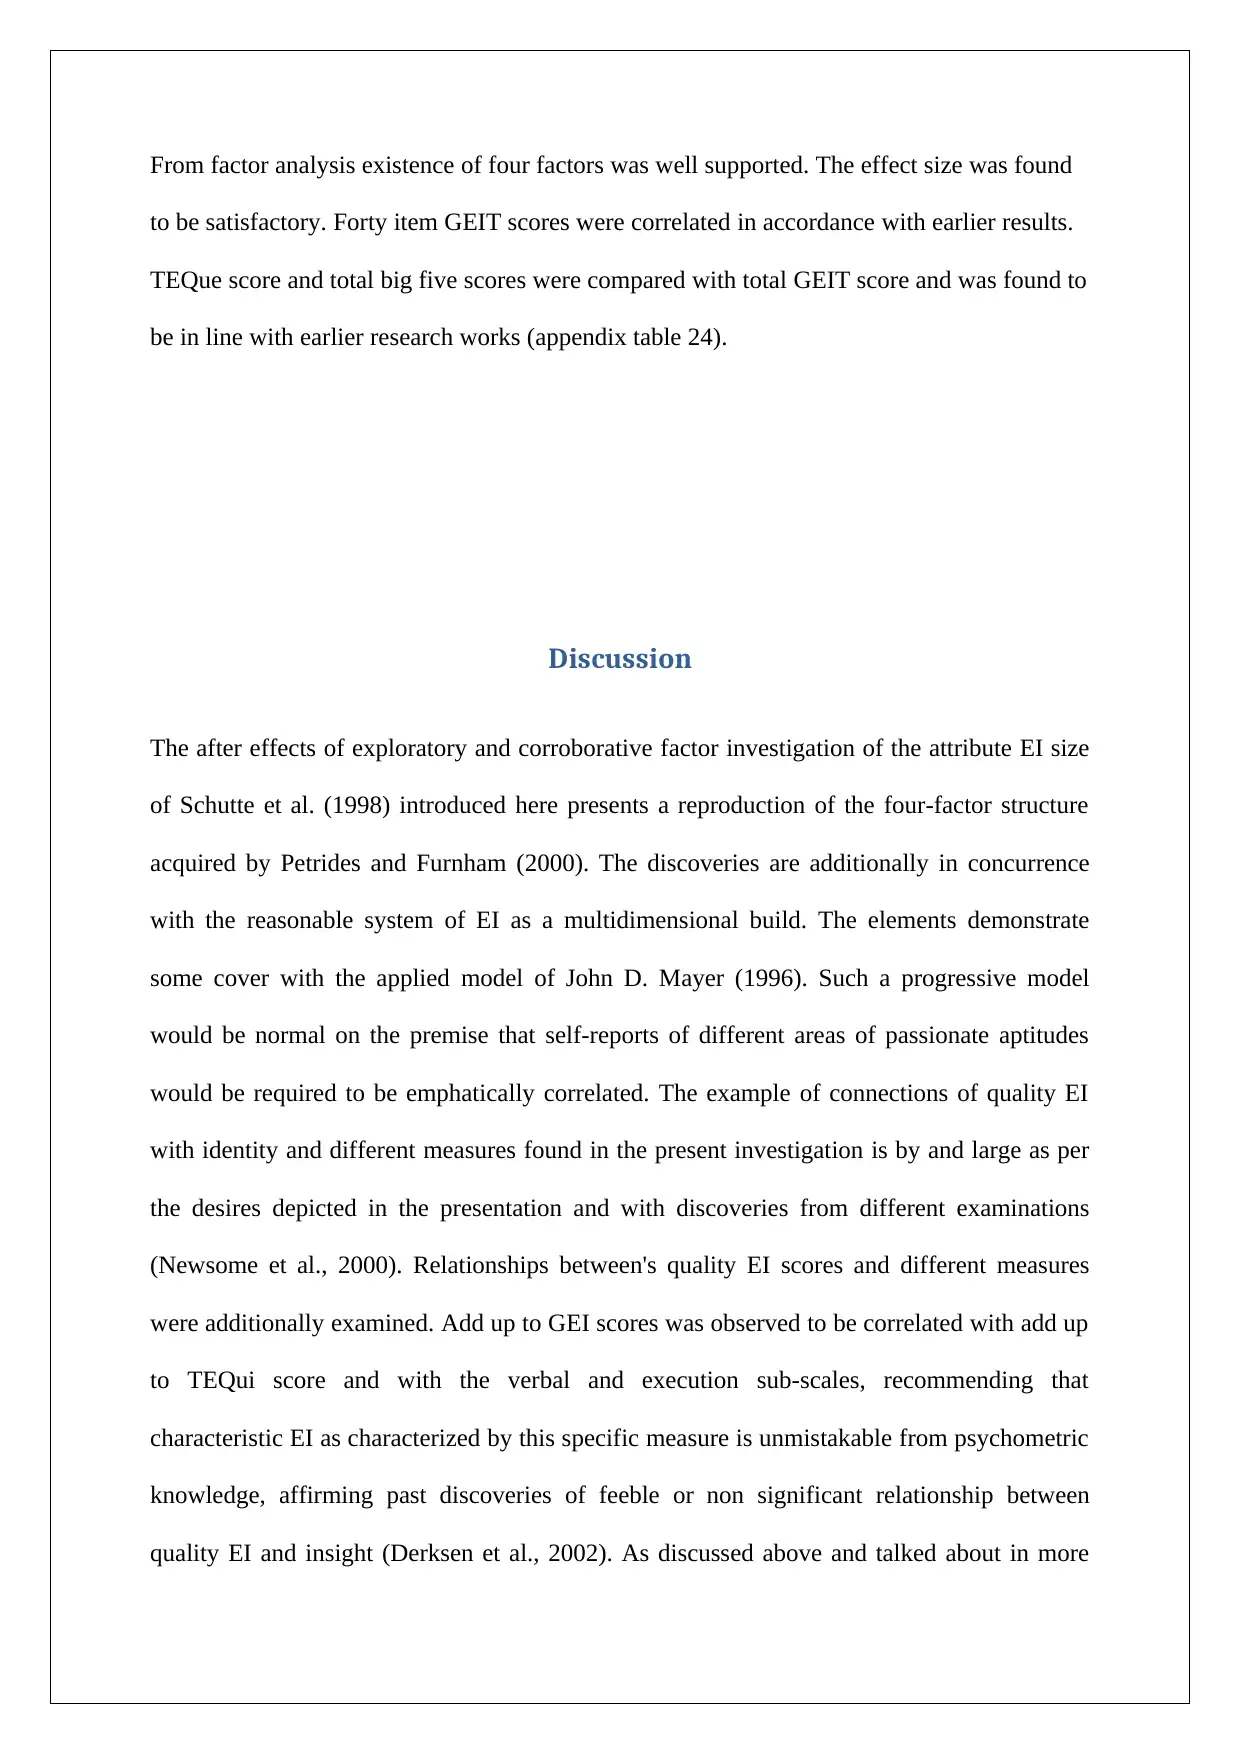
Total Variance Explained and Scree Plot
The variance explained by the 40 items was recorded and percentage explanation was taken
into account for effect size. The Scree plot for the fraction of total variance was explained by
figure1. Four distinct contrasts were observed in total variance explained matrix and hence
four factors were studied in Verimax rotational matrix.
Figure 2: Scree plot of GEIT scores
Component Matrix
This matrix exhibited the un-rotated factor loadings of each of the items on the four
components obtained from factor analysis. The absolute value of correlation was greater than
0.4 between the rotated components (appendix table 13).
Rotated Component Matrix
For four components, not all the rotated factors loaded well. Factor one and two with
correlation values greater than 0.5 loaded well in component 4. In component 1 factors 9, 10,
and 20 loaded well with significant correlations (appendix table 23).
personality traits. GEI total had low positive correlation with BFI Conscientiousness and
negative correlation with BFI neuroticism.
Total Variance Explained and Scree Plot
The variance explained by the 40 items was recorded and percentage explanation was taken
into account for effect size. The Scree plot for the fraction of total variance was explained by
figure1. Four distinct contrasts were observed in total variance explained matrix and hence
four factors were studied in Verimax rotational matrix.
Figure 2: Scree plot of GEIT scores
Component Matrix
This matrix exhibited the un-rotated factor loadings of each of the items on the four
components obtained from factor analysis. The absolute value of correlation was greater than
0.4 between the rotated components (appendix table 13).
Rotated Component Matrix
For four components, not all the rotated factors loaded well. Factor one and two with
correlation values greater than 0.5 loaded well in component 4. In component 1 factors 9, 10,
and 20 loaded well with significant correlations (appendix table 23).
Paraphrase This Document
Need a fresh take? Get an instant paraphrase of this document with our AI Paraphraser
From factor analysis existence of four factors was well supported. The effect size was found
to be satisfactory. Forty item GEIT scores were correlated in accordance with earlier results.
TEQue score and total big five scores were compared with total GEIT score and was found to
be in line with earlier research works (appendix table 24).
Discussion
The after effects of exploratory and corroborative factor investigation of the attribute EI size
of Schutte et al. (1998) introduced here presents a reproduction of the four-factor structure
acquired by Petrides and Furnham (2000). The discoveries are additionally in concurrence
with the reasonable system of EI as a multidimensional build. The elements demonstrate
some cover with the applied model of John D. Mayer (1996). Such a progressive model
would be normal on the premise that self-reports of different areas of passionate aptitudes
would be required to be emphatically correlated. The example of connections of quality EI
with identity and different measures found in the present investigation is by and large as per
the desires depicted in the presentation and with discoveries from different examinations
(Newsome et al., 2000). Relationships between's quality EI scores and different measures
were additionally examined. Add up to GEI scores was observed to be correlated with add up
to TEQui score and with the verbal and execution sub-scales, recommending that
characteristic EI as characterized by this specific measure is unmistakable from psychometric
knowledge, affirming past discoveries of feeble or non significant relationship between
quality EI and insight (Derksen et al., 2002). As discussed above and talked about in more
detail somewhere else (Petrides, Pita et al., 2007), an attention on area particular parts of
identity will be helpful for hypothetically determined research that accentuates replication
and clarification. This objective isn't best served by imagination about that happily relapse
criteria on five wide, thoughtfully inconsequential variables (Big Five).
Feelings are yet a solitary, yet major, space of identity, and it will be important to stretch out
attribute EI hypothesis to envelop other vital areas such as social, individual, and Meta
cognitive areas. The acknowledgment of this point holds guarantee for the mix of self-idea,
self-adequacy, and false knowledge models into the standard scientific classifications of
identity. The TEIQue has been intended to give far reaching scope of the sampling space of
characteristic EI that is of the feeling related parts of identity
There are a few confinements to this investigation that ought to be considered. The first is the
example estimate utilized as a part of the present examination and the way they were directed
crosswise over statistic subgroups. Moreover, factor investigation normally requires
substantial test sizes to accomplish dependability in assessing the models. Future research
should in this manner reproduce these discoveries on bigger examples to guarantee the
dependability of the models, and therefore the discoveries.
Second, despite the fact that GEIT was utilized as a part of the present investigation to
inspect the structure of the BFI for reasons for having the capacity to contrast it with different
examinations utilizing comparative techniques (Schmitt and Allik, 2005), different strategies
ought to be used.
⊘ This is a preview!⊘
Do you want full access?
Subscribe today to unlock all pages.
Trusted by 1+ million students worldwide
1 out of 36
Your All-in-One AI-Powered Toolkit for Academic Success.
+13062052269
info@desklib.com
Available 24*7 on WhatsApp / Email
![[object Object]](/_next/static/media/star-bottom.7253800d.svg)
Unlock your academic potential
Copyright © 2020–2026 A2Z Services. All Rights Reserved. Developed and managed by ZUCOL.