PUB708 Quantitative Research: Impact of Gender, Age on Blood Pressure
VerifiedAdded on  2023/06/03
|16
|2339
|429
Report
AI Summary
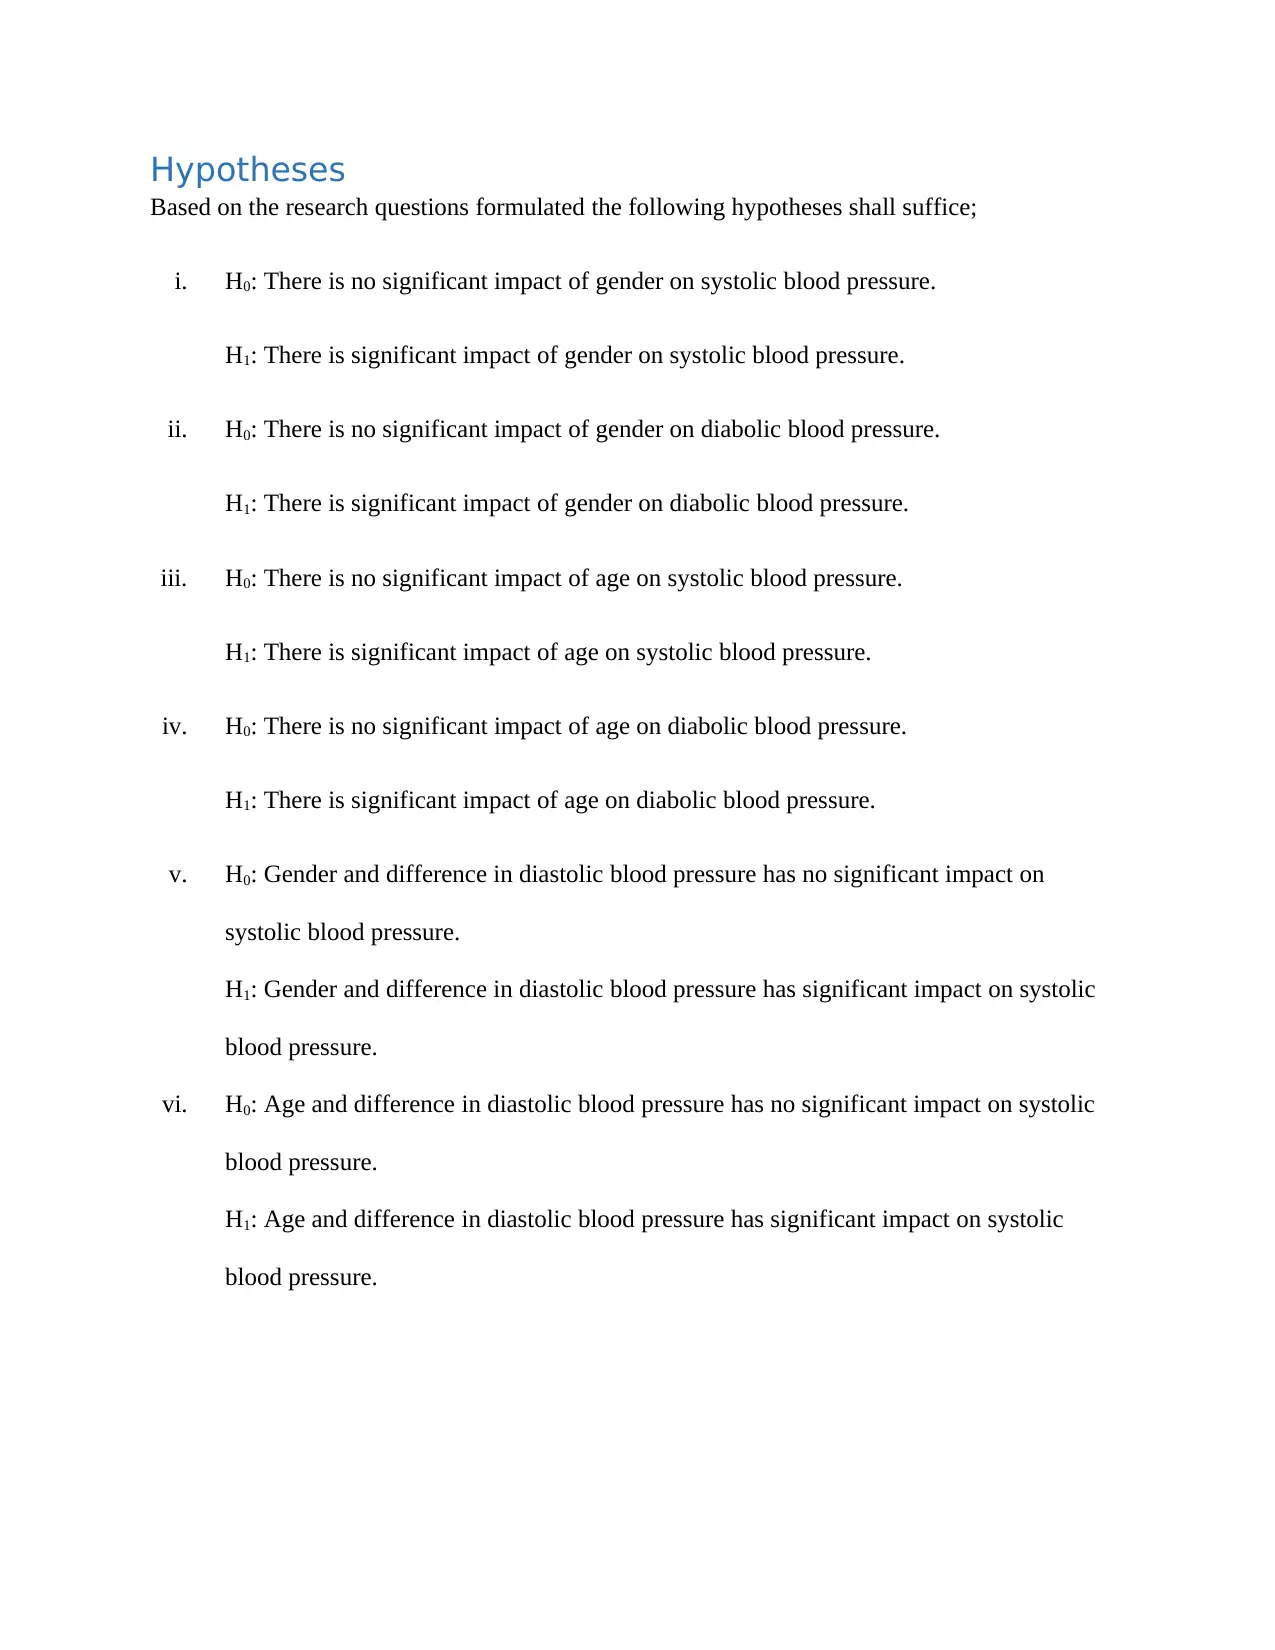
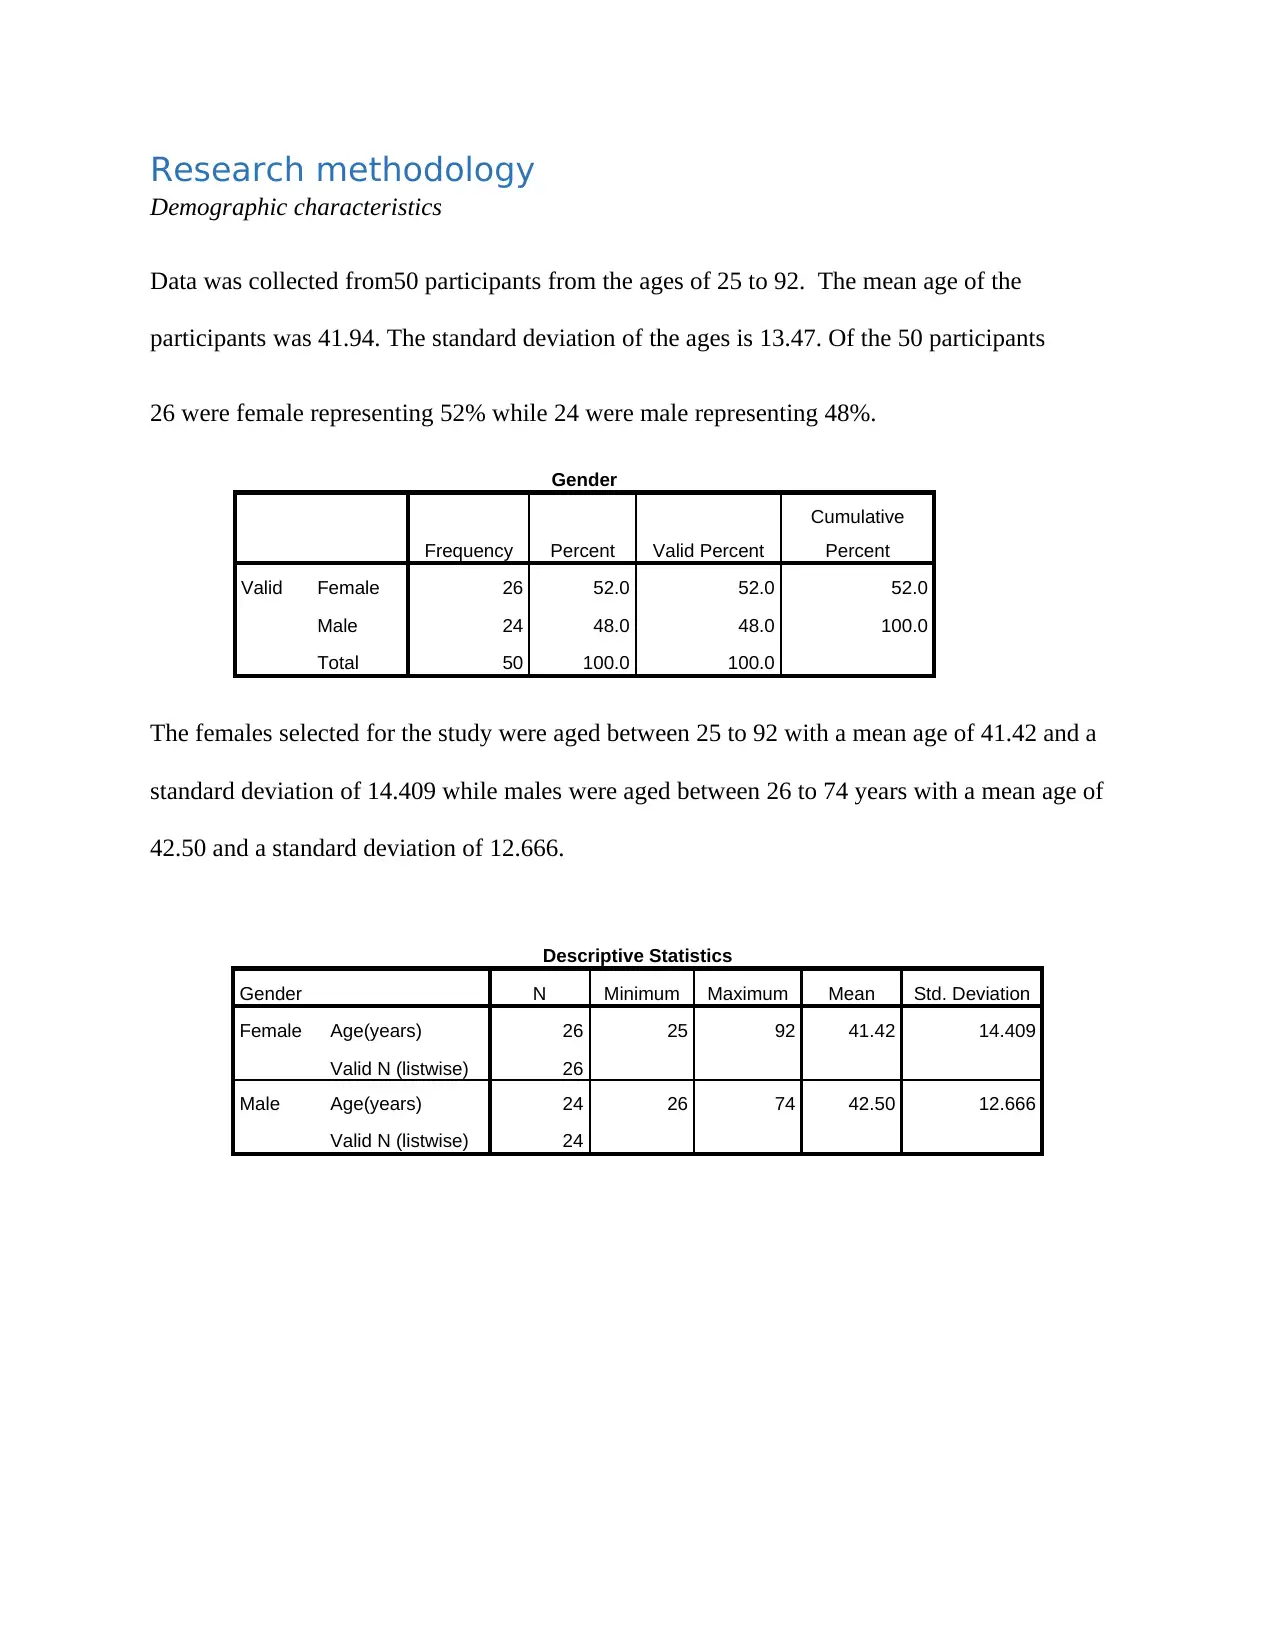
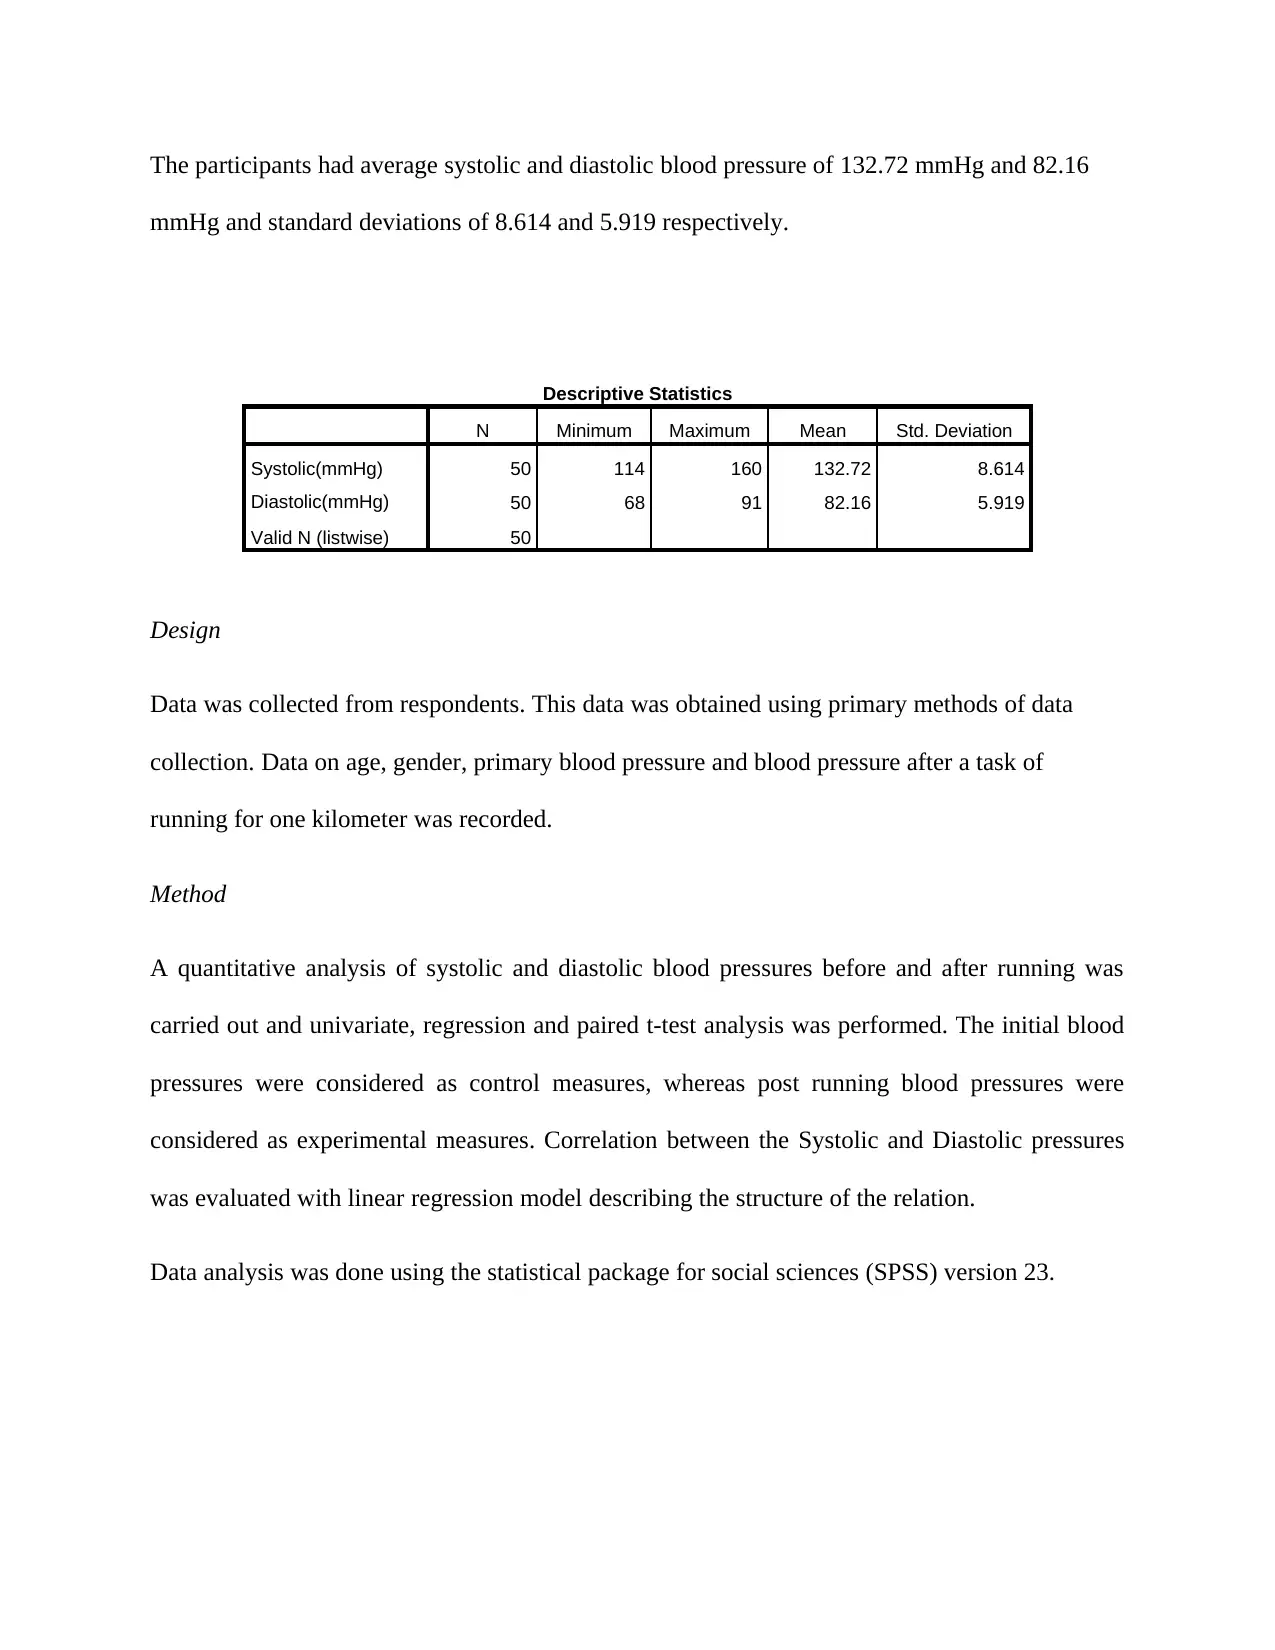
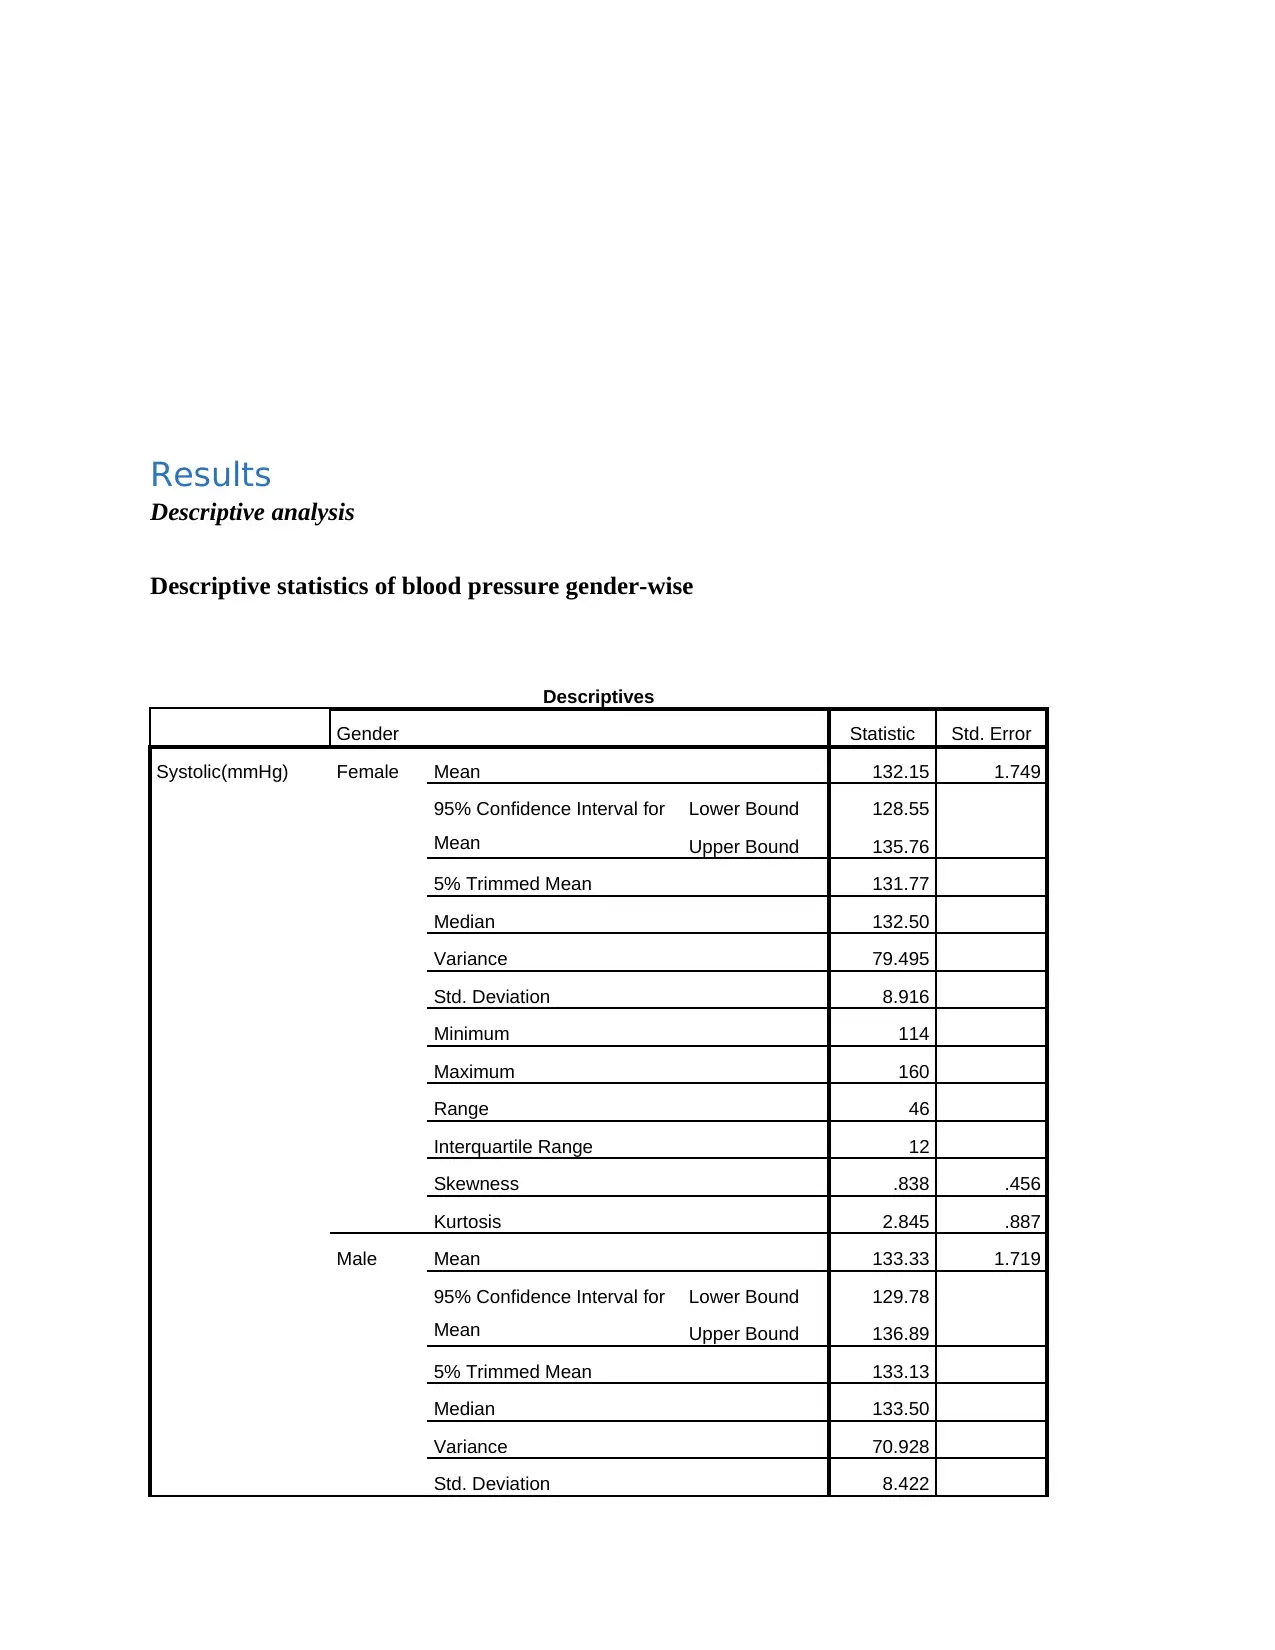
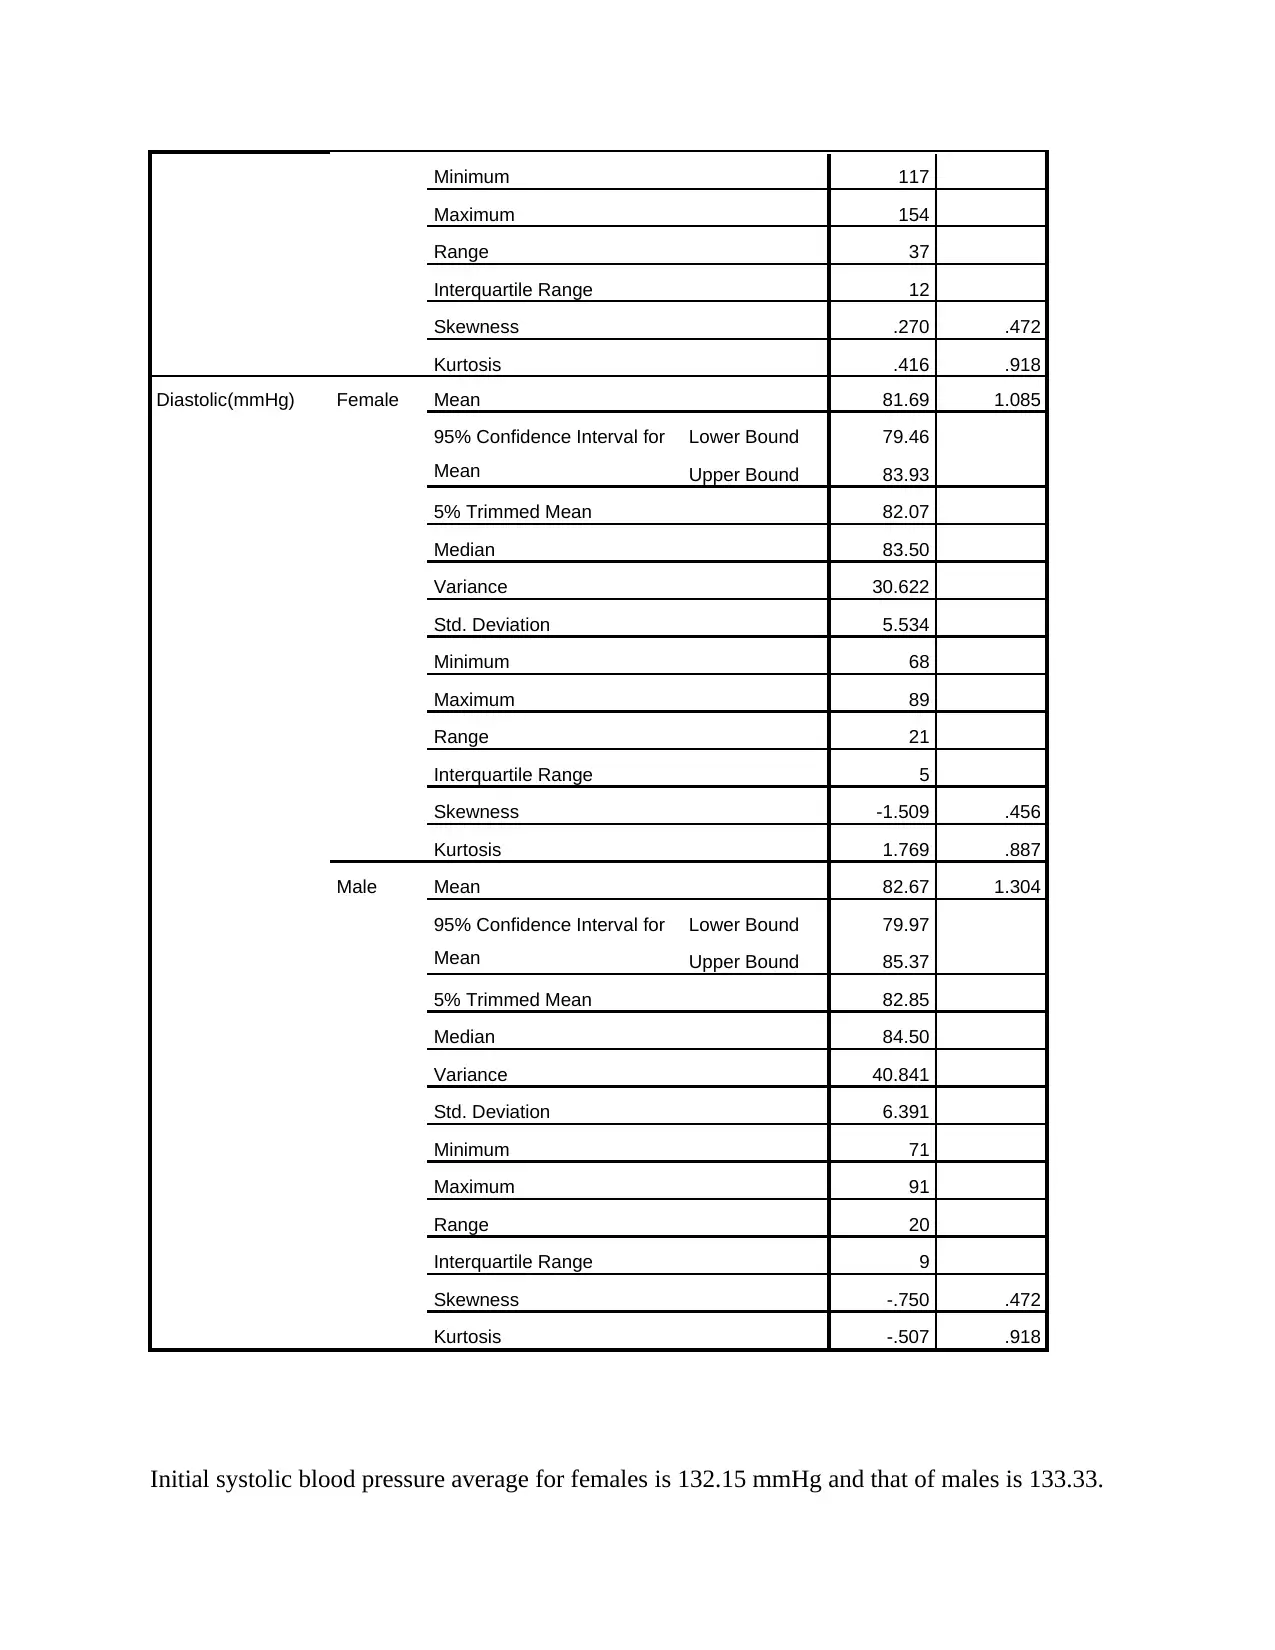
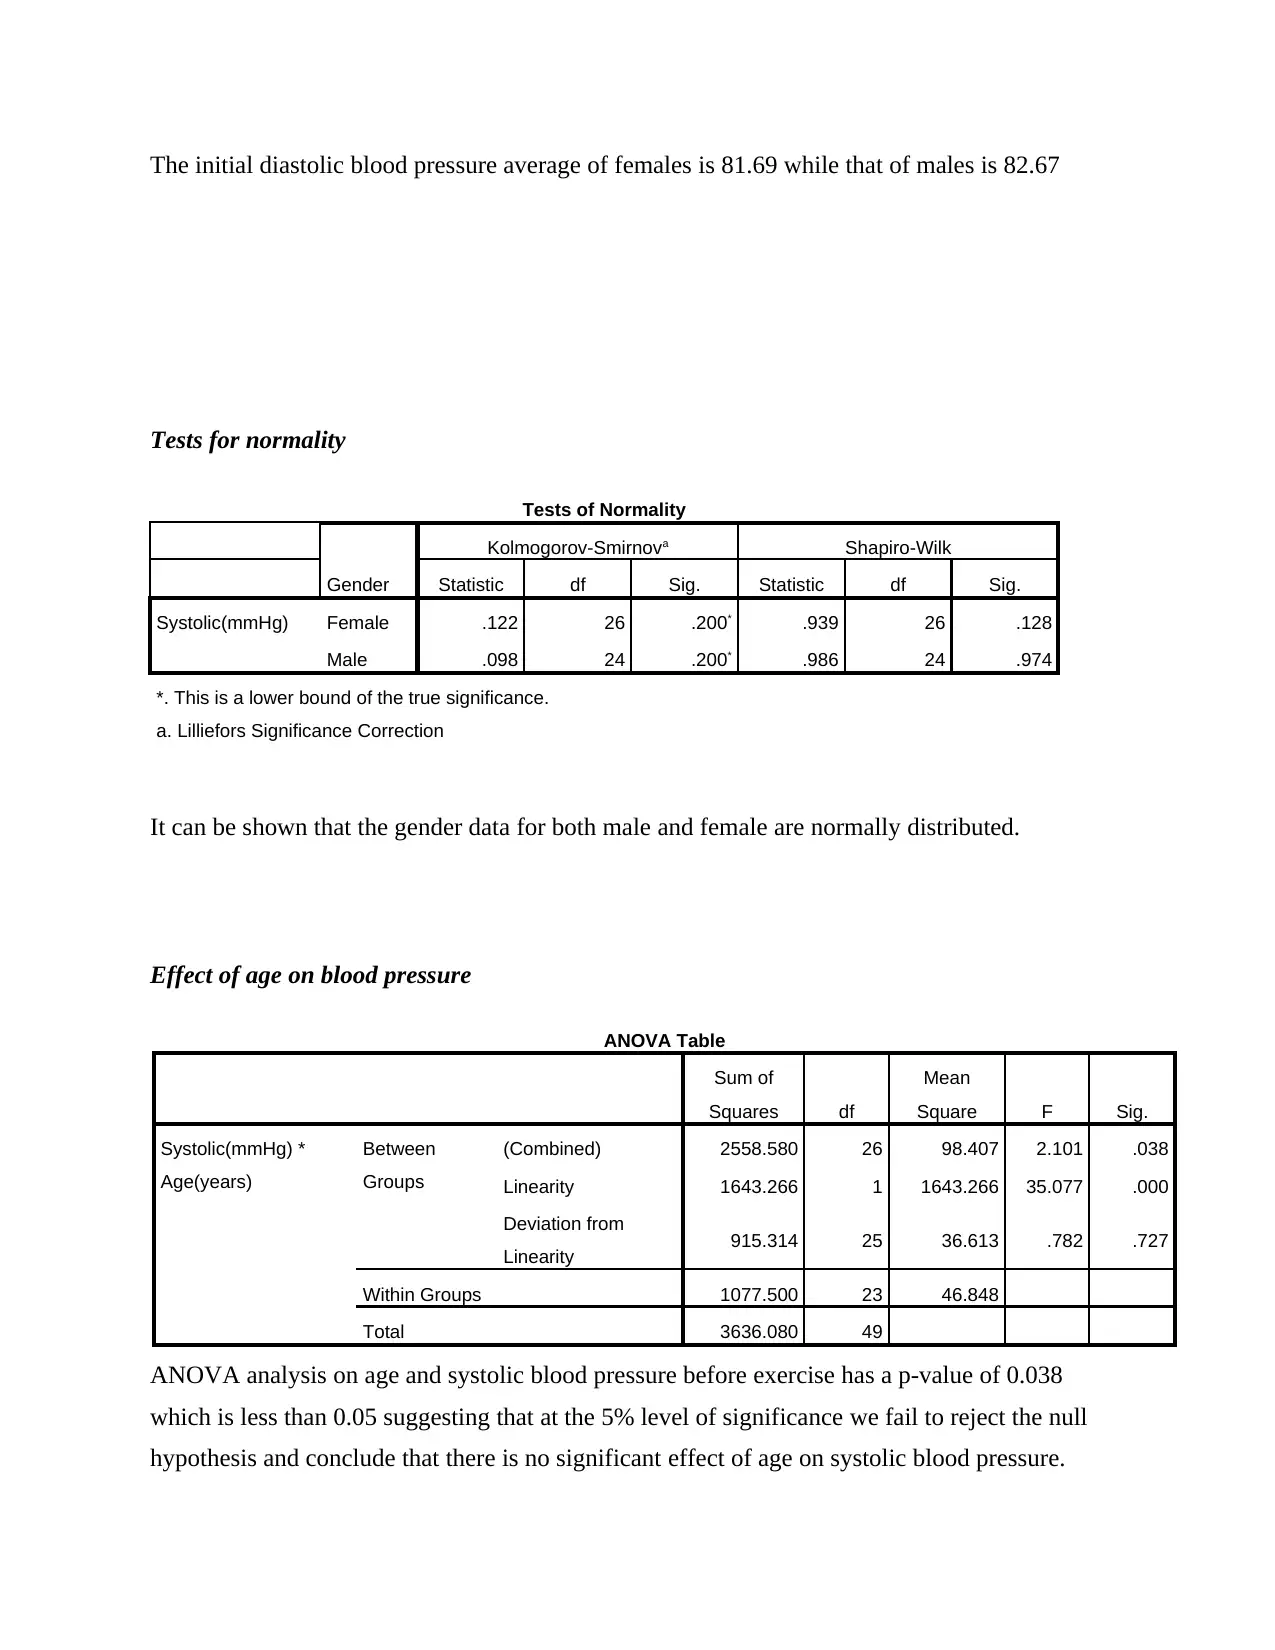
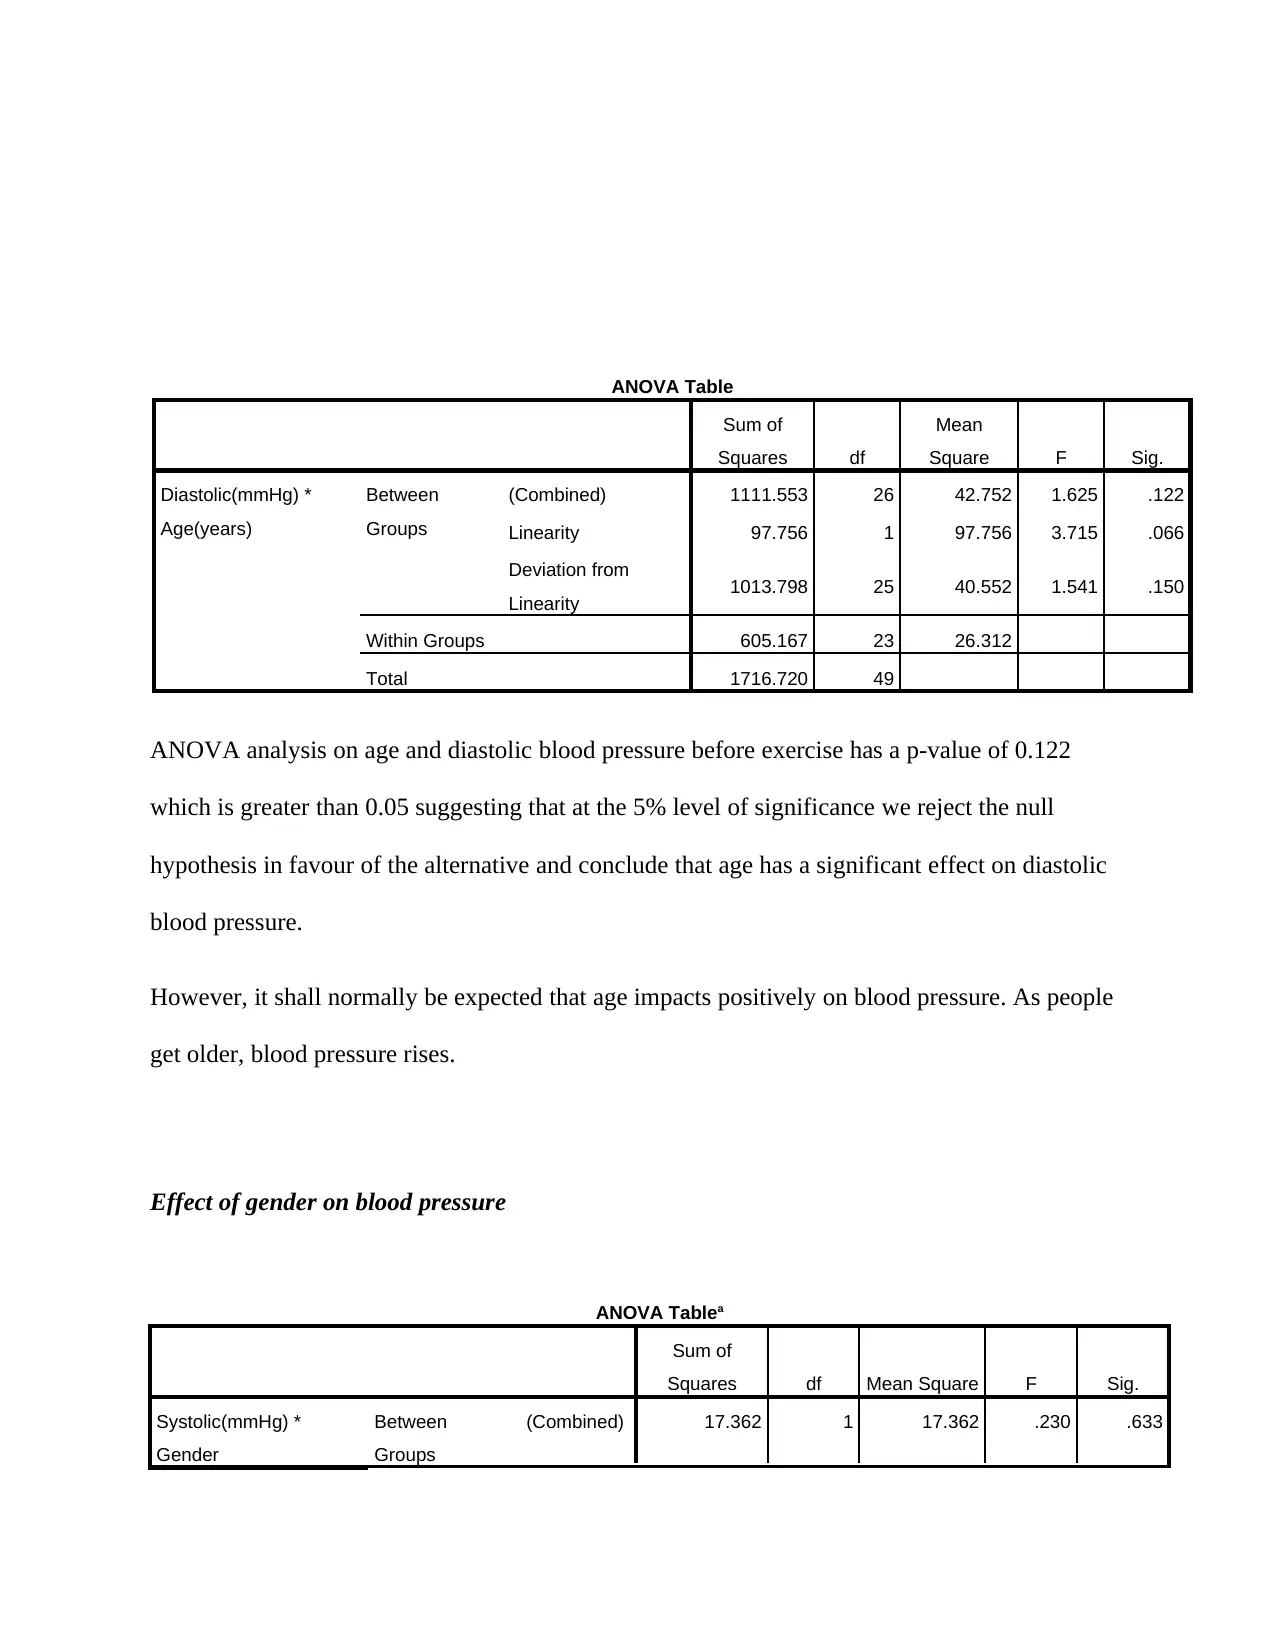
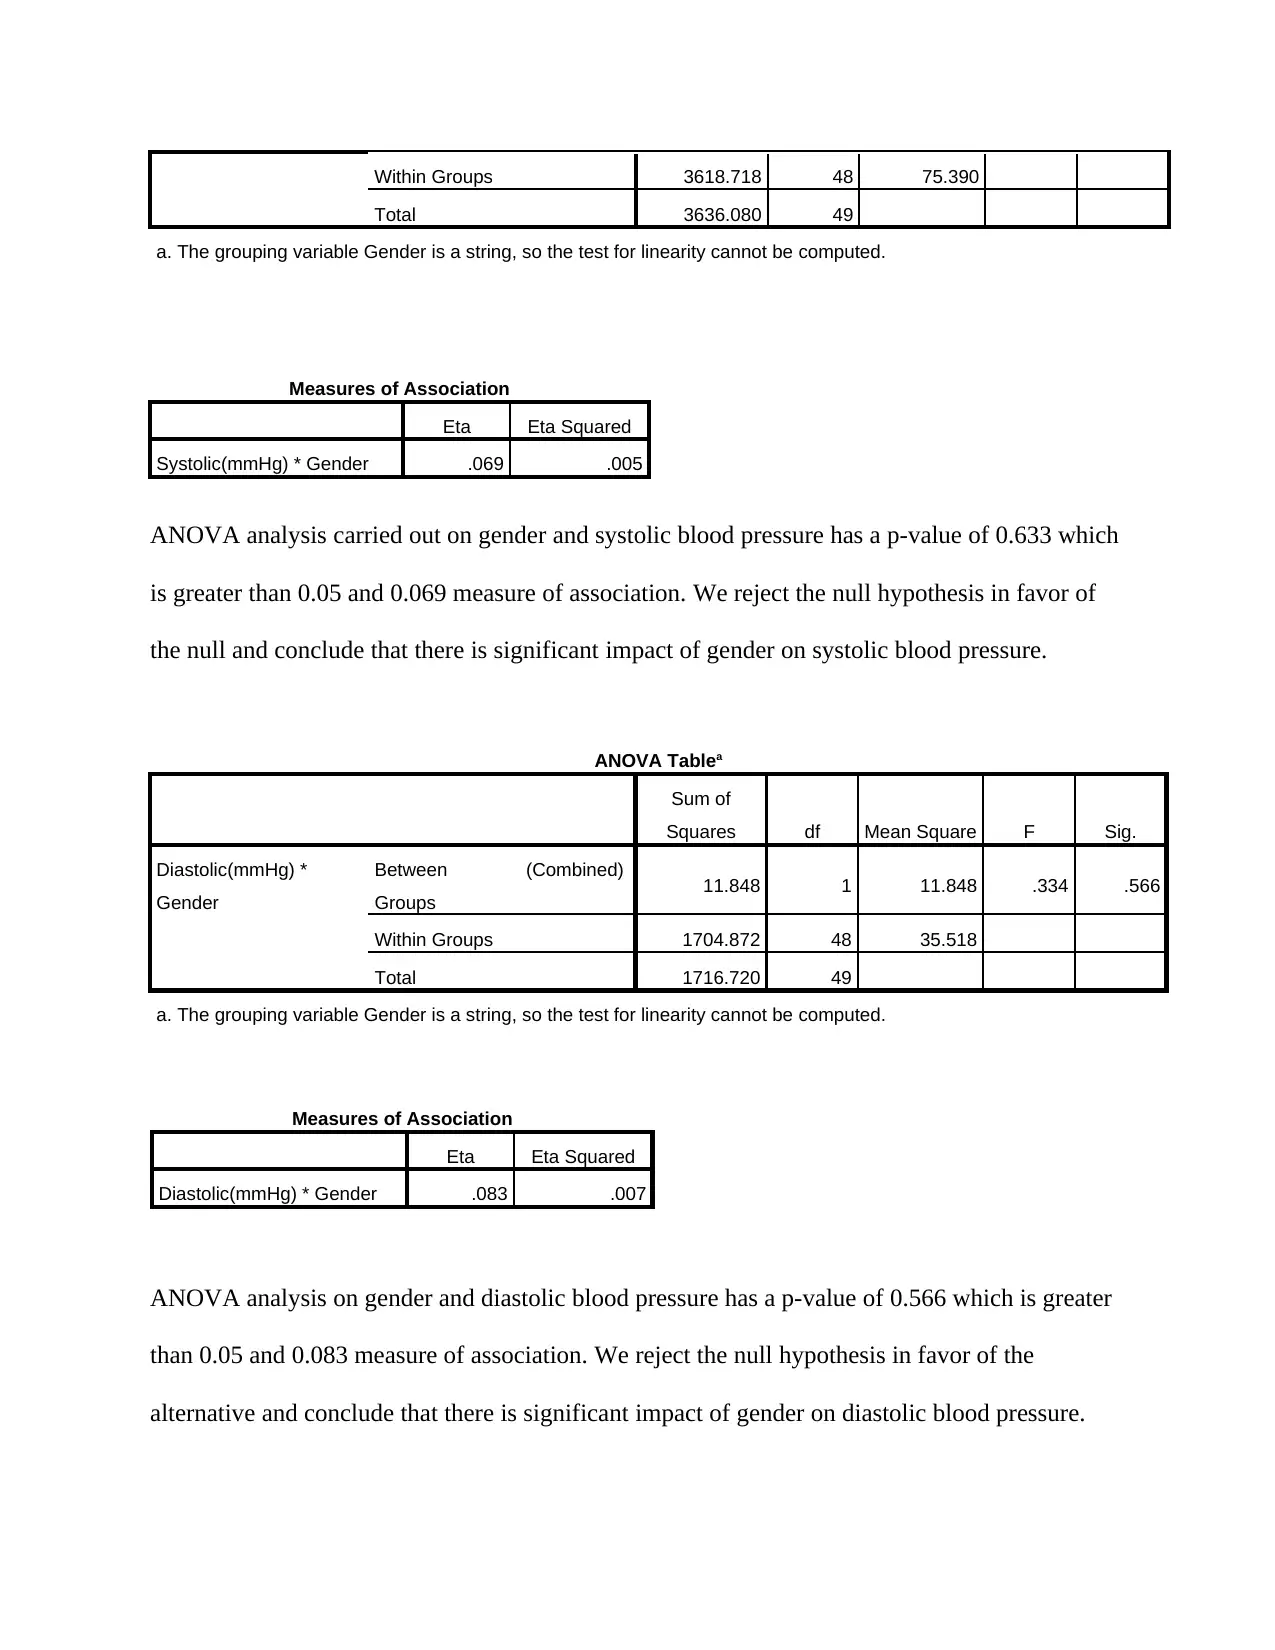
This research report investigates the effects of gender and age on blood pressure, utilizing data collected from 50 participants aged 25 to 92. The study employs quantitative analysis, including ANOVA and paired t-tests, to assess the impact of these factors on both systolic and diastolic blood pressure. While the study found that age and physical activity (running) did not have a statistically significant effect on blood pressure, gender was found to have a significant correlation. Regression analysis further explored the relationship between diastolic blood pressure, age, and systolic blood pressure, revealing a statistically significant model. The report concludes that gender plays a more significant role in influencing blood pressure levels than age or physical activity in the studied population. The complete research paper is available on Desklib, along with numerous other solved assignments and study resources for students.

EFFECT OF GENDER AND AGE ON BLOOD
PRESSURE
PRESSURE
Paraphrase This Document
Need a fresh take? Get an instant paraphrase of this document with our AI Paraphraser

Table of Contents
Introduction.................................................................................................................................................4
Hypotheses..................................................................................................................................................5
Research methodology................................................................................................................................6
Results.........................................................................................................................................................8
Conclusion.................................................................................................................................................15
References.................................................................................................................................................16

Abstract
This research was carried out to assess the impact of age, gender and physical activity on blood
pressure levels. The effect of age and physical activity (running) was found not to have
significant effect on blood pressure. Gender-being male or female was found to have significant
difference on blood pressure.
⊘ This is a preview!⊘
Do you want full access?
Subscribe today to unlock all pages.

Trusted by 1+ million students worldwide

Introduction
According to (Pregnancy, 2000) blood pressure is the pressure of blood on the walls of blood
vessels as the heart pumps it around the body. Blood pressure naturally goes up and down all the
time, adjusting to the heart’s needs depending on what is doing. Blood pressure tends to be low
during rest whereas it rises during exercise (Jing Fang, 2002).
High blood pressure occurs when blood pressure is unusually higher than normal. Blood pressure
above 139/89 mmHg can be described as high blood pressure (Cheng, 2014). Blood pressure
may be influenced by several factors some of which are age, gender, weight, genetics, alcohol
activity and how much physical activity one does (M Türkmen, 2004).
For purposes of this research we shall assess the impact of gender and age on systolic and
diastolic blood pressure.
Research question
The following two research questions guided the study:
i. Does gender have any impact on systolic blood pressure?
ii. Does gender have any impact on diastolic blood pressure?
iii. Does age have any impact on systolic blood pressure?
iv. Does age have any diastolic impact on blood pressure?
v. Does age and differences in diastolic blood pressure have any impact on changes in
systolic pressure?
vi. Does gender and differences in diastolic pressure have any impact on changes in systolic
blood pressure?
Paraphrase This Document
Need a fresh take? Get an instant paraphrase of this document with our AI Paraphraser

Hypotheses
Based on the research questions formulated the following hypotheses shall suffice;
i. H0: There is no significant impact of gender on systolic blood pressure.
H1: There is significant impact of gender on systolic blood pressure.
ii. H0: There is no significant impact of gender on diabolic blood pressure.
H1: There is significant impact of gender on diabolic blood pressure.
iii. H0: There is no significant impact of age on systolic blood pressure.
H1: There is significant impact of age on systolic blood pressure.
iv. H0: There is no significant impact of age on diabolic blood pressure.
H1: There is significant impact of age on diabolic blood pressure.
v. H0: Gender and difference in diastolic blood pressure has no significant impact on
systolic blood pressure.
H1: Gender and difference in diastolic blood pressure has significant impact on systolic
blood pressure.
vi. H0: Age and difference in diastolic blood pressure has no significant impact on systolic
blood pressure.
H1: Age and difference in diastolic blood pressure has significant impact on systolic
blood pressure.

Research methodology
Demographic characteristics
Data was collected from50 participants from the ages of 25 to 92. The mean age of the
participants was 41.94. The standard deviation of the ages is 13.47. Of the 50 participants
26 were female representing 52% while 24 were male representing 48%.
The females selected for the study were aged between 25 to 92 with a mean age of 41.42 and a
standard deviation of 14.409 while males were aged between 26 to 74 years with a mean age of
42.50 and a standard deviation of 12.666.
Gender
Frequency Percent Valid Percent
Cumulative
Percent
Valid Female 26 52.0 52.0 52.0
Male 24 48.0 48.0 100.0
Total 50 100.0 100.0
Descriptive Statistics
Gender N Minimum Maximum Mean Std. Deviation
Female Age(years) 26 25 92 41.42 14.409
Valid N (listwise) 26
Male Age(years) 24 26 74 42.50 12.666
Valid N (listwise) 24
⊘ This is a preview!⊘
Do you want full access?
Subscribe today to unlock all pages.

Trusted by 1+ million students worldwide

The participants had average systolic and diastolic blood pressure of 132.72 mmHg and 82.16
mmHg and standard deviations of 8.614 and 5.919 respectively.
Design
Data was collected from respondents. This data was obtained using primary methods of data
collection. Data on age, gender, primary blood pressure and blood pressure after a task of
running for one kilometer was recorded.
Method
A quantitative analysis of systolic and diastolic blood pressures before and after running was
carried out and univariate, regression and paired t-test analysis was performed. The initial blood
pressures were considered as control measures, whereas post running blood pressures were
considered as experimental measures. Correlation between the Systolic and Diastolic pressures
was evaluated with linear regression model describing the structure of the relation.
Data analysis was done using the statistical package for social sciences (SPSS) version 23.
Descriptive Statistics
N Minimum Maximum Mean Std. Deviation
Systolic(mmHg) 50 114 160 132.72 8.614
Diastolic(mmHg) 50 68 91 82.16 5.919
Valid N (listwise) 50
Paraphrase This Document
Need a fresh take? Get an instant paraphrase of this document with our AI Paraphraser

Results
Descriptive analysis
Descriptive statistics of blood pressure gender-wise
Descriptives
Gender Statistic Std. Error
Systolic(mmHg) Female Mean 132.15 1.749
95% Confidence Interval for
Mean
Lower Bound 128.55
Upper Bound 135.76
5% Trimmed Mean 131.77
Median 132.50
Variance 79.495
Std. Deviation 8.916
Minimum 114
Maximum 160
Range 46
Interquartile Range 12
Skewness .838 .456
Kurtosis 2.845 .887
Male Mean 133.33 1.719
95% Confidence Interval for
Mean
Lower Bound 129.78
Upper Bound 136.89
5% Trimmed Mean 133.13
Median 133.50
Variance 70.928
Std. Deviation 8.422

Minimum 117
Maximum 154
Range 37
Interquartile Range 12
Skewness .270 .472
Kurtosis .416 .918
Diastolic(mmHg) Female Mean 81.69 1.085
95% Confidence Interval for
Mean
Lower Bound 79.46
Upper Bound 83.93
5% Trimmed Mean 82.07
Median 83.50
Variance 30.622
Std. Deviation 5.534
Minimum 68
Maximum 89
Range 21
Interquartile Range 5
Skewness -1.509 .456
Kurtosis 1.769 .887
Male Mean 82.67 1.304
95% Confidence Interval for
Mean
Lower Bound 79.97
Upper Bound 85.37
5% Trimmed Mean 82.85
Median 84.50
Variance 40.841
Std. Deviation 6.391
Minimum 71
Maximum 91
Range 20
Interquartile Range 9
Skewness -.750 .472
Kurtosis -.507 .918
Initial systolic blood pressure average for females is 132.15 mmHg and that of males is 133.33.
⊘ This is a preview!⊘
Do you want full access?
Subscribe today to unlock all pages.

Trusted by 1+ million students worldwide

The initial diastolic blood pressure average of females is 81.69 while that of males is 82.67
Tests for normality
Tests of Normality
Gender
Kolmogorov-Smirnova Shapiro-Wilk
Statistic df Sig. Statistic df Sig.
Systolic(mmHg) Female .122 26 .200* .939 26 .128
Male .098 24 .200* .986 24 .974
*. This is a lower bound of the true significance.
a. Lilliefors Significance Correction
It can be shown that the gender data for both male and female are normally distributed.
Effect of age on blood pressure
ANOVA Table
Sum of
Squares df
Mean
Square F Sig.
Systolic(mmHg) *
Age(years)
Between
Groups
(Combined) 2558.580 26 98.407 2.101 .038
Linearity 1643.266 1 1643.266 35.077 .000
Deviation from
Linearity 915.314 25 36.613 .782 .727
Within Groups 1077.500 23 46.848
Total 3636.080 49
ANOVA analysis on age and systolic blood pressure before exercise has a p-value of 0.038
which is less than 0.05 suggesting that at the 5% level of significance we fail to reject the null
hypothesis and conclude that there is no significant effect of age on systolic blood pressure.
Paraphrase This Document
Need a fresh take? Get an instant paraphrase of this document with our AI Paraphraser

ANOVA Table
Sum of
Squares df
Mean
Square F Sig.
Diastolic(mmHg) *
Age(years)
Between
Groups
(Combined) 1111.553 26 42.752 1.625 .122
Linearity 97.756 1 97.756 3.715 .066
Deviation from
Linearity 1013.798 25 40.552 1.541 .150
Within Groups 605.167 23 26.312
Total 1716.720 49
ANOVA analysis on age and diastolic blood pressure before exercise has a p-value of 0.122
which is greater than 0.05 suggesting that at the 5% level of significance we reject the null
hypothesis in favour of the alternative and conclude that age has a significant effect on diastolic
blood pressure.
However, it shall normally be expected that age impacts positively on blood pressure. As people
get older, blood pressure rises.
Effect of gender on blood pressure
ANOVA Tablea
Sum of
Squares df Mean Square F Sig.
Systolic(mmHg) *
Gender
Between
Groups
(Combined) 17.362 1 17.362 .230 .633
Sum of
Squares df
Mean
Square F Sig.
Diastolic(mmHg) *
Age(years)
Between
Groups
(Combined) 1111.553 26 42.752 1.625 .122
Linearity 97.756 1 97.756 3.715 .066
Deviation from
Linearity 1013.798 25 40.552 1.541 .150
Within Groups 605.167 23 26.312
Total 1716.720 49
ANOVA analysis on age and diastolic blood pressure before exercise has a p-value of 0.122
which is greater than 0.05 suggesting that at the 5% level of significance we reject the null
hypothesis in favour of the alternative and conclude that age has a significant effect on diastolic
blood pressure.
However, it shall normally be expected that age impacts positively on blood pressure. As people
get older, blood pressure rises.
Effect of gender on blood pressure
ANOVA Tablea
Sum of
Squares df Mean Square F Sig.
Systolic(mmHg) *
Gender
Between
Groups
(Combined) 17.362 1 17.362 .230 .633

Within Groups 3618.718 48 75.390
Total 3636.080 49
a. The grouping variable Gender is a string, so the test for linearity cannot be computed.
Measures of Association
Eta Eta Squared
Systolic(mmHg) * Gender .069 .005
ANOVA analysis carried out on gender and systolic blood pressure has a p-value of 0.633 which
is greater than 0.05 and 0.069 measure of association. We reject the null hypothesis in favor of
the null and conclude that there is significant impact of gender on systolic blood pressure.
ANOVA Tablea
Sum of
Squares df Mean Square F Sig.
Diastolic(mmHg) *
Gender
Between
Groups
(Combined) 11.848 1 11.848 .334 .566
Within Groups 1704.872 48 35.518
Total 1716.720 49
a. The grouping variable Gender is a string, so the test for linearity cannot be computed.
Measures of Association
Eta Eta Squared
Diastolic(mmHg) * Gender .083 .007
ANOVA analysis on gender and diastolic blood pressure has a p-value of 0.566 which is greater
than 0.05 and 0.083 measure of association. We reject the null hypothesis in favor of the
alternative and conclude that there is significant impact of gender on diastolic blood pressure.
⊘ This is a preview!⊘
Do you want full access?
Subscribe today to unlock all pages.

Trusted by 1+ million students worldwide
1 out of 16
Related Documents
Your All-in-One AI-Powered Toolkit for Academic Success.
 +13062052269
info@desklib.com
Available 24*7 on WhatsApp / Email
Unlock your academic potential
Copyright © 2020–2025 A2Z Services. All Rights Reserved. Developed and managed by ZUCOL.


