PSYC2001 Statistics Report: Analysis of Dietary Fat Intake by Gender
VerifiedAdded on 2022/09/24
|7
|1273
|20
Report
AI Summary
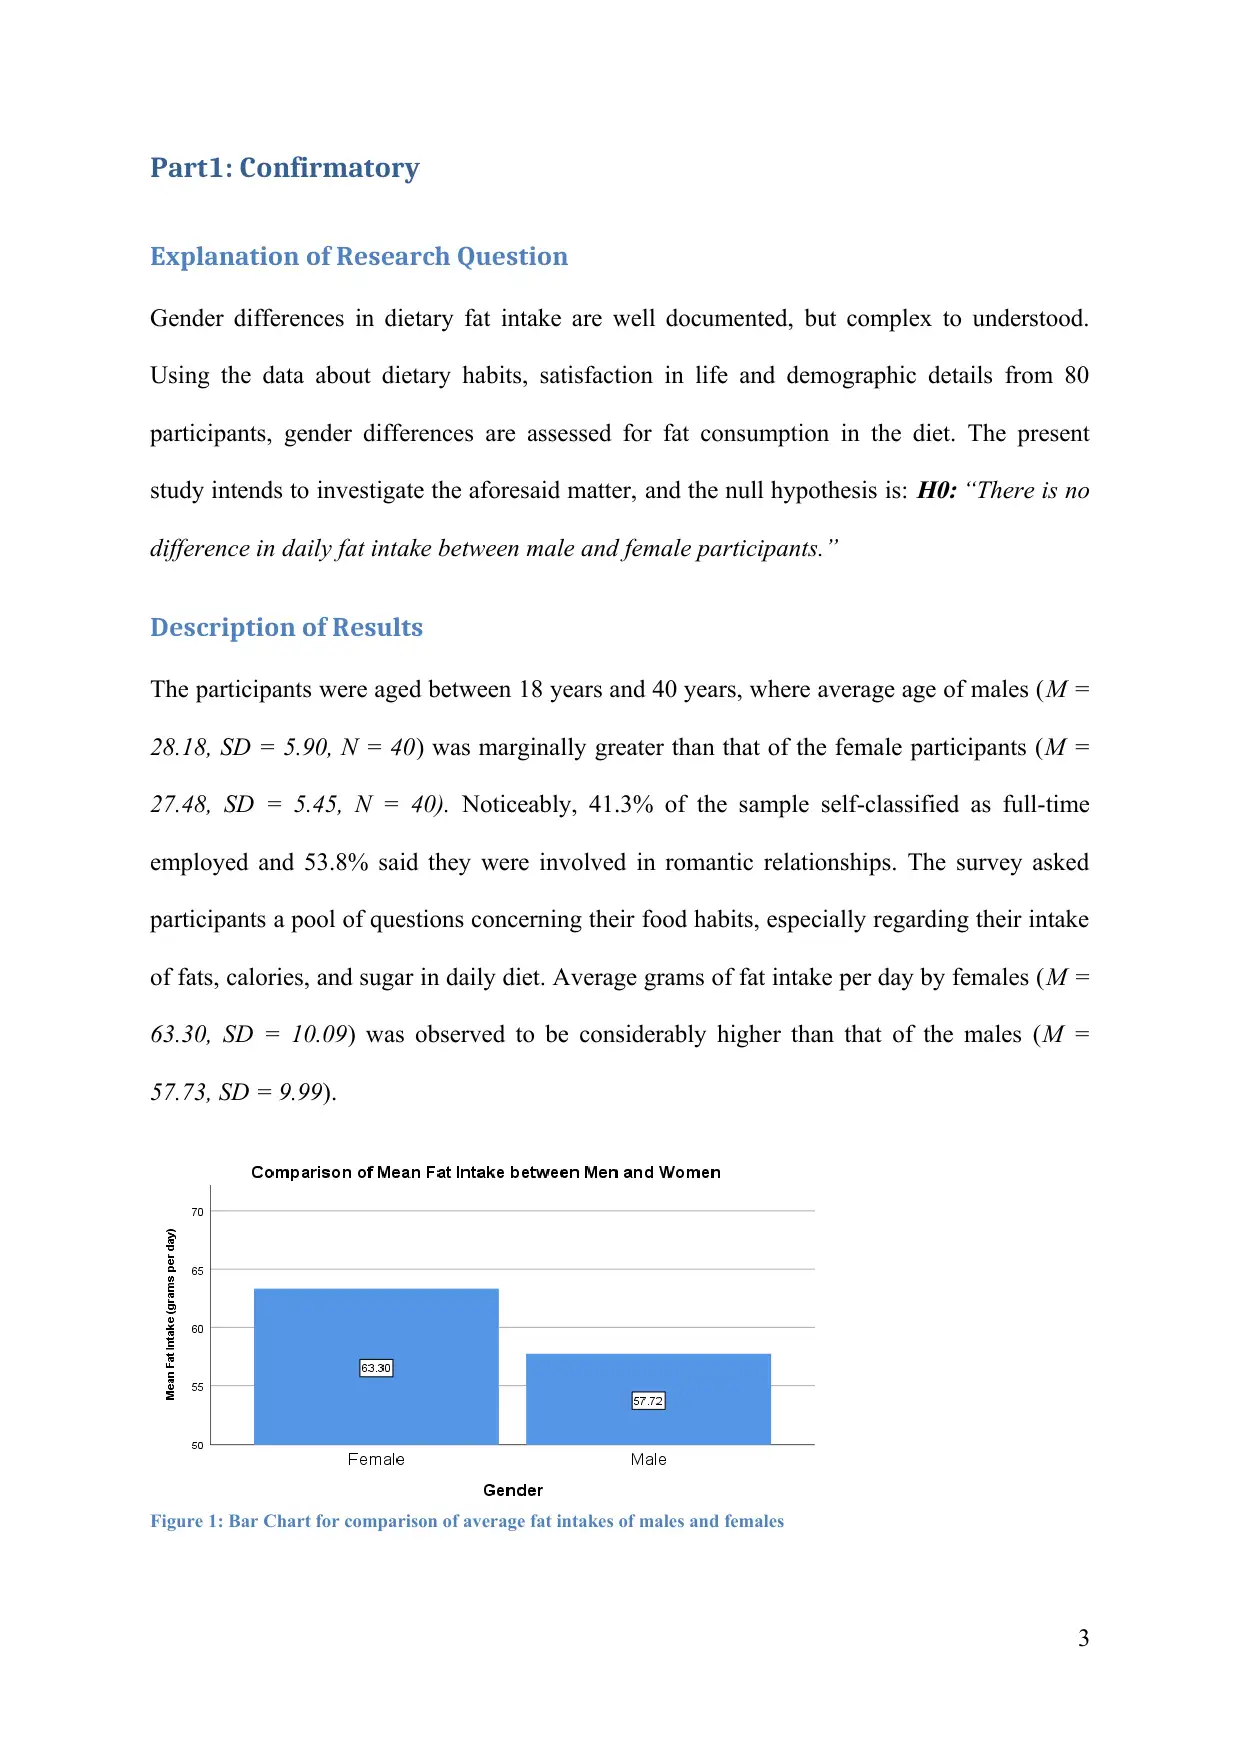
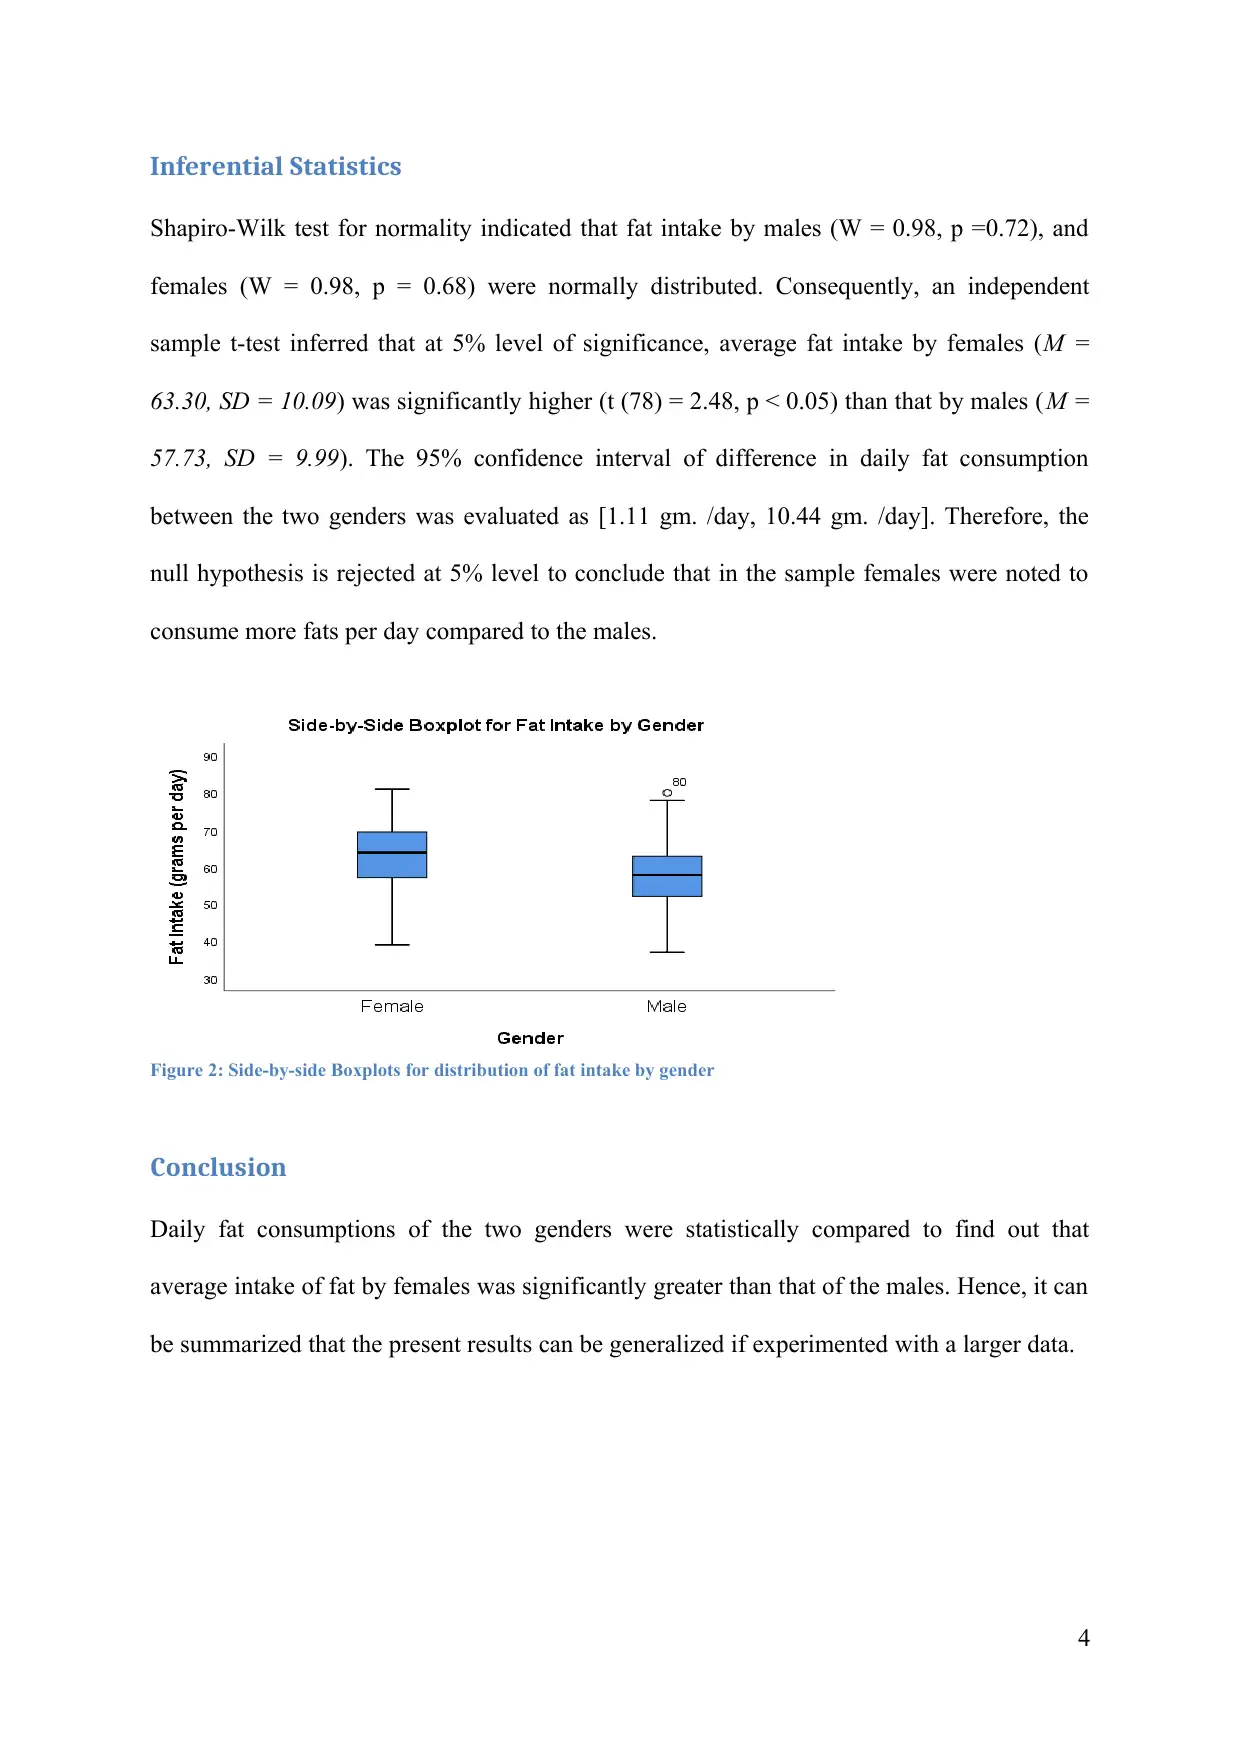
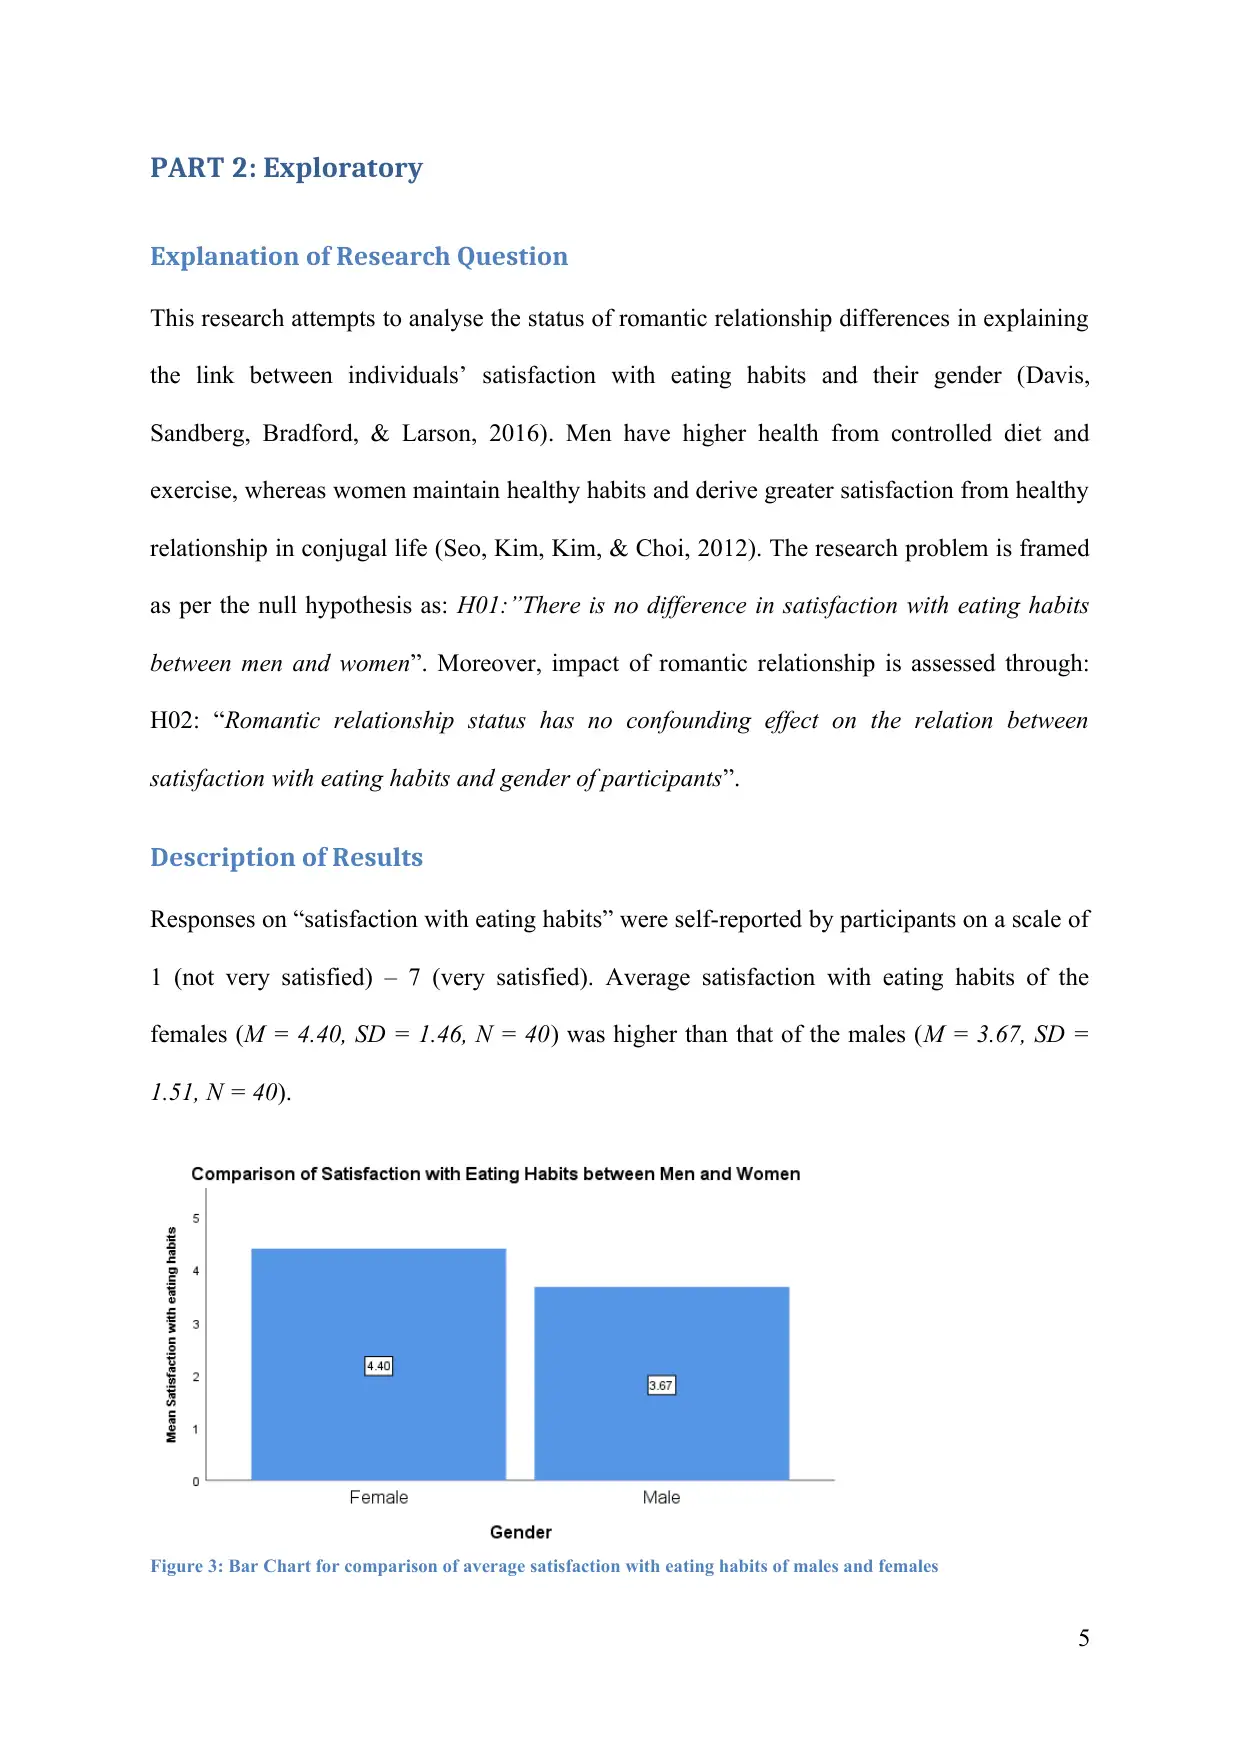
This report, submitted for PSYC2001, presents a statistical analysis of gender differences in dietary fat intake. The study investigates the null hypothesis that there is no difference in daily fat intake between male and female participants. The results section details the demographics of the 80 participants, revealing that females consumed significantly more fat per day than males. The report utilizes an independent sample t-test and includes a Shapiro-Wilk test for normality. Furthermore, an exploratory analysis examines the impact of romantic relationship status on the relationship between gender and satisfaction with eating habits. The findings indicate that females generally reported higher satisfaction with their eating habits compared to males. The conclusions summarize the key findings, highlighting the statistical significance of the observed differences and the potential for generalizing the results to a larger population, particularly when accounting for romantic relationships.

PSYC2001 : STATISTICS
1
1
Paraphrase This Document
Need a fresh take? Get an instant paraphrase of this document with our AI Paraphraser

Table of Contents
Part1: Confirmatory...................................................................................................................3
Explanation of Research Question.........................................................................................3
Description of Results............................................................................................................3
Inferential Statistics................................................................................................................4
Conclusion..............................................................................................................................4
PART 2: Exploratory.................................................................................................................5
Explanation of Research Question.........................................................................................5
Description of Results............................................................................................................5
Inferential Statistics................................................................................................................6
Conclusion..............................................................................................................................6
References..................................................................................................................................7
2

Part1: Confirmatory
Explanation of Research Question
Gender differences in dietary fat intake are well documented, but complex to understood.
Using the data about dietary habits, satisfaction in life and demographic details from 80
participants, gender differences are assessed for fat consumption in the diet. The present
study intends to investigate the aforesaid matter, and the null hypothesis is:
H0: “There is no
difference in daily fat intake between male and female participants.”
Description of Results
The participants were aged between 18 years and 40 years, where average age of males (M =
28.18, SD = 5.90, N = 40) was marginally greater than that of the female participants (M =
27.48, SD = 5.45, N = 40). Noticeably, 41.3% of the sample self-classified as full-time
employed and 53.8% said they were involved in romantic relationships. The survey asked
participants a pool of questions concerning their food habits, especially regarding their intake
of fats, calories, and sugar in daily diet. Average grams of fat intake per day by females (M =
63.30, SD = 10.09) was observed to be considerably higher than that of the males (M =
57.73, SD = 9.99).
Figure 1: Bar Chart for comparison of average fat intakes of males and females
3
⊘ This is a preview!⊘
Do you want full access?
Subscribe today to unlock all pages.

Trusted by 1+ million students worldwide

Inferential Statistics
Shapiro-Wilk test for normality indicated that fat intake by males (W = 0.98, p =0.72), and
females (W = 0.98, p = 0.68) were normally distributed. Consequently, an independent
sample t-test inferred that at 5% level of significance, average fat intake by females (M =
63.30, SD = 10.09) was significantly higher (t (78) = 2.48, p < 0.05) than that by males (M =
57.73, SD = 9.99). The 95% confidence interval of difference in daily fat consumption
between the two genders was evaluated as [1.11 gm. /day, 10.44 gm. /day]. Therefore, the
null hypothesis is rejected at 5% level to conclude that in the sample females were noted to
consume more fats per day compared to the males.
Figure 2: Side-by-side Boxplots for distribution of fat intake by gender
Conclusion
Daily fat consumptions of the two genders were statistically compared to find out that
average intake of fat by females was significantly greater than that of the males. Hence, it can
be summarized that the present results can be generalized if experimented with a larger data.
4
Paraphrase This Document
Need a fresh take? Get an instant paraphrase of this document with our AI Paraphraser

PART 2: Exploratory
Explanation of Research Question
This research attempts to analyse the status of romantic relationship differences in explaining
the link between individuals’ satisfaction with eating habits and their gender (Davis,
Sandberg, Bradford, & Larson, 2016). Men have higher health from controlled diet and
exercise, whereas women maintain healthy habits and derive greater satisfaction from healthy
relationship in conjugal life (Seo, Kim, Kim, & Choi, 2012). The research problem is framed
as per the null hypothesis as: H01:”There is no difference in satisfaction with eating habits
between men and women”. Moreover, impact of romantic relationship is assessed through:
H02: “Romantic relationship status has no confounding effect on the relation between
satisfaction with eating habits and gender of participants”.
Description of Results
Responses on “satisfaction with eating habits” were self-reported by participants on a scale of
1 (not very satisfied) – 7 (very satisfied). Average satisfaction with eating habits of the
females (M = 4.40, SD = 1.46, N = 40) was higher than that of the males (M = 3.67, SD =
1.51, N = 40).
Figure 3: Bar Chart for comparison of average satisfaction with eating habits of males and females
5

Average “satisfaction with eating habits” for females not in a romantic relation (M = 4.45,
SD = 1.32, N = 20) was still higher than that of the males (M = 3.41, SD = 1.37, N = 17).
Similarly, average “satisfaction with eating habits” for females in a romantic relation (M =
4.35, SD = 1.63, N = 20) was higher than that of the males (M = 3.87, SD = 1.60, N = 23).
Inferential Statistics
An independent sample t-test confirmed that there existed a statistically significant difference
(t (78) = 2.18, p < 0.05) between average satisfaction with eating habits of males (M = 3.67,
SD = 1.51) and females (M = 4.40, SD = 1.46). Hence, the null hypothesis H01 was rejected
at 5% level of significance.
Subsequently, romantic relation status of the participants was introduced, and two
independent t-tests were performed for comparing average satisfaction scores between the
two genders. There existed a significant difference (t(35) = 2.34, p < 0.05) between average
satisfaction scores of males and females, in case of participants not involved in a romantic
relation. However, no such statistical difference (t(41) = 0.97, p = 0.34) was noted in case of
participants involved in romantic relations.
Conclusion
Generally, females were found significantly more satisfied with their eating habits compared
to that of the males. This comparison stood its ground in case of the participants who were
not involved in a romantic relation, however there was no such difference in case of
participants in romantic relationship. Provided that sample size was considerably large
enough for statistical validity, the present results can be generalized. It can be concluded that
both the genders were equally pleased with their eating practices once they were in a
romantic relation (Conklin et al., 2014).
6
⊘ This is a preview!⊘
Do you want full access?
Subscribe today to unlock all pages.

Trusted by 1+ million students worldwide

References
Conklin, A. I., Forouhi, N. G., Surtees, P., Khaw, K. T., Wareham, N. J., & Monsivais, P.
(2014). Social relationships and healthful dietary behaviour: evidence from over-50s
in the EPIC cohort, UK. Social science & medicine, 100, 167-175.
Davis, S. Y., Sandberg, J. G., Bradford, A. B., & Larson, J. H. (2016). Gender differences in
couple attachment behaviors as predictors of dietary habits and physical activity
levels. Journal of health psychology, 21(12), 3048-3059.
Seo, Y. J., Kim, M. H., Kim, M. H., & Choi, M. K. (2012). Status and relationships among
lifestyle, food habits, and stress scores of adults in Chungnam. Korean Journal of
Community Nutrition, 17(5), 579-588.
7
1 out of 7

Your All-in-One AI-Powered Toolkit for Academic Success.
+13062052269
info@desklib.com
Available 24*7 on WhatsApp / Email
Unlock your academic potential
Copyright © 2020–2025 A2Z Services. All Rights Reserved. Developed and managed by ZUCOL.