BUS708: Statistical Analysis of Gender-Based Income Disparity Report

Verified

Added on  2021/06/17

|8
|1388
|88
Report
AI Summary
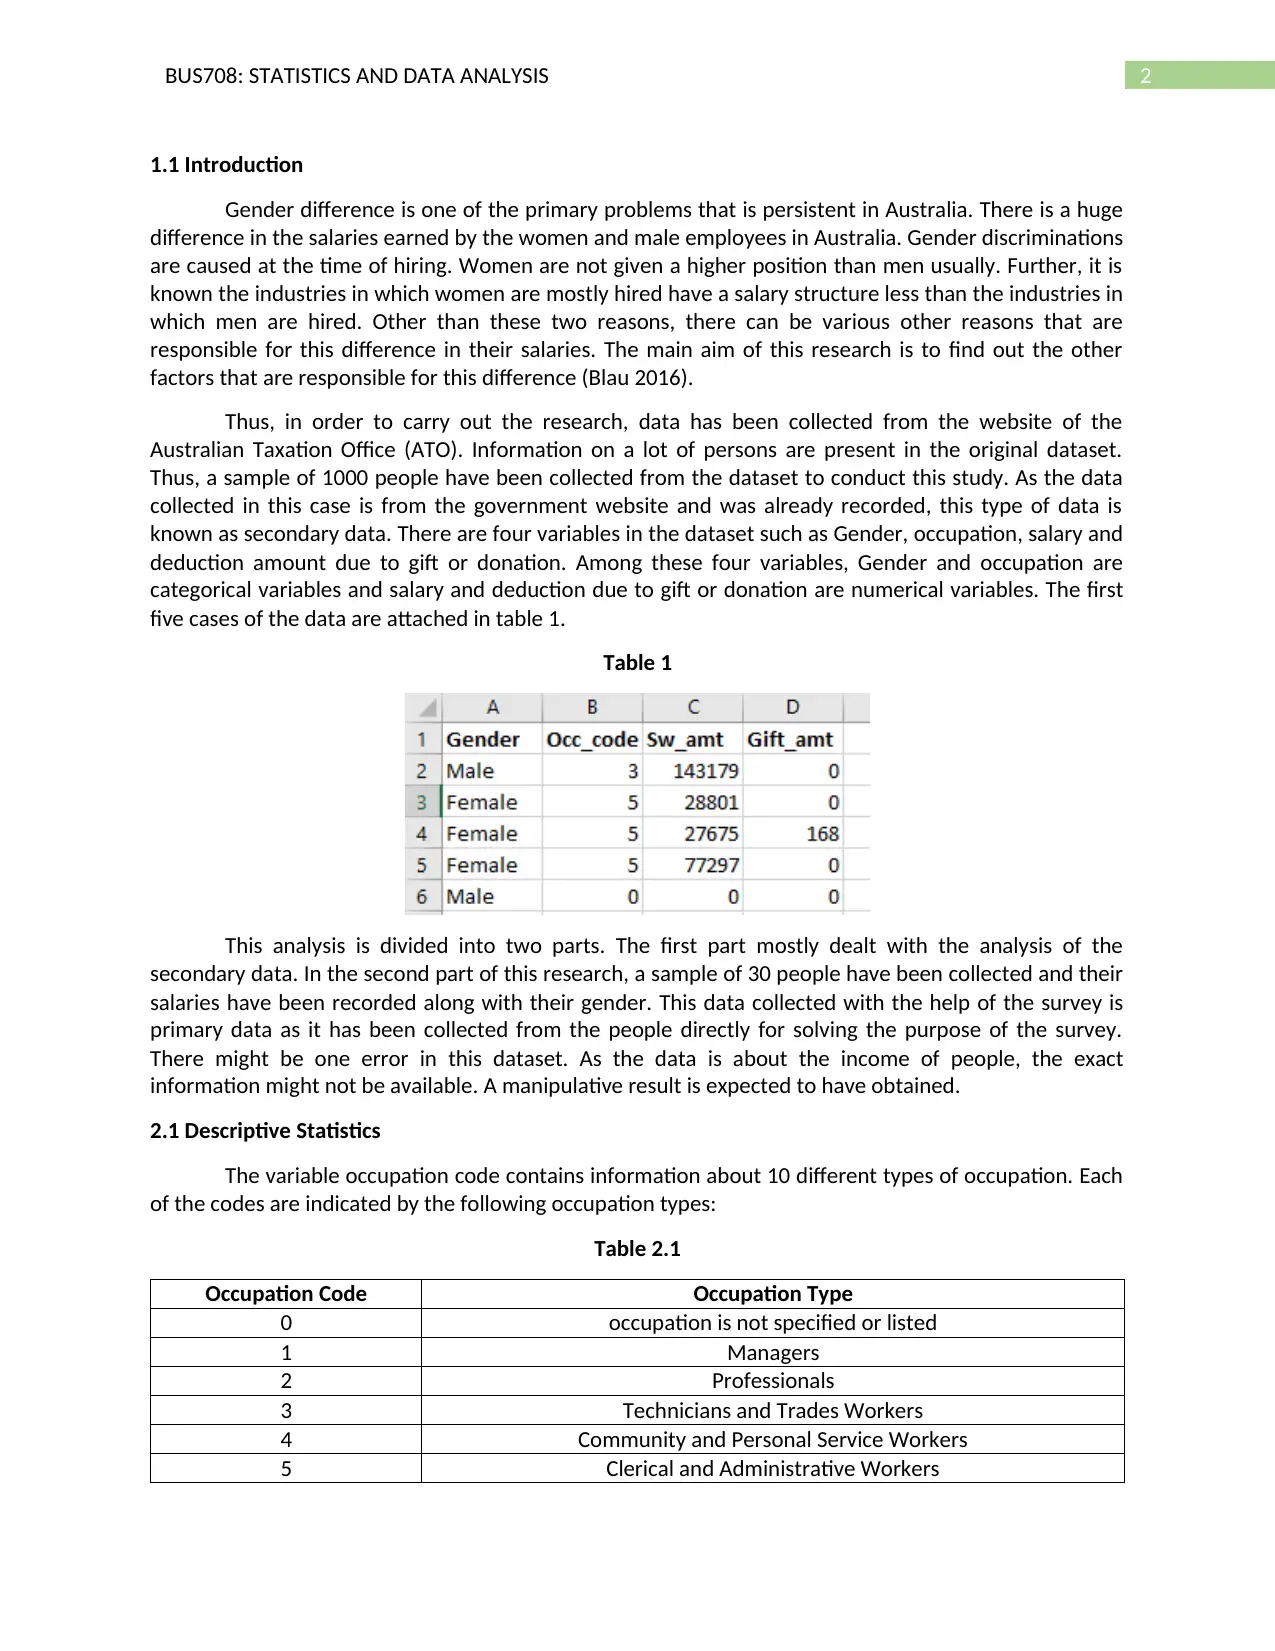
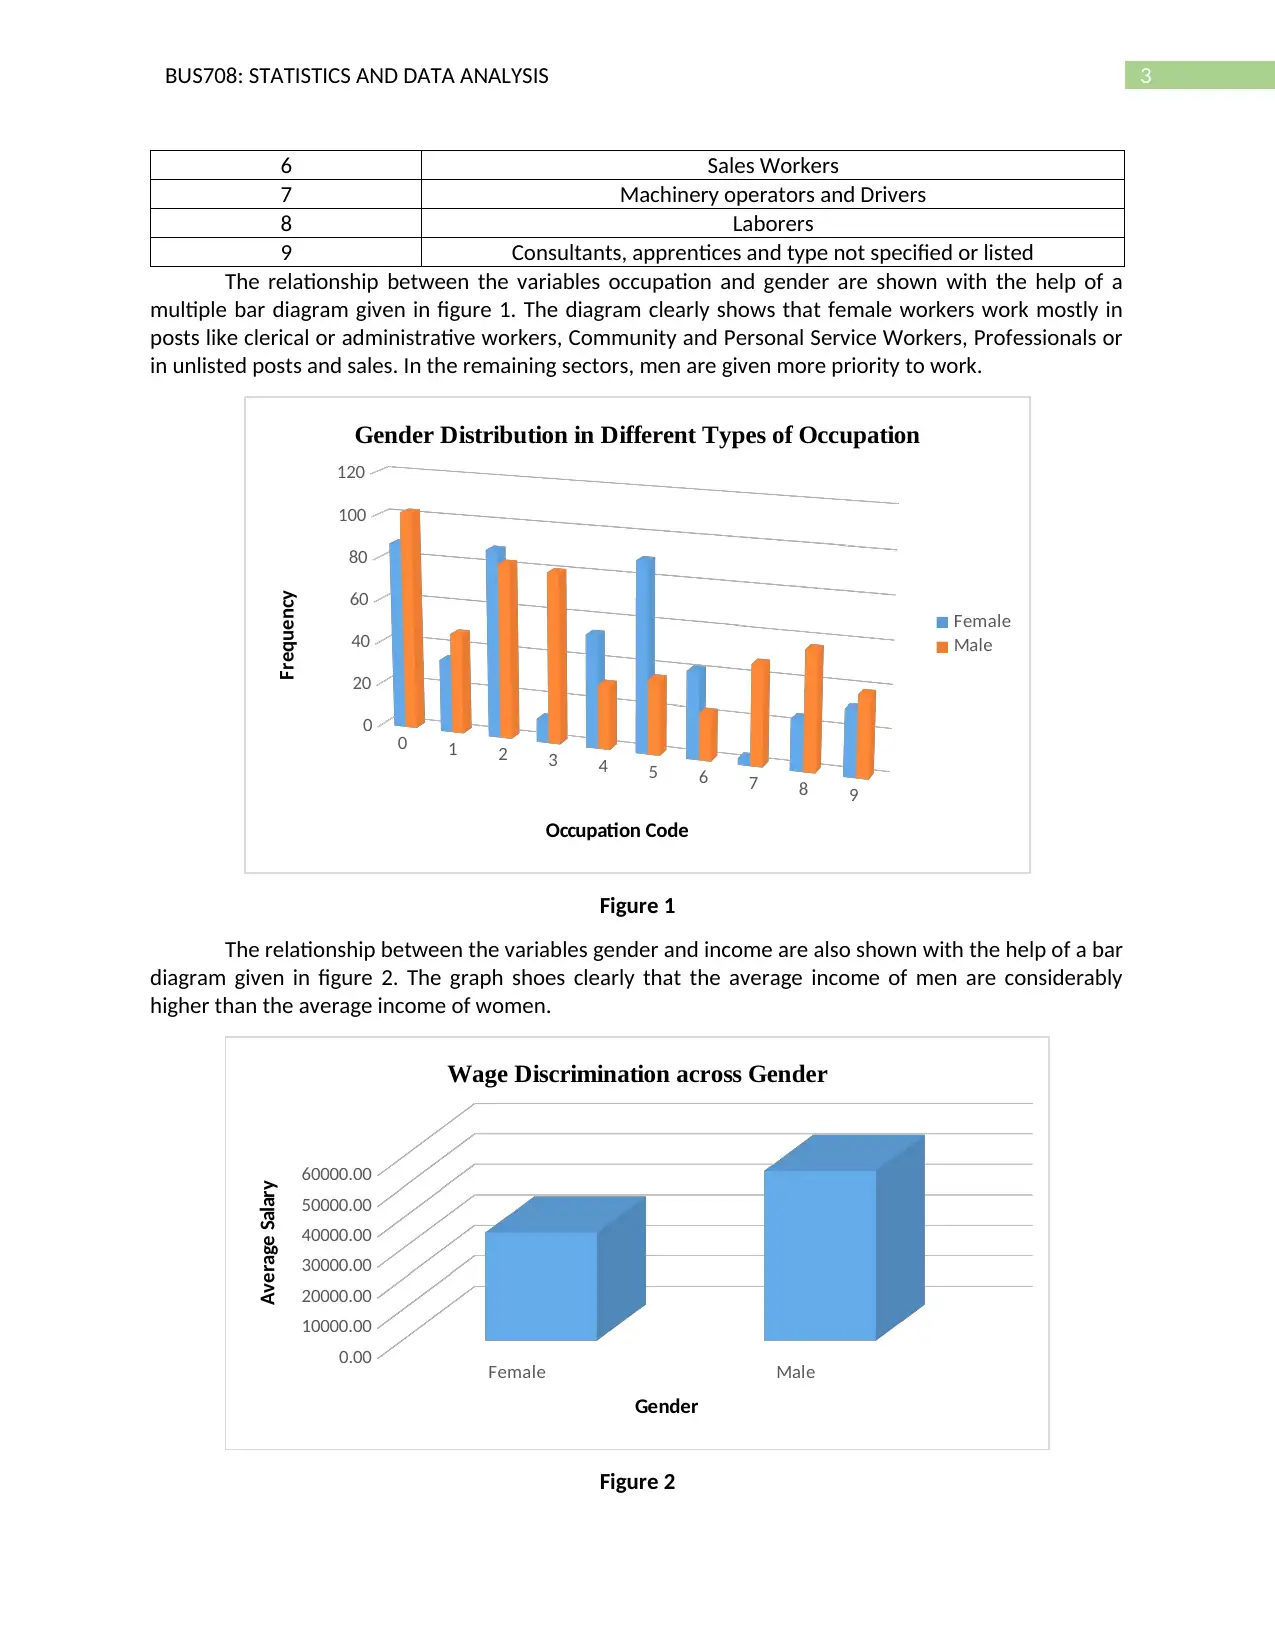
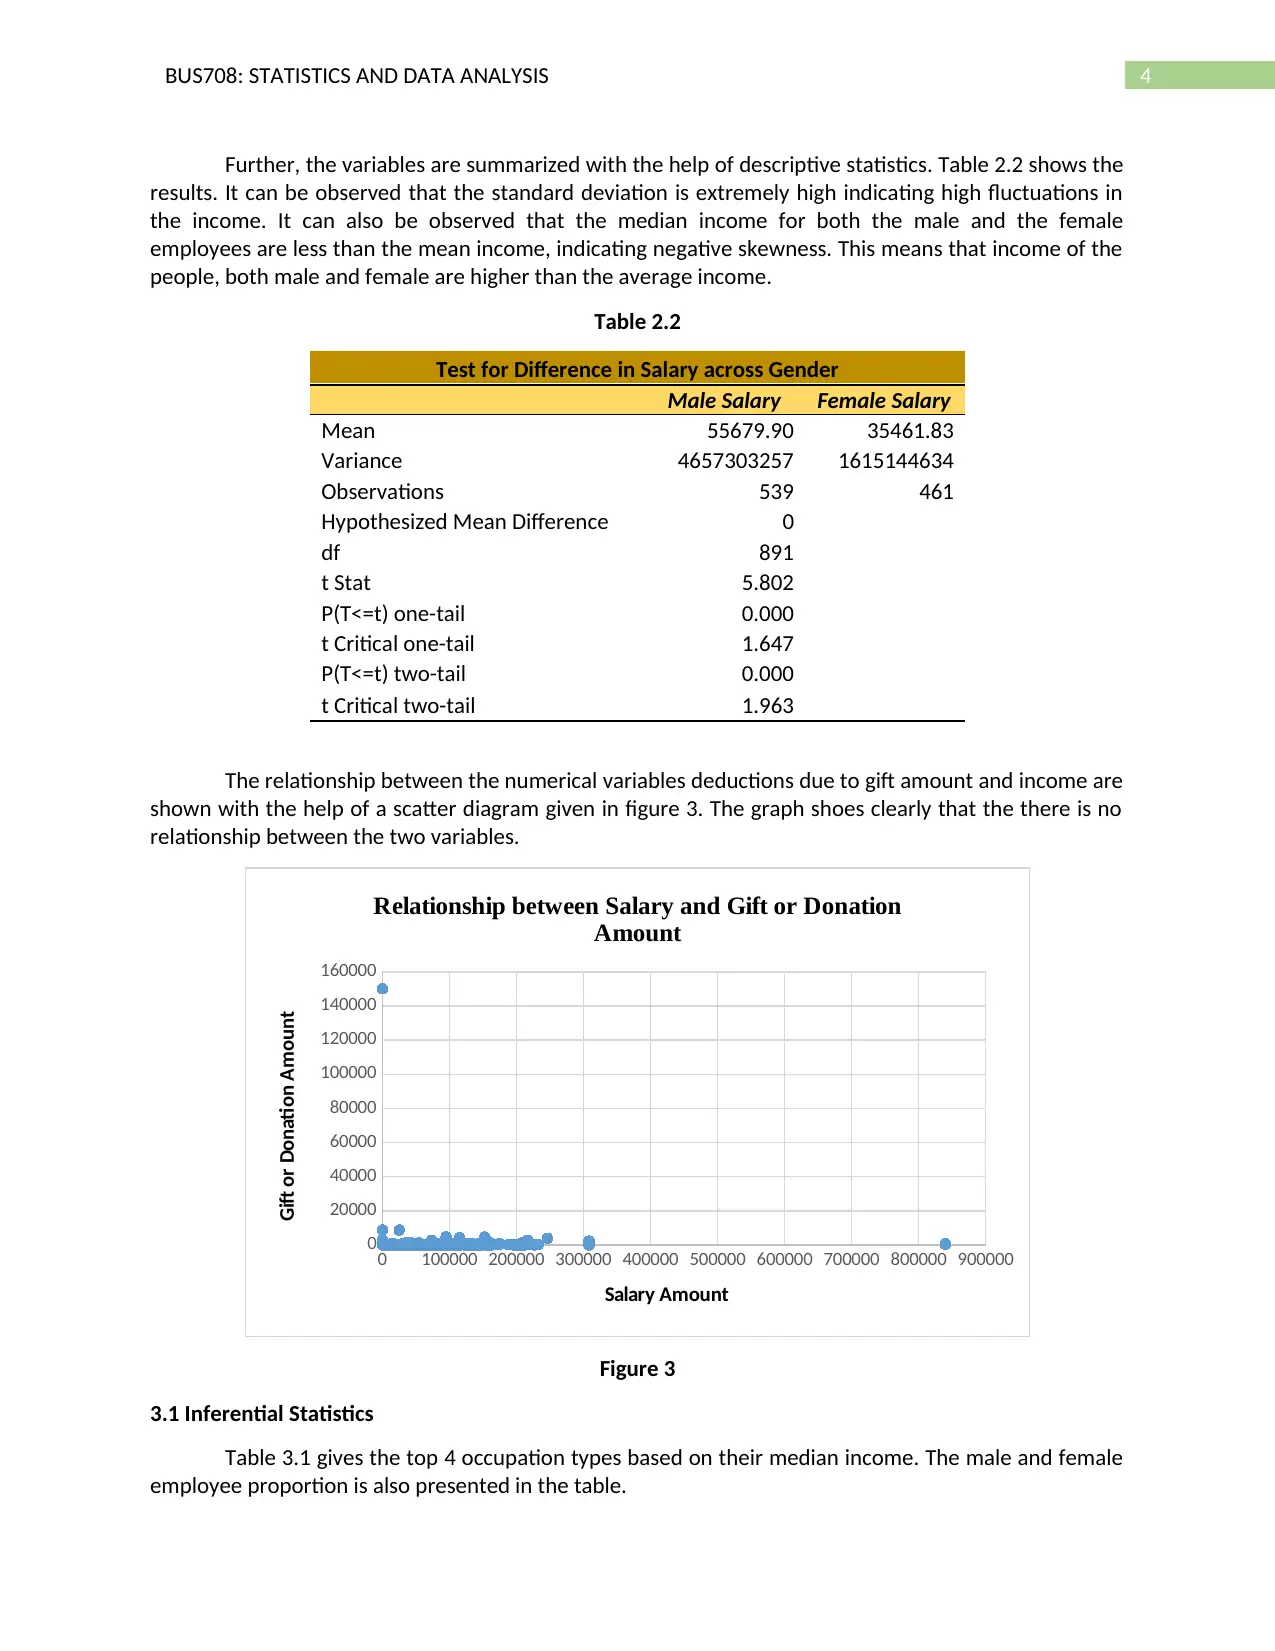
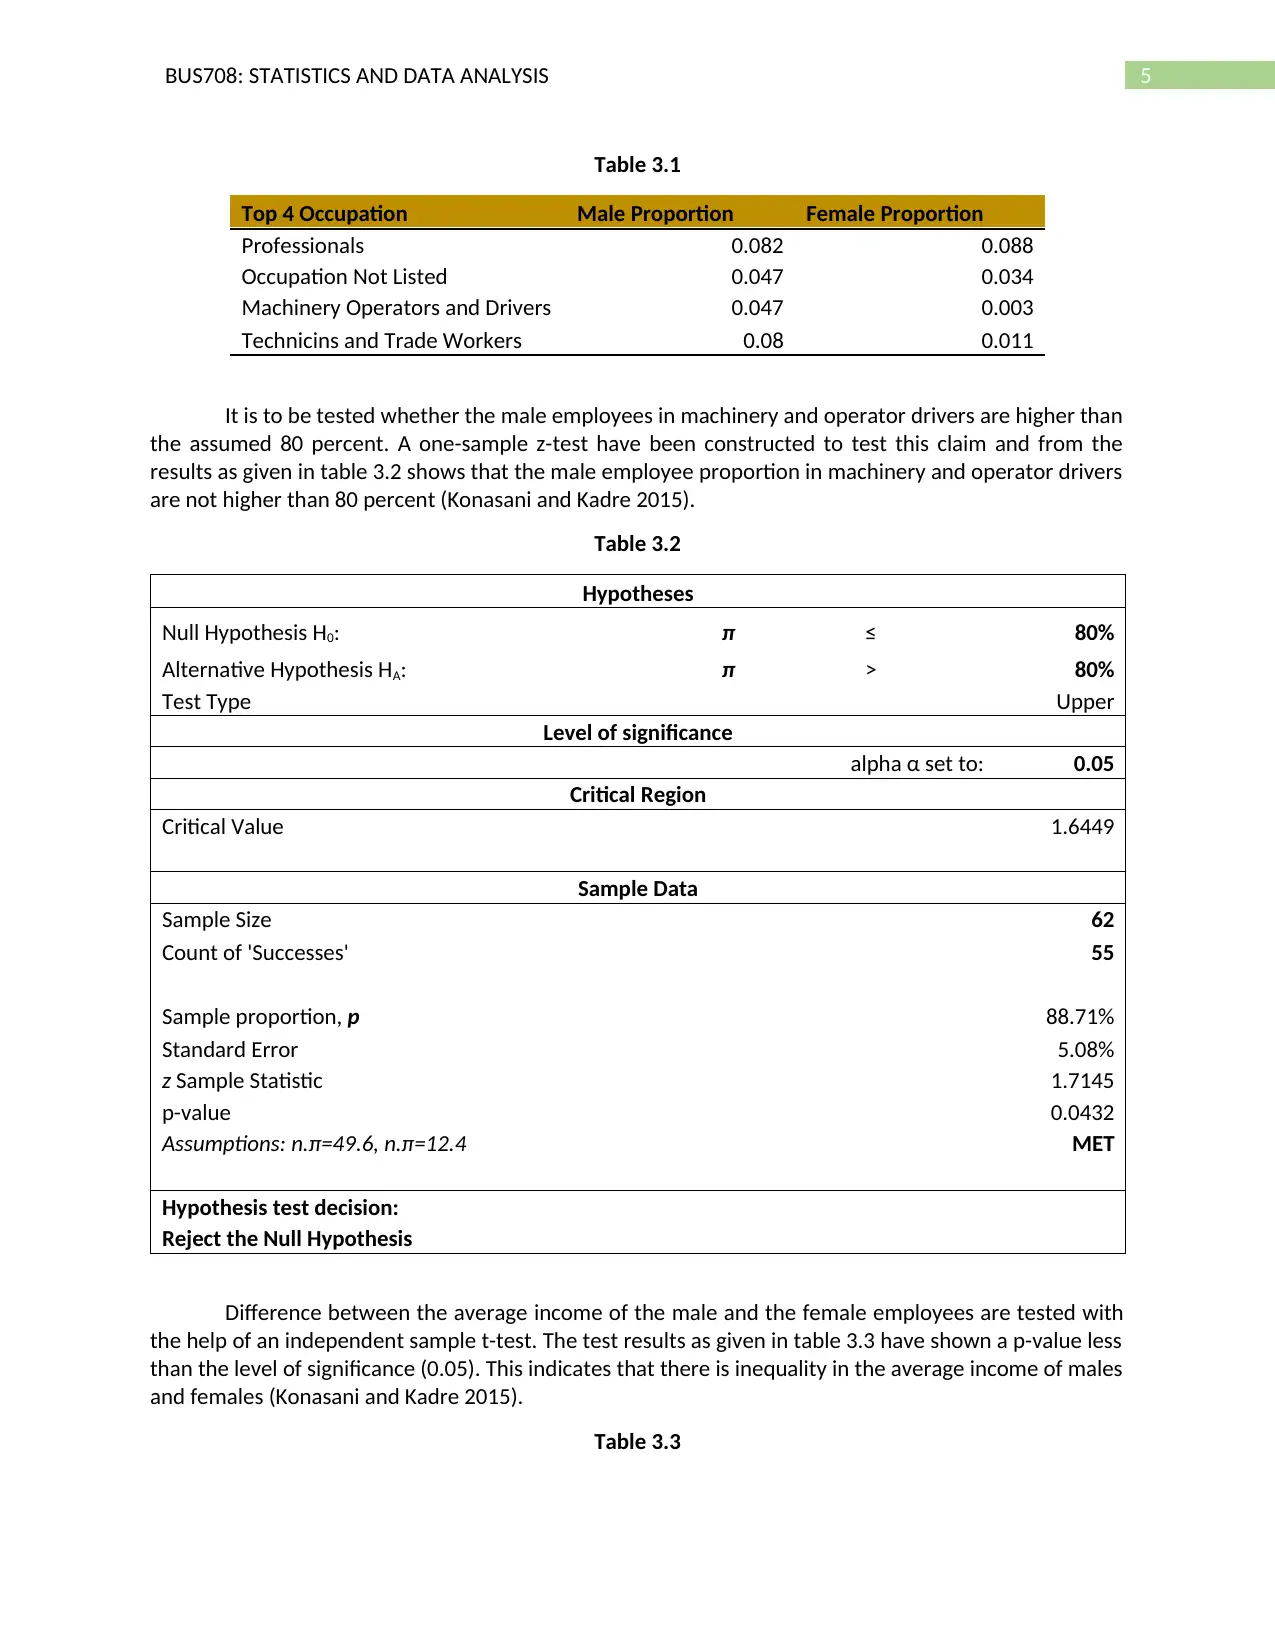
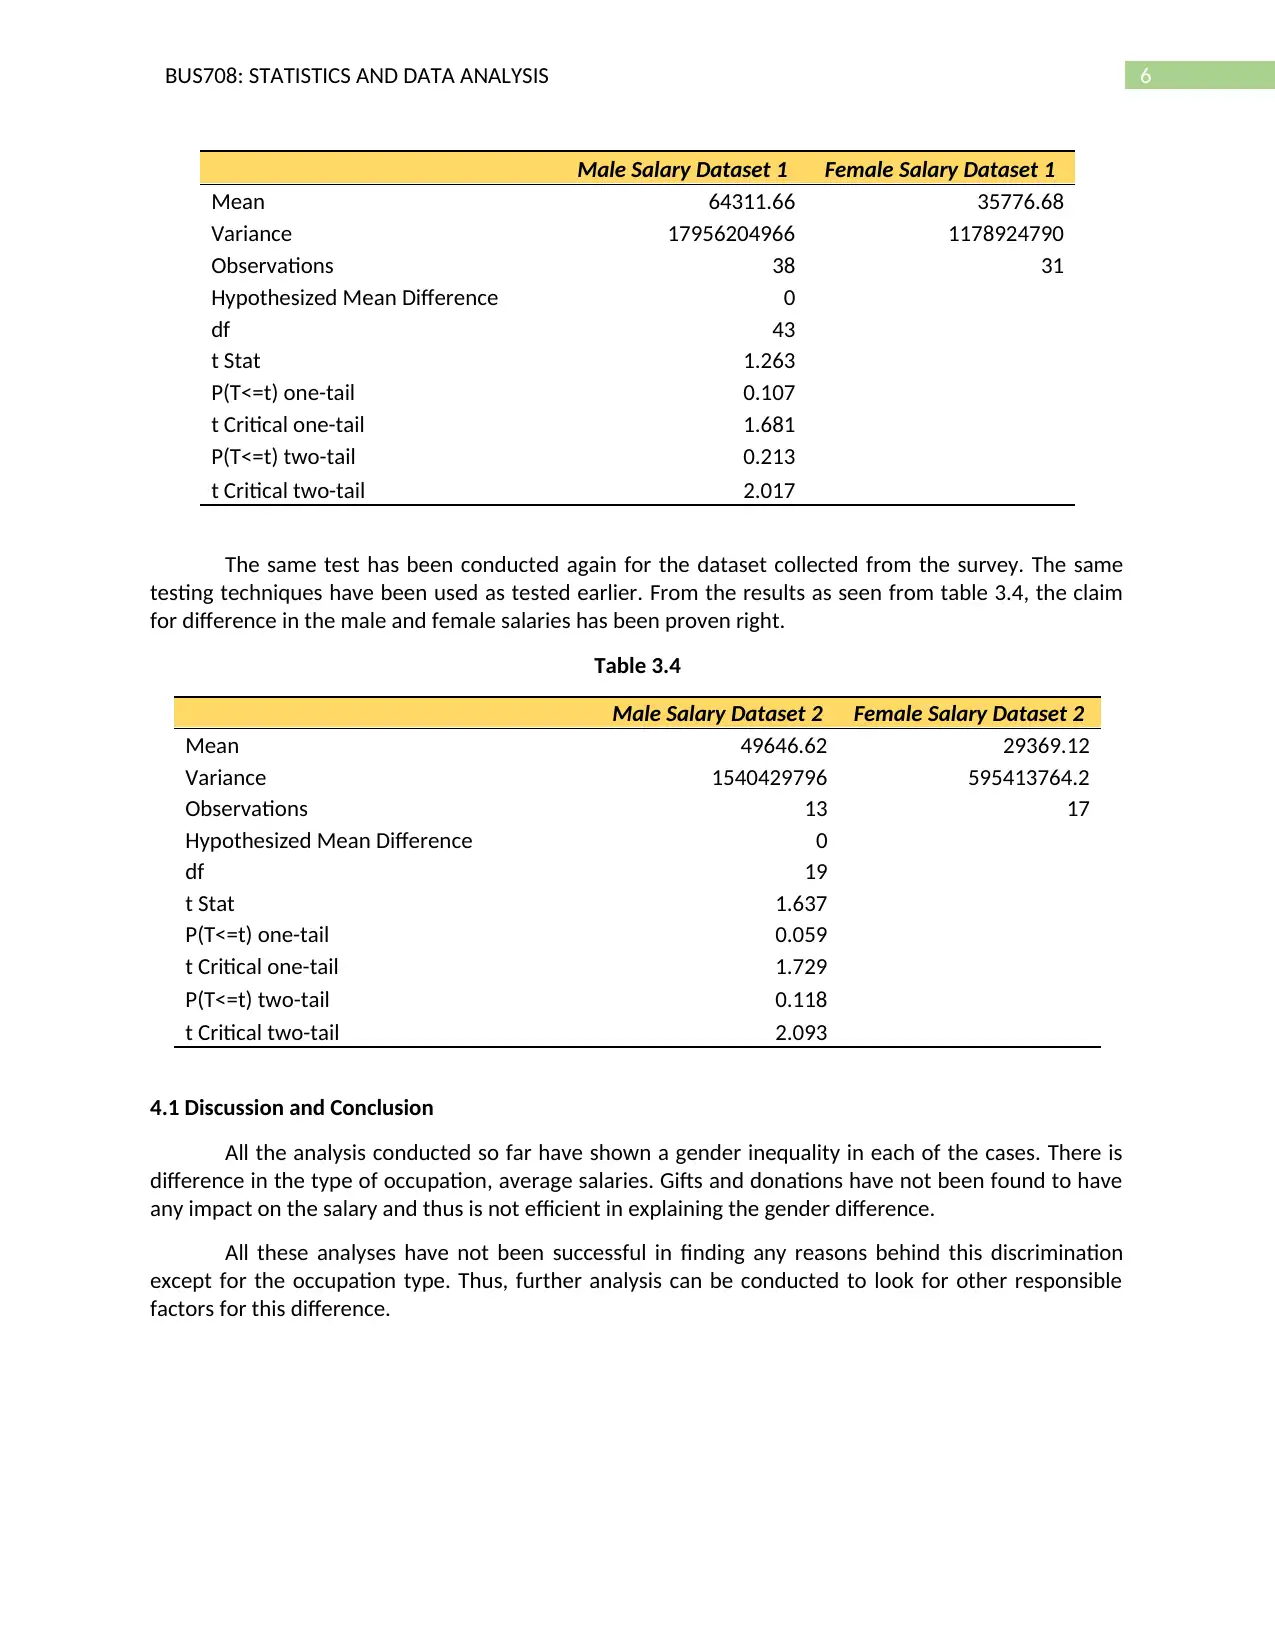
This report provides a statistical analysis of gender-based income disparities in Australia. The study utilizes secondary data from the Australian Taxation Office (ATO) and primary data collected through a survey. The analysis includes descriptive statistics, such as mean, variance, and median, to summarize the data and identify trends. Inferential statistics, including t-tests and z-tests, are employed to test hypotheses regarding income differences between genders and across different occupations. The findings reveal a significant gender pay gap, with men generally earning more than women, and highlight disparities in occupation types. The research concludes by emphasizing the need for further investigation into the underlying factors contributing to this income inequality, and by acknowledging the limitations of the study. The report also includes tables and figures to visually represent the data and the analysis results.
Document Page
Running Head: BUS708 – STATISTICS AND DATA ANALYSIS
BUS708
Statistics and Data Analysis
Name of the Student
Name of the University
Student ID
tabler-icon-diamond-filled.svg

Paraphrase This Document

Need a fresh take? Get an instant paraphrase of this document with our AI Paraphraser
Document Page
1BUS708: STATISTICS AND DATA ANALYSIS
Table of Contents
1.1 Introduction...........................................................................................................................................2
2.1 Descriptive Statistics..............................................................................................................................2
3.1 Inferential Statistics...............................................................................................................................4
4.1 Discussion and Conclusion.....................................................................................................................6
References...................................................................................................................................................7
Document Page
2BUS708: STATISTICS AND DATA ANALYSIS
1.1 Introduction
Gender difference is one of the primary problems that is persistent in Australia. There is a huge
difference in the salaries earned by the women and male employees in Australia. Gender discriminations
are caused at the time of hiring. Women are not given a higher position than men usually. Further, it is
known the industries in which women are mostly hired have a salary structure less than the industries in
which men are hired. Other than these two reasons, there can be various other reasons that are
responsible for this difference in their salaries. The main aim of this research is to find out the other
factors that are responsible for this difference (Blau 2016).
Thus, in order to carry out the research, data has been collected from the website of the
Australian Taxation Office (ATO). Information on a lot of persons are present in the original dataset.
Thus, a sample of 1000 people have been collected from the dataset to conduct this study. As the data
collected in this case is from the government website and was already recorded, this type of data is
known as secondary data. There are four variables in the dataset such as Gender, occupation, salary and
deduction amount due to gift or donation. Among these four variables, Gender and occupation are
categorical variables and salary and deduction due to gift or donation are numerical variables. The first
five cases of the data are attached in table 1.
Table 1
This analysis is divided into two parts. The first part mostly dealt with the analysis of the
secondary data. In the second part of this research, a sample of 30 people have been collected and their
salaries have been recorded along with their gender. This data collected with the help of the survey is
primary data as it has been collected from the people directly for solving the purpose of the survey.
There might be one error in this dataset. As the data is about the income of people, the exact
information might not be available. A manipulative result is expected to have obtained.
2.1 Descriptive Statistics
The variable occupation code contains information about 10 different types of occupation. Each
of the codes are indicated by the following occupation types:
Table 2.1
Occupation Code Occupation Type
0 occupation is not specified or listed
1 Managers
2 Professionals
3 Technicians and Trades Workers
4 Community and Personal Service Workers
5 Clerical and Administrative Workers
Document Page
3BUS708: STATISTICS AND DATA ANALYSIS
6 Sales Workers
7 Machinery operators and Drivers
8 Laborers
9 Consultants, apprentices and type not specified or listed
The relationship between the variables occupation and gender are shown with the help of a
multiple bar diagram given in figure 1. The diagram clearly shows that female workers work mostly in
posts like clerical or administrative workers, Community and Personal Service Workers, Professionals or
in unlisted posts and sales. In the remaining sectors, men are given more priority to work.
0 1 2 3 4 5 6 7 8 9
0
20
40
60
80
100
120
Gender Distribution in Different Types of Occupation
Female
Male
Occupation Code
Frequency
Figure 1
The relationship between the variables gender and income are also shown with the help of a bar
diagram given in figure 2. The graph shoes clearly that the average income of men are considerably
higher than the average income of women.
Female Male
0.00
10000.00
20000.00
30000.00
40000.00
50000.00
60000.00
Wage Discrimination across Gender
Gender
Average Salary
Figure 2
tabler-icon-diamond-filled.svg

Paraphrase This Document

Need a fresh take? Get an instant paraphrase of this document with our AI Paraphraser
Document Page
4BUS708: STATISTICS AND DATA ANALYSIS
Further, the variables are summarized with the help of descriptive statistics. Table 2.2 shows the
results. It can be observed that the standard deviation is extremely high indicating high fluctuations in
the income. It can also be observed that the median income for both the male and the female
employees are less than the mean income, indicating negative skewness. This means that income of the
people, both male and female are higher than the average income.
Table 2.2
Test for Difference in Salary across Gender
Male Salary Female Salary
Mean 55679.90 35461.83
Variance 4657303257 1615144634
Observations 539 461
Hypothesized Mean Difference 0
df 891
t Stat 5.802
P(T<=t) one-tail 0.000
t Critical one-tail 1.647
P(T<=t) two-tail 0.000
t Critical two-tail 1.963
The relationship between the numerical variables deductions due to gift amount and income are
shown with the help of a scatter diagram given in figure 3. The graph shoes clearly that the there is no
relationship between the two variables.
0 100000 200000 300000 400000 500000 600000 700000 800000 900000
0
20000
40000
60000
80000
100000
120000
140000
160000
Relationship between Salary and Gift or Donation
Amount
Salary Amount
Gift or Donation Amount
Figure 3
3.1 Inferential Statistics
Table 3.1 gives the top 4 occupation types based on their median income. The male and female
employee proportion is also presented in the table.
Document Page
5BUS708: STATISTICS AND DATA ANALYSIS
Table 3.1
Top 4 Occupation Male Proportion Female Proportion
Professionals 0.082 0.088
Occupation Not Listed 0.047 0.034
Machinery Operators and Drivers 0.047 0.003
Technicins and Trade Workers 0.08 0.011
It is to be tested whether the male employees in machinery and operator drivers are higher than
the assumed 80 percent. A one-sample z-test have been constructed to test this claim and from the
results as given in table 3.2 shows that the male employee proportion in machinery and operator drivers
are not higher than 80 percent (Konasani and Kadre 2015).
Table 3.2
Hypotheses
Null Hypothesis H0: π 80%
Alternative Hypothesis HA: π > 80%
Test Type Upper
Level of significance
alpha α set to: 0.05
Critical Region
Critical Value 1.6449
Sample Data
Sample Size 62
Count of 'Successes' 55
Sample proportion, p 88.71%
Standard Error 5.08%
z Sample Statistic 1.7145
p-value 0.0432
Assumptions: n.π=49.6, n.π=12.4 MET
Hypothesis test decision:
Reject the Null Hypothesis
Difference between the average income of the male and the female employees are tested with
the help of an independent sample t-test. The test results as given in table 3.3 have shown a p-value less
than the level of significance (0.05). This indicates that there is inequality in the average income of males
and females (Konasani and Kadre 2015).
Table 3.3
Document Page
6BUS708: STATISTICS AND DATA ANALYSIS
Male Salary Dataset 1 Female Salary Dataset 1
Mean 64311.66 35776.68
Variance 17956204966 1178924790
Observations 38 31
Hypothesized Mean Difference 0
df 43
t Stat 1.263
P(T<=t) one-tail 0.107
t Critical one-tail 1.681
P(T<=t) two-tail 0.213
t Critical two-tail 2.017
The same test has been conducted again for the dataset collected from the survey. The same
testing techniques have been used as tested earlier. From the results as seen from table 3.4, the claim
for difference in the male and female salaries has been proven right.
Table 3.4
Male Salary Dataset 2 Female Salary Dataset 2
Mean 49646.62 29369.12
Variance 1540429796 595413764.2
Observations 13 17
Hypothesized Mean Difference 0
df 19
t Stat 1.637
P(T<=t) one-tail 0.059
t Critical one-tail 1.729
P(T<=t) two-tail 0.118
t Critical two-tail 2.093
4.1 Discussion and Conclusion
All the analysis conducted so far have shown a gender inequality in each of the cases. There is
difference in the type of occupation, average salaries. Gifts and donations have not been found to have
any impact on the salary and thus is not efficient in explaining the gender difference.
All these analyses have not been successful in finding any reasons behind this discrimination
except for the occupation type. Thus, further analysis can be conducted to look for other responsible
factors for this difference.
tabler-icon-diamond-filled.svg

Paraphrase This Document

Need a fresh take? Get an instant paraphrase of this document with our AI Paraphraser
Document Page
7BUS708: STATISTICS AND DATA ANALYSIS
References
Blau, F.D., 2016. Gender, inequality, and wages. OUP Catalogue.
Konasani, V.R. and Kadre, S., 2015. Testing of hypothesis. In Practical business analytics using SAS (pp.
261-293). Apress, Berkeley, CA.
chevron_up_icon
1 out of 8
circle_padding
hide_on_mobile
zoom_out_icon
[object Object]