Statistical Analysis Report: Gender, Employment, Income Relationships

Verified

Added on  2023/04/06

|9
|1027
|188
Report
AI Summary
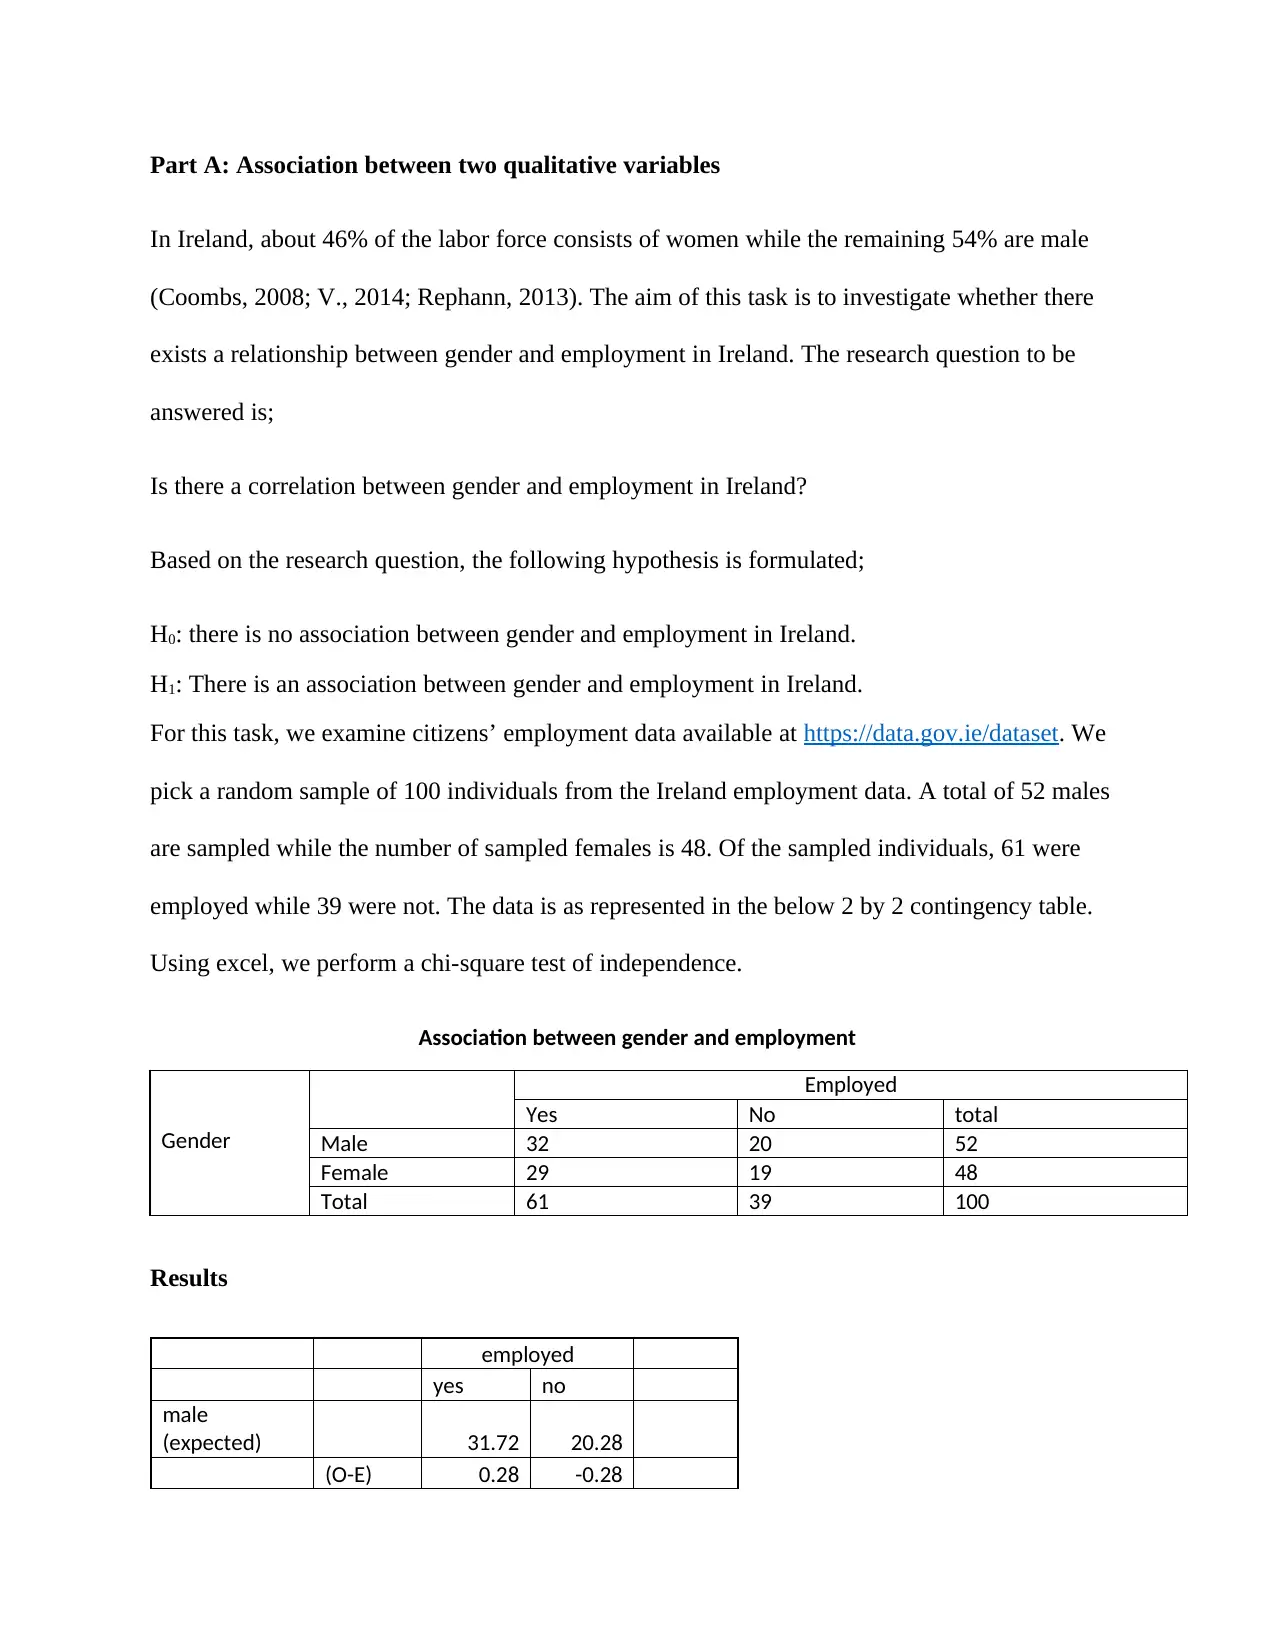
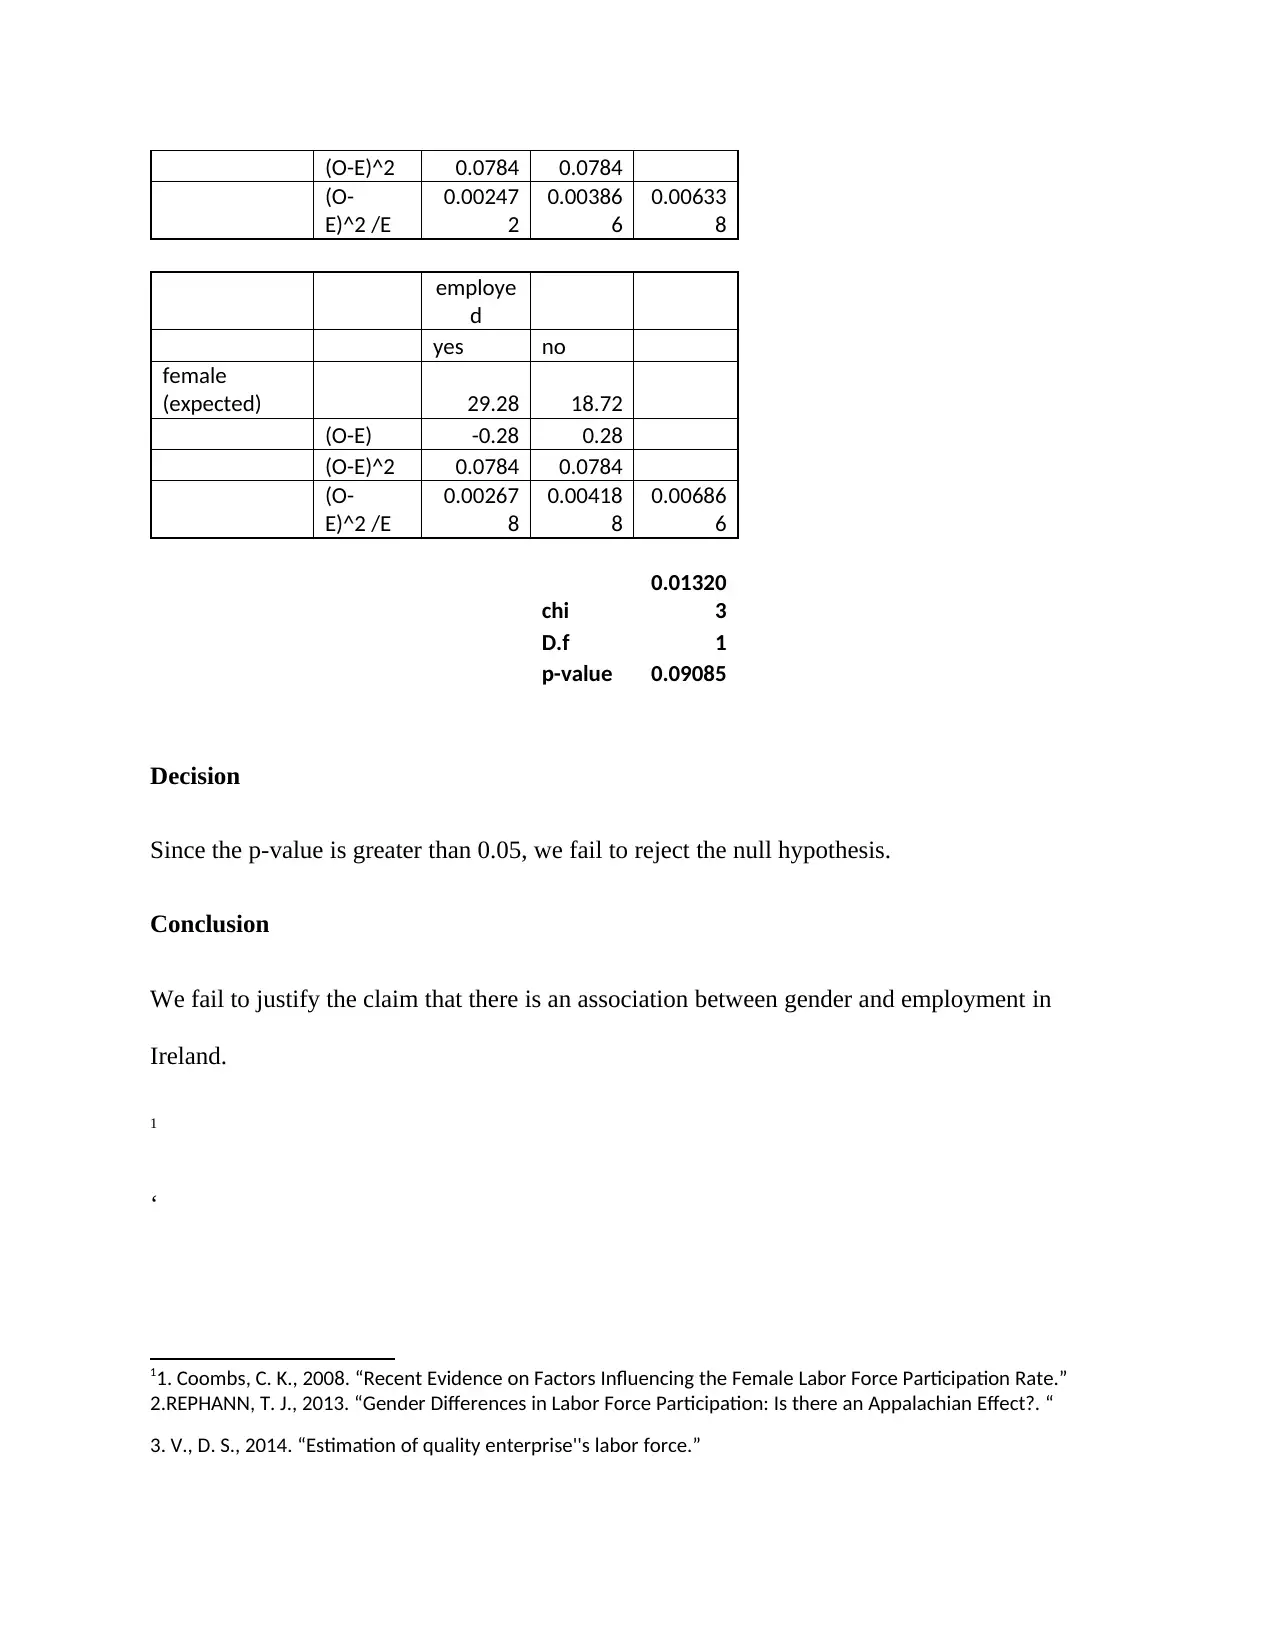
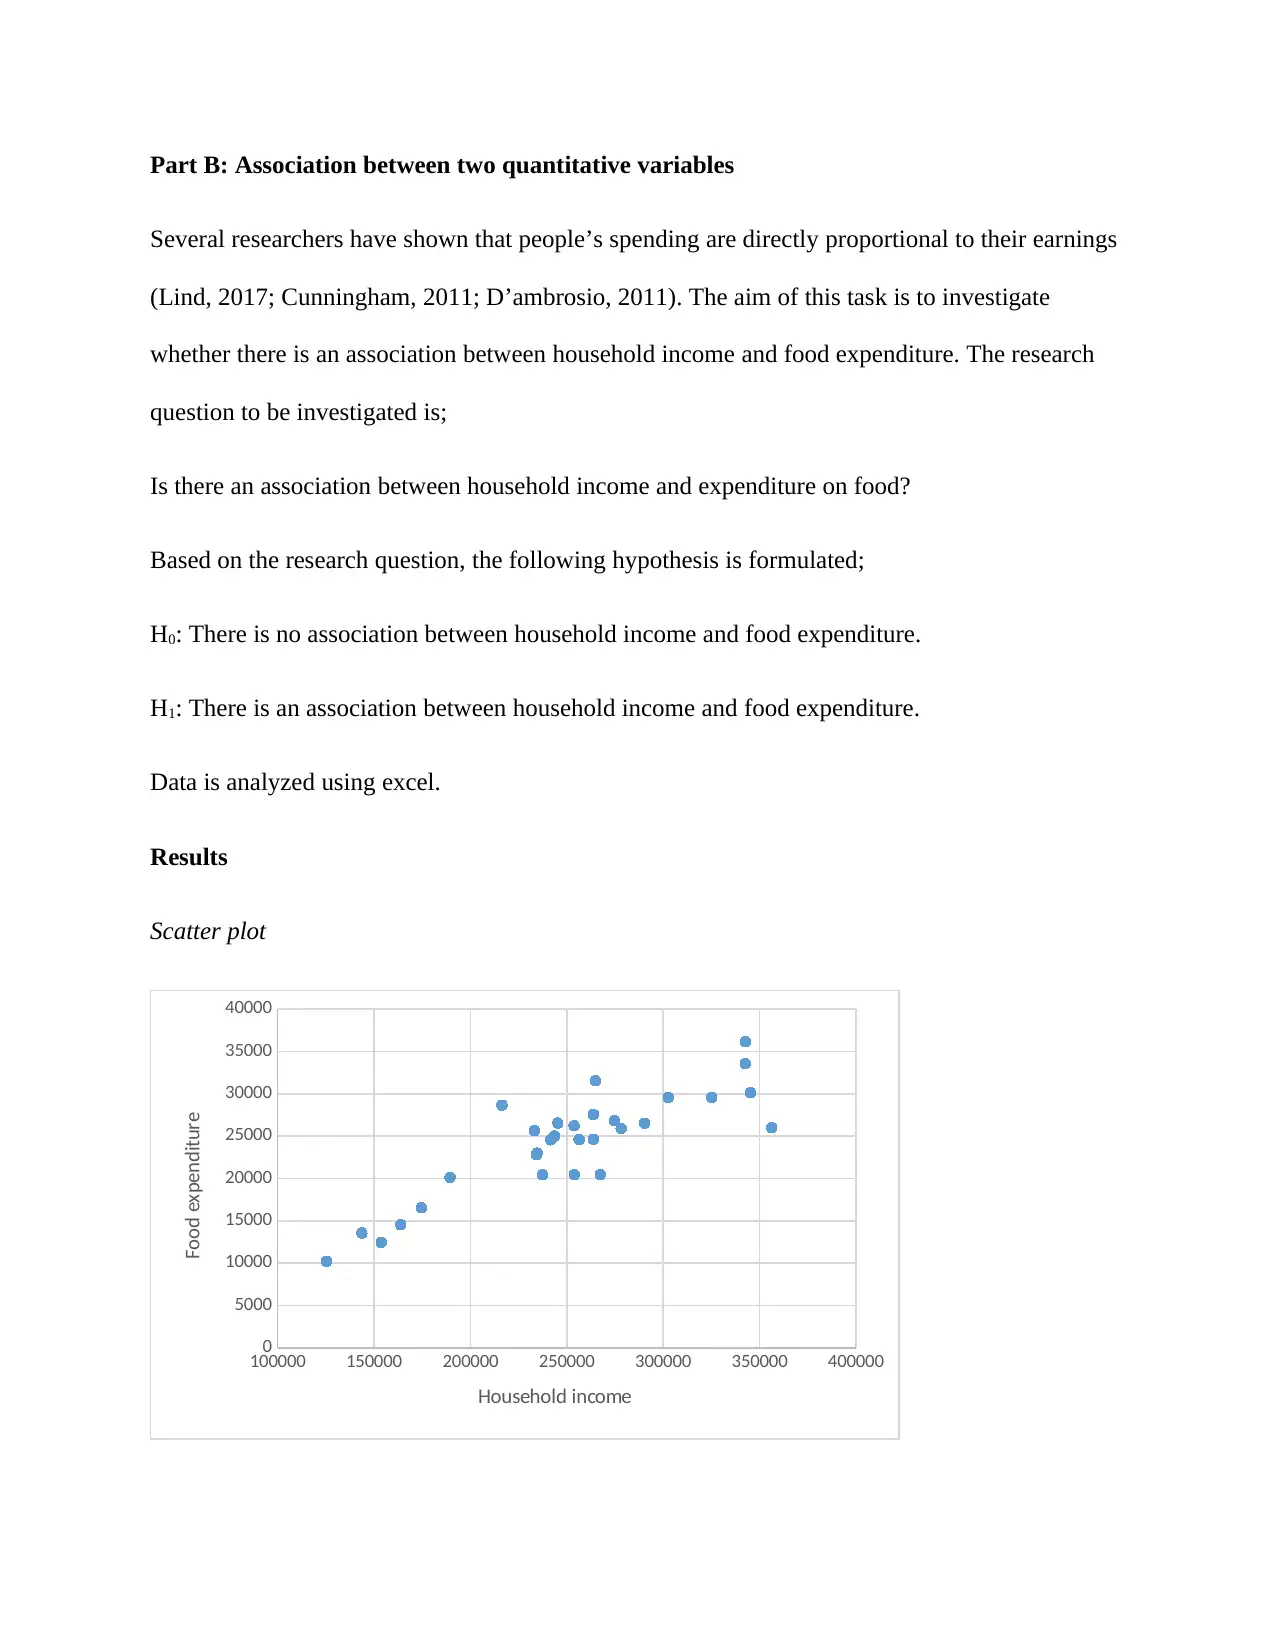
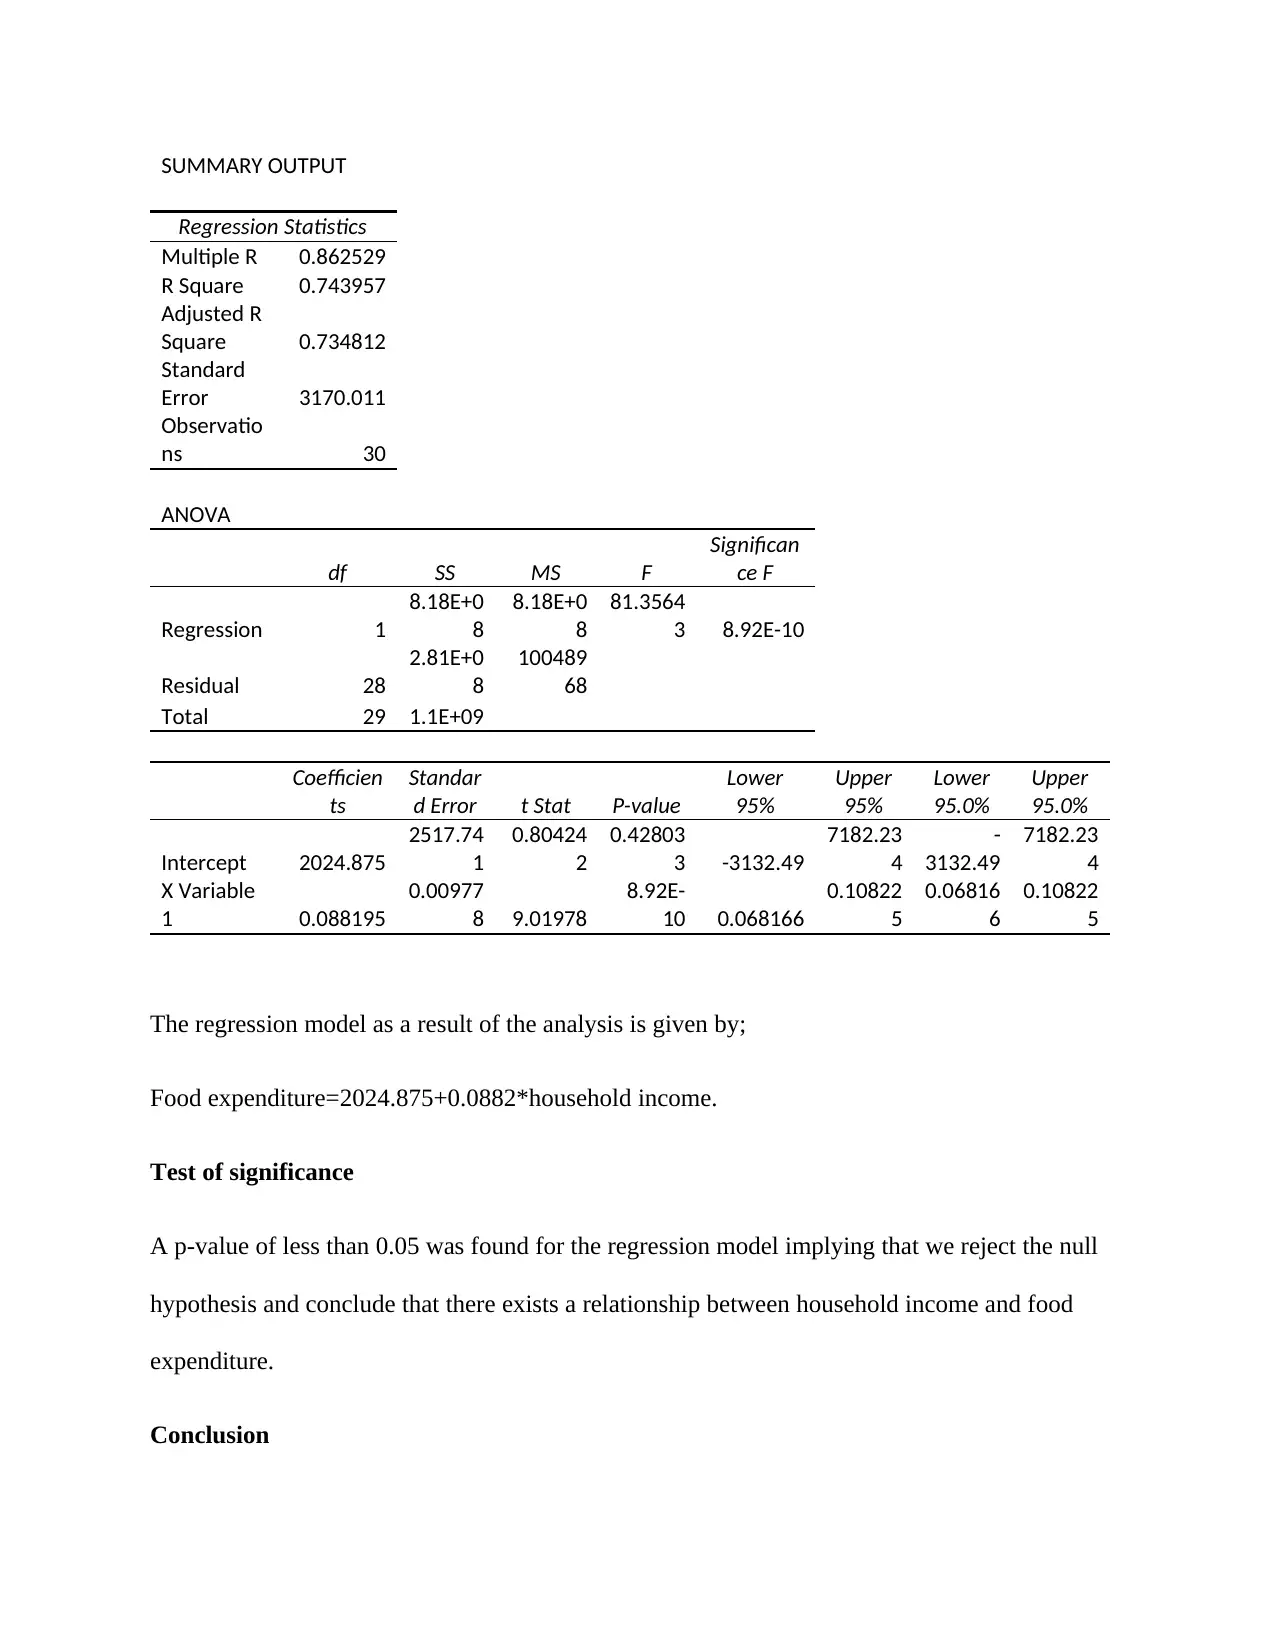
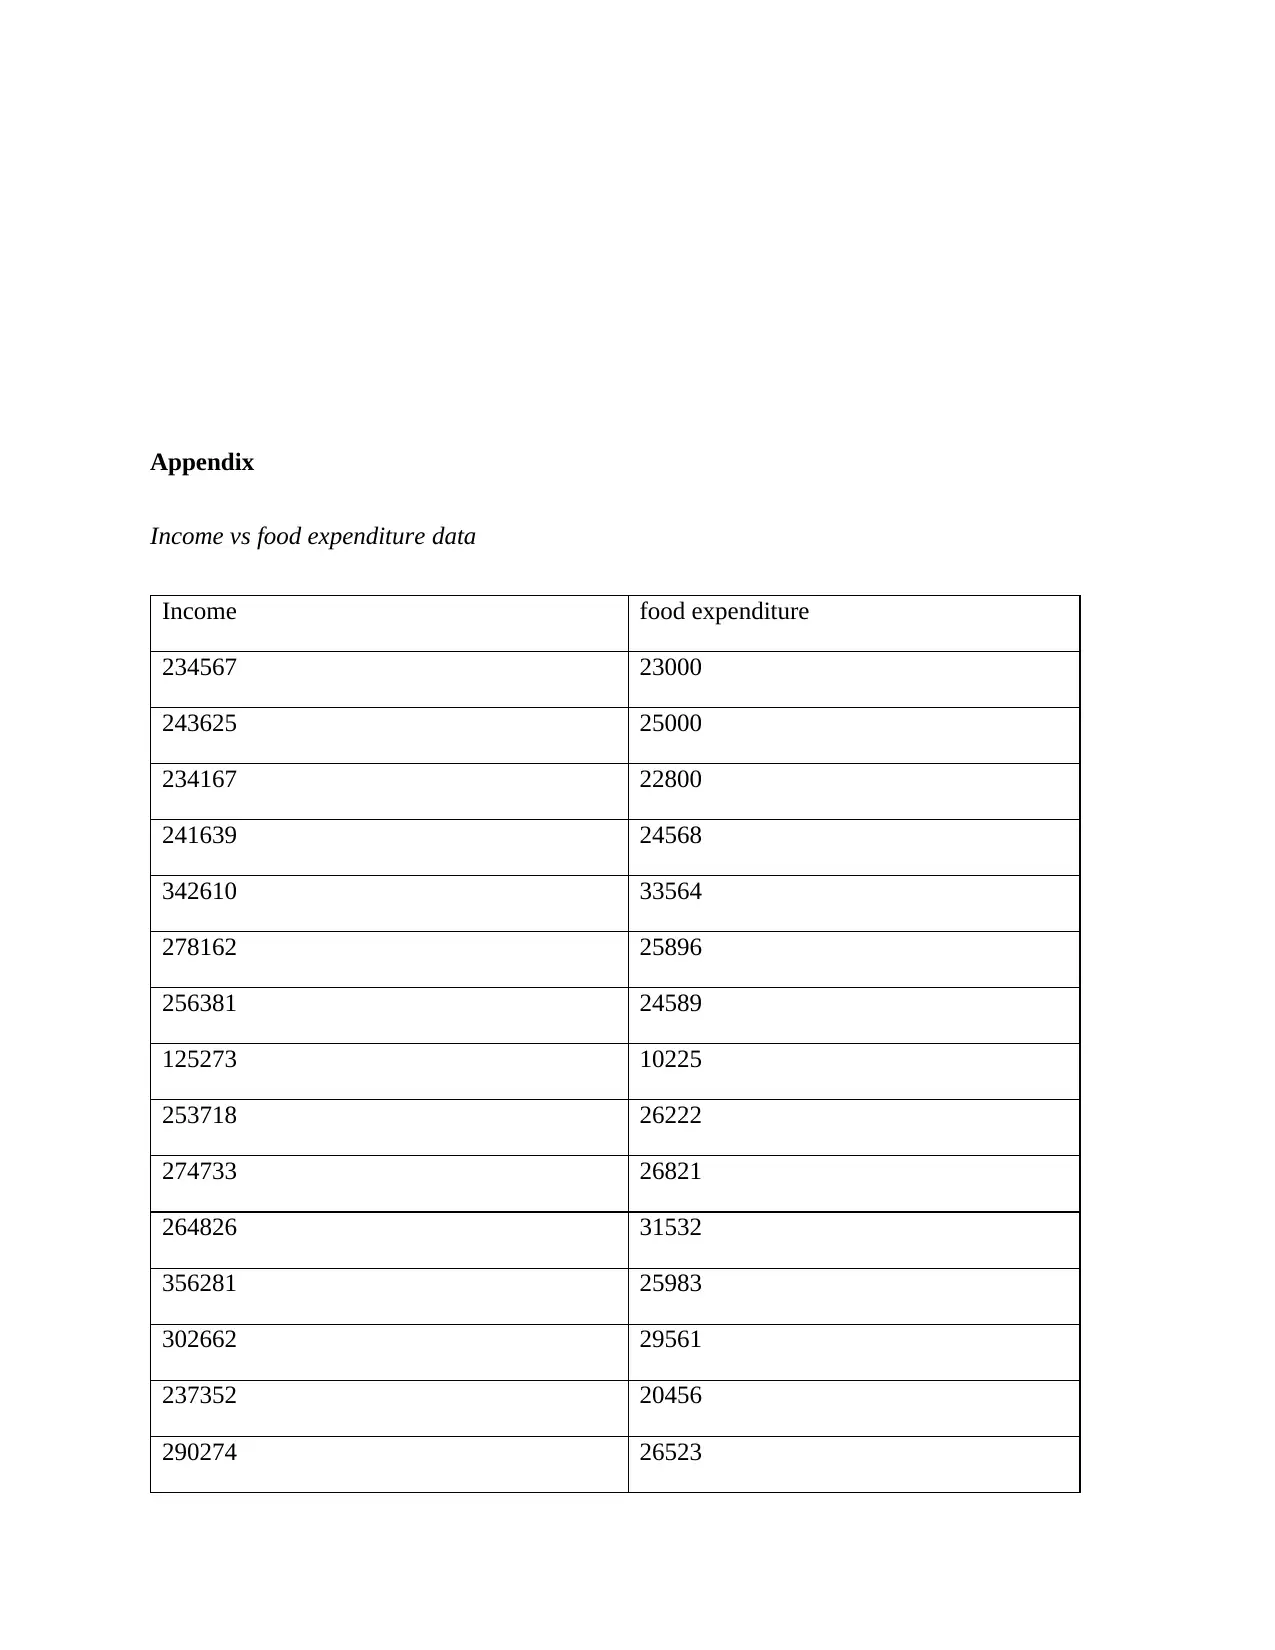
This report presents a statistical analysis of employment and income data in Ireland. Part A investigates the association between gender and employment using a chi-square test on a sample of 100 individuals, finding no significant correlation based on a p-value greater than 0.05. Part B examines the relationship between household income and food expenditure, employing scatter plots, correlation coefficients, and regression analysis. The analysis reveals a positive correlation, with a coefficient of 0.862529, and a statistically significant regression model (p-value < 0.05). The report concludes that there is a relationship between household income and food expenditure. Another independent variable, the number of household members, is also suggested to predict household food expenditure. The report includes a bibliography and an appendix with the income vs. food expenditure data.
tabler-icon-diamond-filled.svg

Contribute Materials

Your contribution can guide someone’s learning journey. Share your documents today.
Document Page
Part A: Association between two qualitative variables
In Ireland, about 46% of the labor force consists of women while the remaining 54% are male
(Coombs, 2008; V., 2014; Rephann, 2013). The aim of this task is to investigate whether there
exists a relationship between gender and employment in Ireland. The research question to be
answered is;
Is there a correlation between gender and employment in Ireland?
Based on the research question, the following hypothesis is formulated;
H0: there is no association between gender and employment in Ireland.
H1: There is an association between gender and employment in Ireland.
For this task, we examine citizens’ employment data available at https://data.gov.ie/dataset. We
pick a random sample of 100 individuals from the Ireland employment data. A total of 52 males
are sampled while the number of sampled females is 48. Of the sampled individuals, 61 were
employed while 39 were not. The data is as represented in the below 2 by 2 contingency table.
Using excel, we perform a chi-square test of independence.
Association between gender and employment
Gender
Employed
Yes No total
Male 32 20 52
Female 29 19 48
Total 61 39 100
Results
employed
yes no
male
(expected) 31.72 20.28
(O-E) 0.28 -0.28
tabler-icon-diamond-filled.svg

Secure Best Marks with AI Grader

Need help grading? Try our AI Grader for instant feedback on your assignments.
Document Page
(O-E)^2 0.0784 0.0784
(O-
E)^2 /E
0.00247
2
0.00386
6
0.00633
8
employe
d
yes no
female
(expected) 29.28 18.72
(O-E) -0.28 0.28
(O-E)^2 0.0784 0.0784
(O-
E)^2 /E
0.00267
8
0.00418
8
0.00686
6
chi
0.01320
3
D.f 1
p-value 0.09085
Decision
Since the p-value is greater than 0.05, we fail to reject the null hypothesis.
Conclusion
We fail to justify the claim that there is an association between gender and employment in
Ireland.
1

11. Coombs, C. K., 2008. “Recent Evidence on Factors Influencing the Female Labor Force Participation Rate.”
2.REPHANN, T. J., 2013. “Gender Differences in Labor Force Participation: Is there an Appalachian Effect?.
3. V., D. S., 2014. “Estimation of quality enterprise''s labor force.”
Document Page
Part B: Association between two quantitative variables
Several researchers have shown that people’s spending are directly proportional to their earnings
(Lind, 2017; Cunningham, 2011; D’ambrosio, 2011). The aim of this task is to investigate
whether there is an association between household income and food expenditure. The research
question to be investigated is;
Is there an association between household income and expenditure on food?
Based on the research question, the following hypothesis is formulated;
H0: There is no association between household income and food expenditure.
H1: There is an association between household income and food expenditure.
Data is analyzed using excel.
Results
Scatter plot
100000 150000 200000 250000 300000 350000 400000
0
5000
10000
15000
20000
25000
30000
35000
40000
Household income
Food expenditure
Document Page
The scatter plot shows that there is a linear relationship between household income and food
expenditure. Food expenditure increases with increase in household income.
Correlation
income expenditure
income 1
expenditure
0.86252
9 1
The correlation coefficient between household income and food expenditure is found to be
0.862529. This coefficient implies that an increase in household income would lead to a
corresponding increase in food expenditure by about 0.86 units.
Regression
100000 150000 200000 250000 300000 350000 400000
0
5000
10000
15000
20000
25000
30000
35000
40000
X Variable 1 Line Fit Plot
Y
Predicted Y
X Variable 1
Y
tabler-icon-diamond-filled.svg

Secure Best Marks with AI Grader

Need help grading? Try our AI Grader for instant feedback on your assignments.
Document Page
SUMMARY OUTPUT
Regression Statistics
Multiple R 0.862529
R Square 0.743957
Adjusted R
Square 0.734812
Standard
Error 3170.011
Observatio
ns 30
ANOVA
df SS MS F
Significan
ce F
Regression 1
8.18E+0
8
8.18E+0
8
81.3564
3 8.92E-10
Residual 28
2.81E+0
8
100489
68
Total 29 1.1E+09
Coefficien
ts
Standar
d Error t Stat P-value
Lower
95%
Upper
95%
Lower
95.0%
Upper
95.0%
Intercept 2024.875
2517.74
1
0.80424
2
0.42803
3 -3132.49
7182.23
4
-
3132.49
7182.23
4
X Variable
1 0.088195
0.00977
8 9.01978
8.92E-
10 0.068166
0.10822
5
0.06816
6
0.10822
5
The regression model as a result of the analysis is given by;
Food expenditure=2024.875+0.0882*household income.
Test of significance
A p-value of less than 0.05 was found for the regression model implying that we reject the null
hypothesis and conclude that there exists a relationship between household income and food
expenditure.
Conclusion
Document Page
Results of the analysis have depicted that indeed there exists a relationship between household
income and food expenditure since a p-value less than 0.05 implies that we reject the null
hypothesis of no relationship in favor of the alternative.
Independent variable that would also be used as a predictor
Another independent variable that could be used to predict household food expenditure is the
number of household members.
The new model establishes a line of best fit predicting household food expenditure based on two
independent variables. The line of best fit is found by eliminating regression errors thereby
providing better predictability of the dependent variable. 2
3
24. Cunningham, C. M., 2011. “Income inequities in end-of-life health care spending in British Columbia,
Canada: A cross-sectional analysis”.
5. D’ambrosio, C., 2011. “Household Characteristics and the Distribution of Income In Italy: An
Application of Social Distance Measures.”
6. Lind, J. T. R. D., 2017. “Knowledge is Power: A Theory of Information, Income and Welfare Spending.”S
3
Document Page
Bibliography
Coombs, C. K., 2008. Recent Evidence on Factors Influencing the Female Labor Force Participation Rate.
pp. 13.
Cunningham, C. M., 2011. Income inequities in end-of-life health care spending in British Columbia,
Canada: A cross-sectional analysis, 2004-2006. pp. 4.
D’ambrosio, C., 2011. Household Characteristics and the Distribution of Income In Italy: An Application
of Social Distance Measures. pp. 7.
Lind, J. T. R. D., 2017. Knowledge is Power: A Theory of Information, Income and Welfare Spending. pp.
12.
REPHANN, T. J., 2013. Gender Differences in Labor Force Participation: Is there an Appalachian Effect?.
pp. 7.
V., D. S., 2014. Estimation of quality enterprise''s labor force. pp. 7.
tabler-icon-diamond-filled.svg

Paraphrase This Document

Need a fresh take? Get an instant paraphrase of this document with our AI Paraphraser
Document Page
Appendix
Income vs food expenditure data
Income food expenditure
234567 23000
243625 25000
234167 22800
241639 24568
342610 33564
278162 25896
256381 24589
125273 10225
253718 26222
274733 26821
264826 31532
356281 25983
302662 29561
237352 20456
290274 26523
Document Page
253849 20456
325181 29564
163781 14562
216323 28652
345273 30145
263745 27562
174537 16542
189366 20145
143628 13564
245273 26542
263782 24615
342671 36145
233129 25645
153673 12451
267363 20456
chevron_up_icon
1 out of 9
circle_padding
hide_on_mobile
zoom_out_icon
logo.png

Your All-in-One AI-Powered Toolkit for Academic Success.

Available 24*7 on WhatsApp / Email

[object Object]