Financial Analysis Report: General Mills and Kimberly-Clark Case Study
VerifiedAdded on 2020/05/28
|7
|697
|57
Report
AI Summary
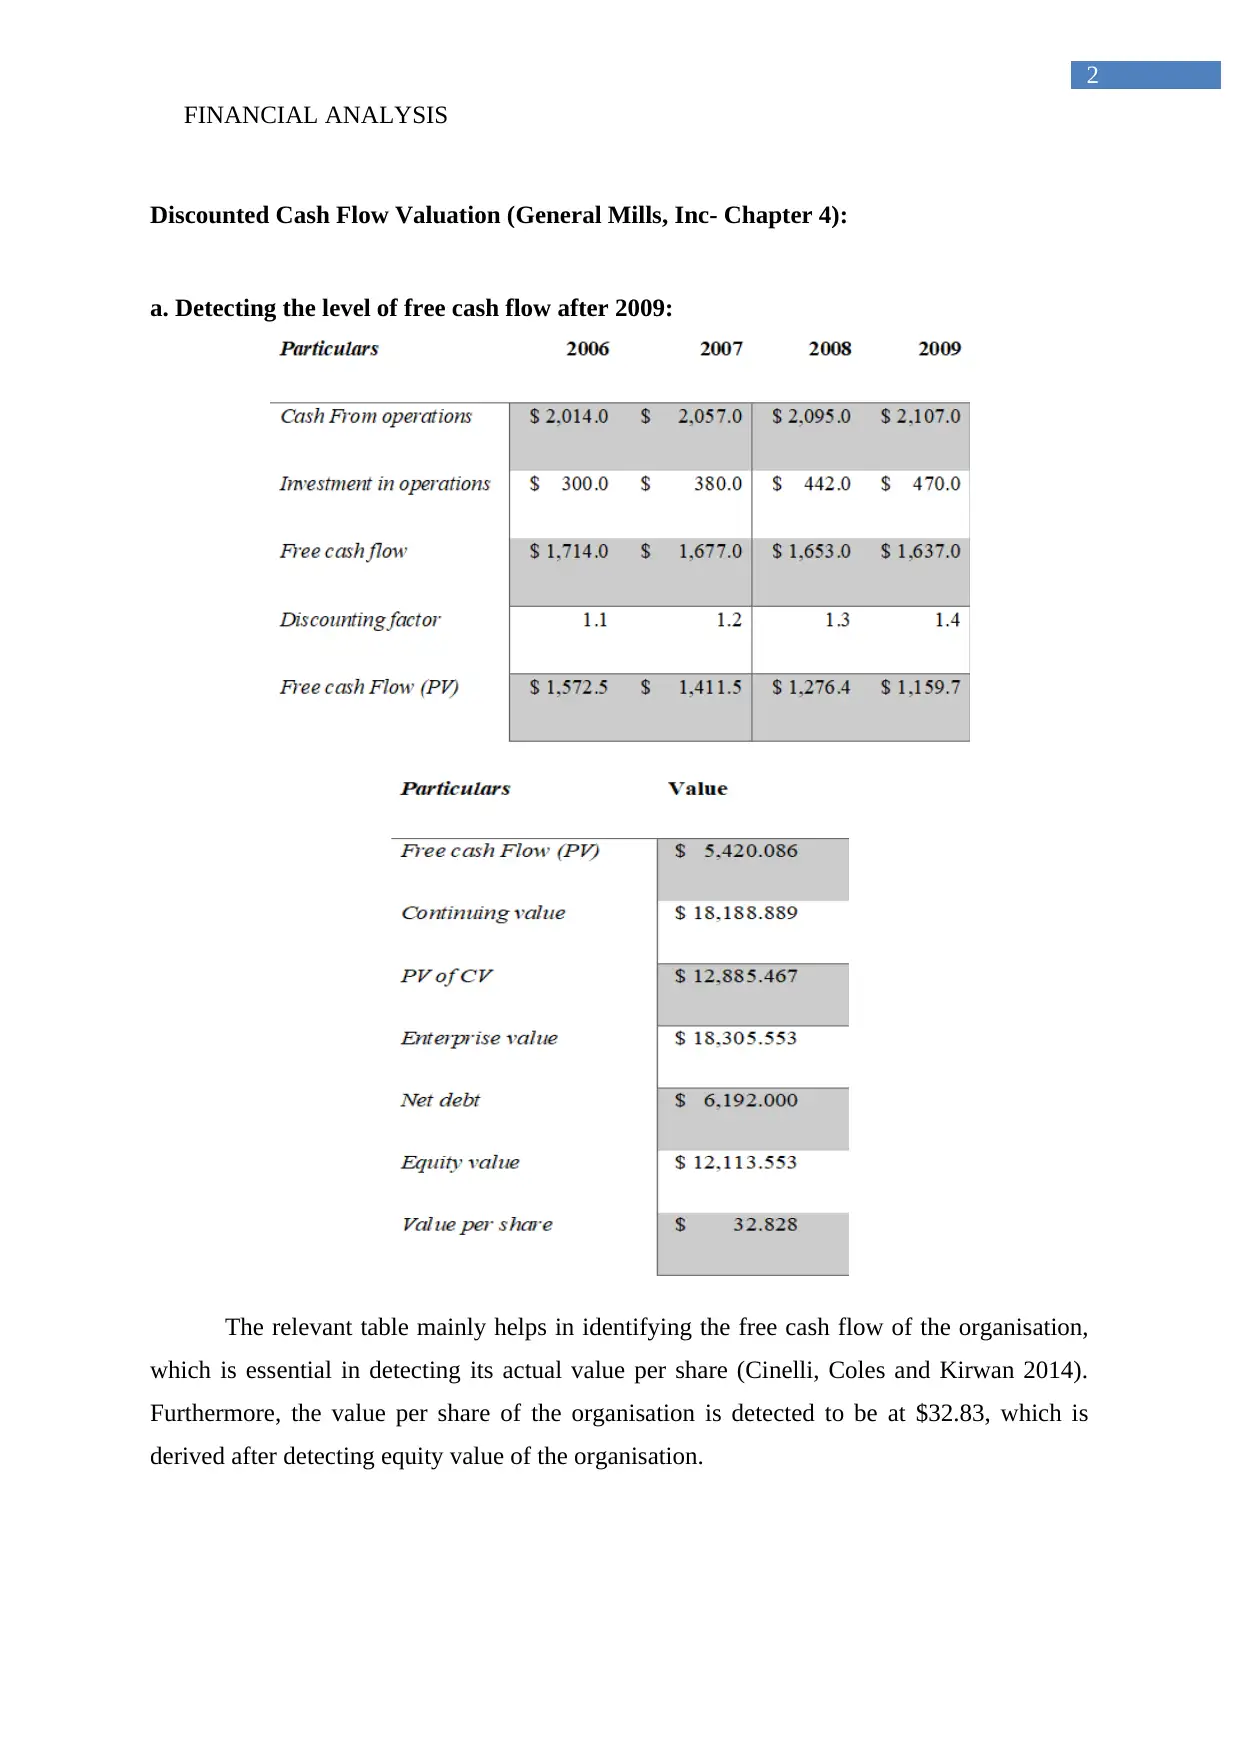
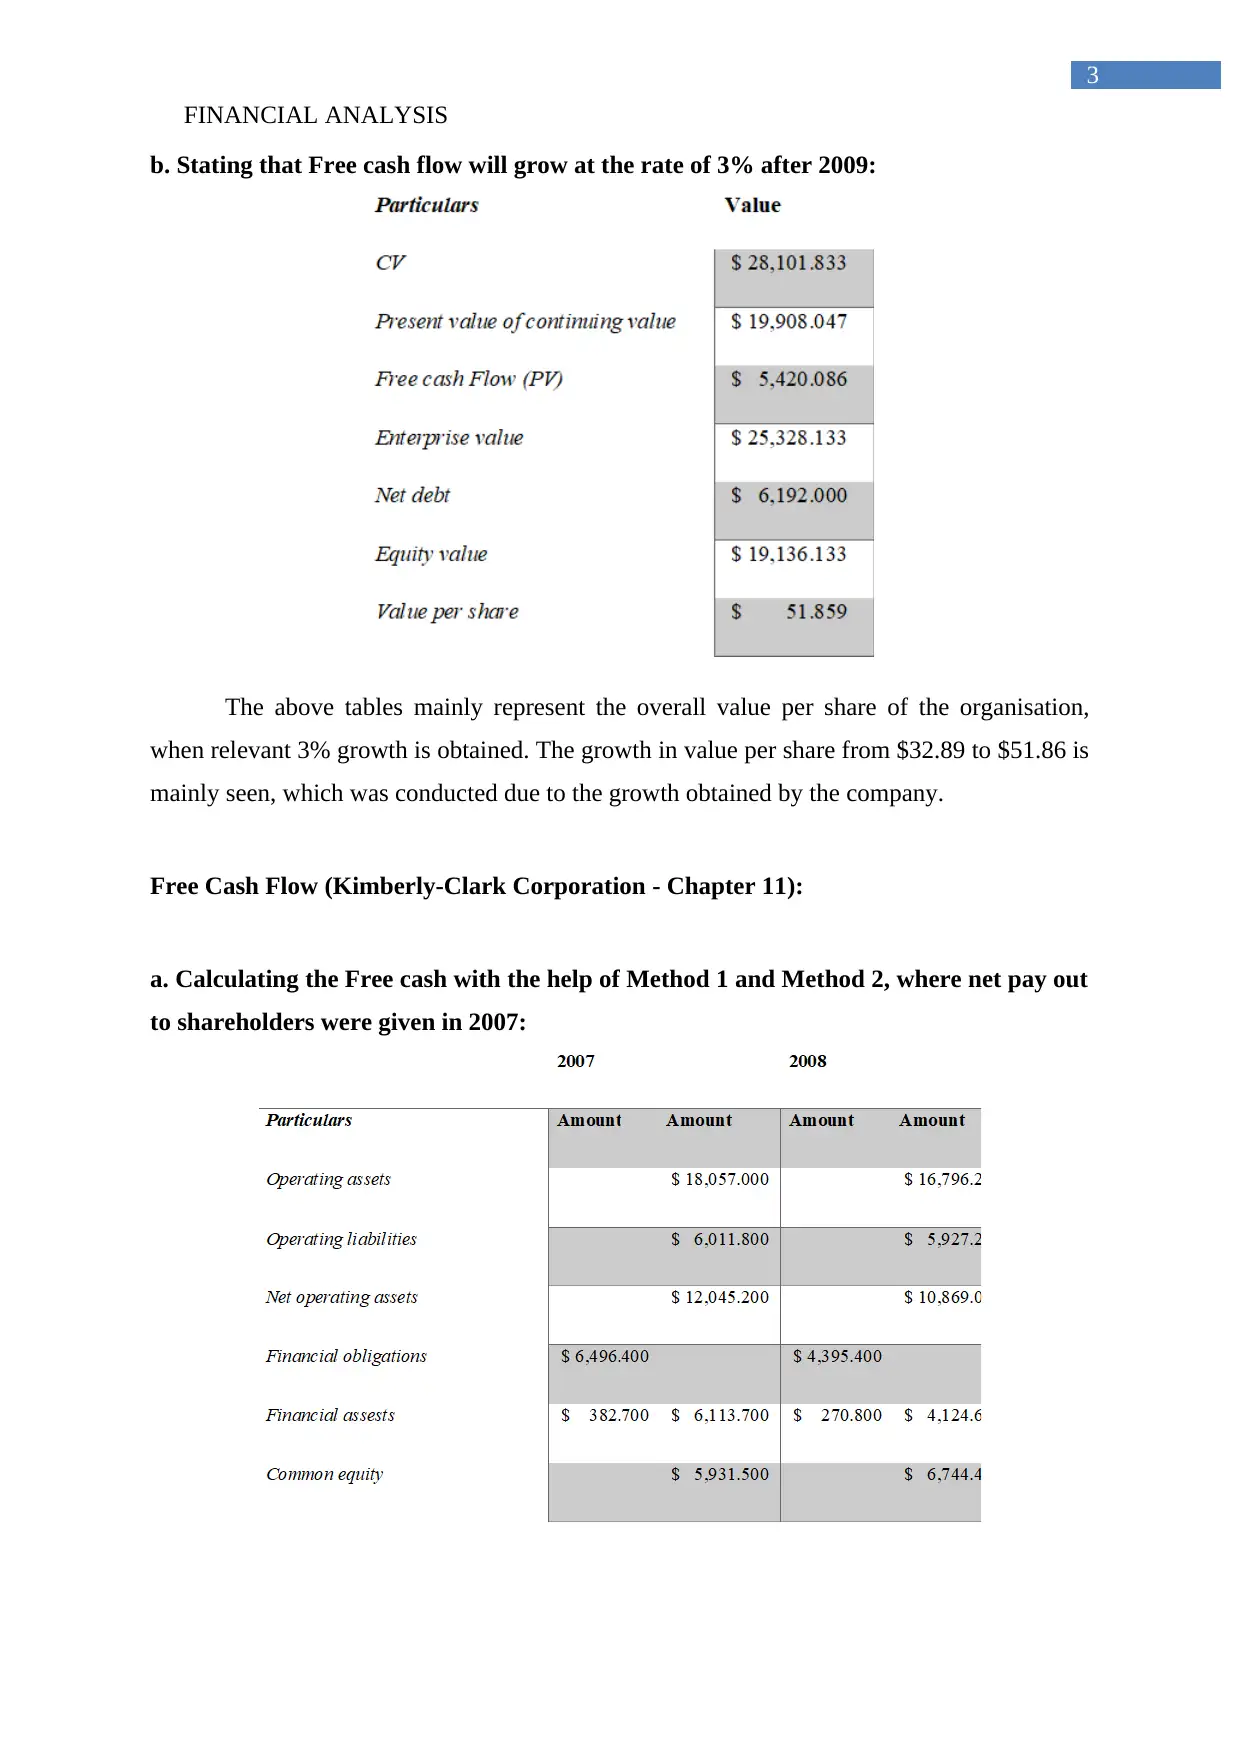
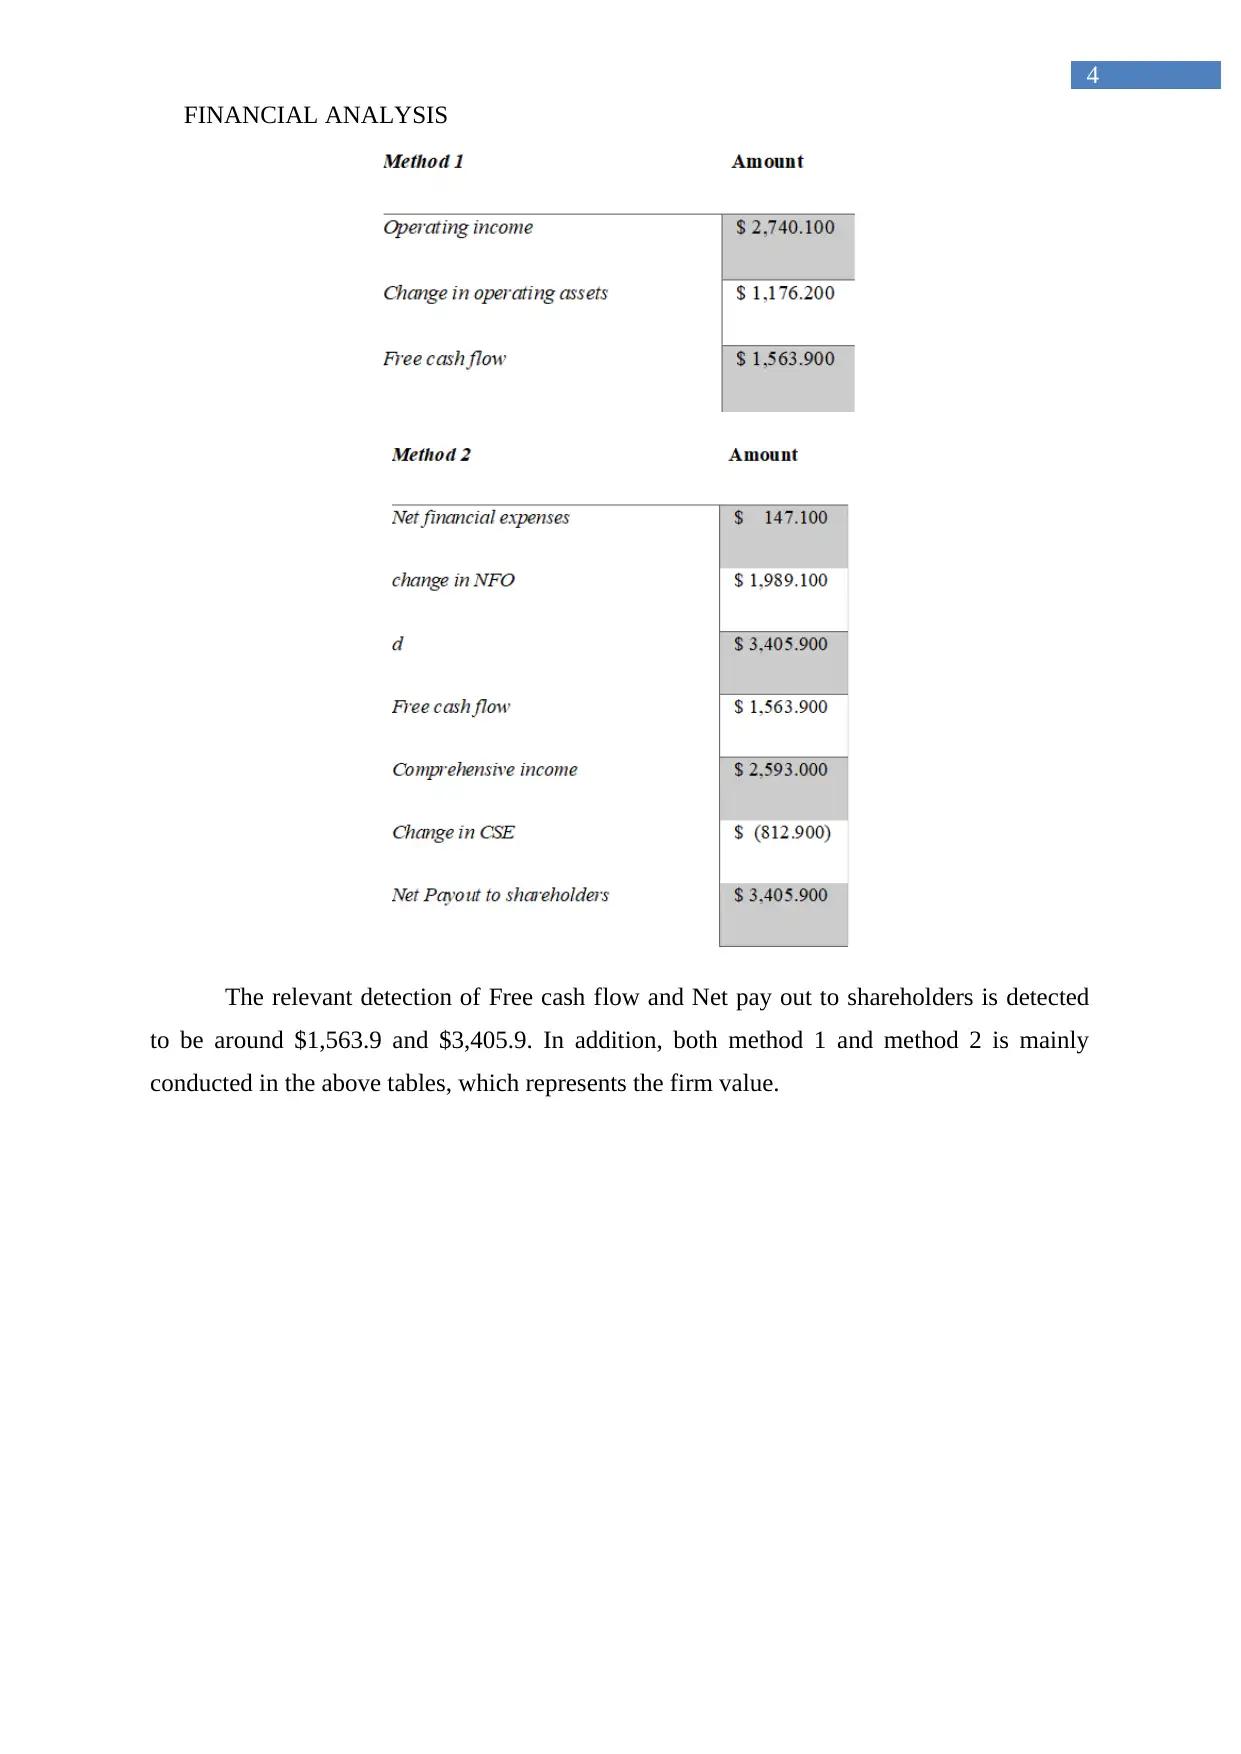
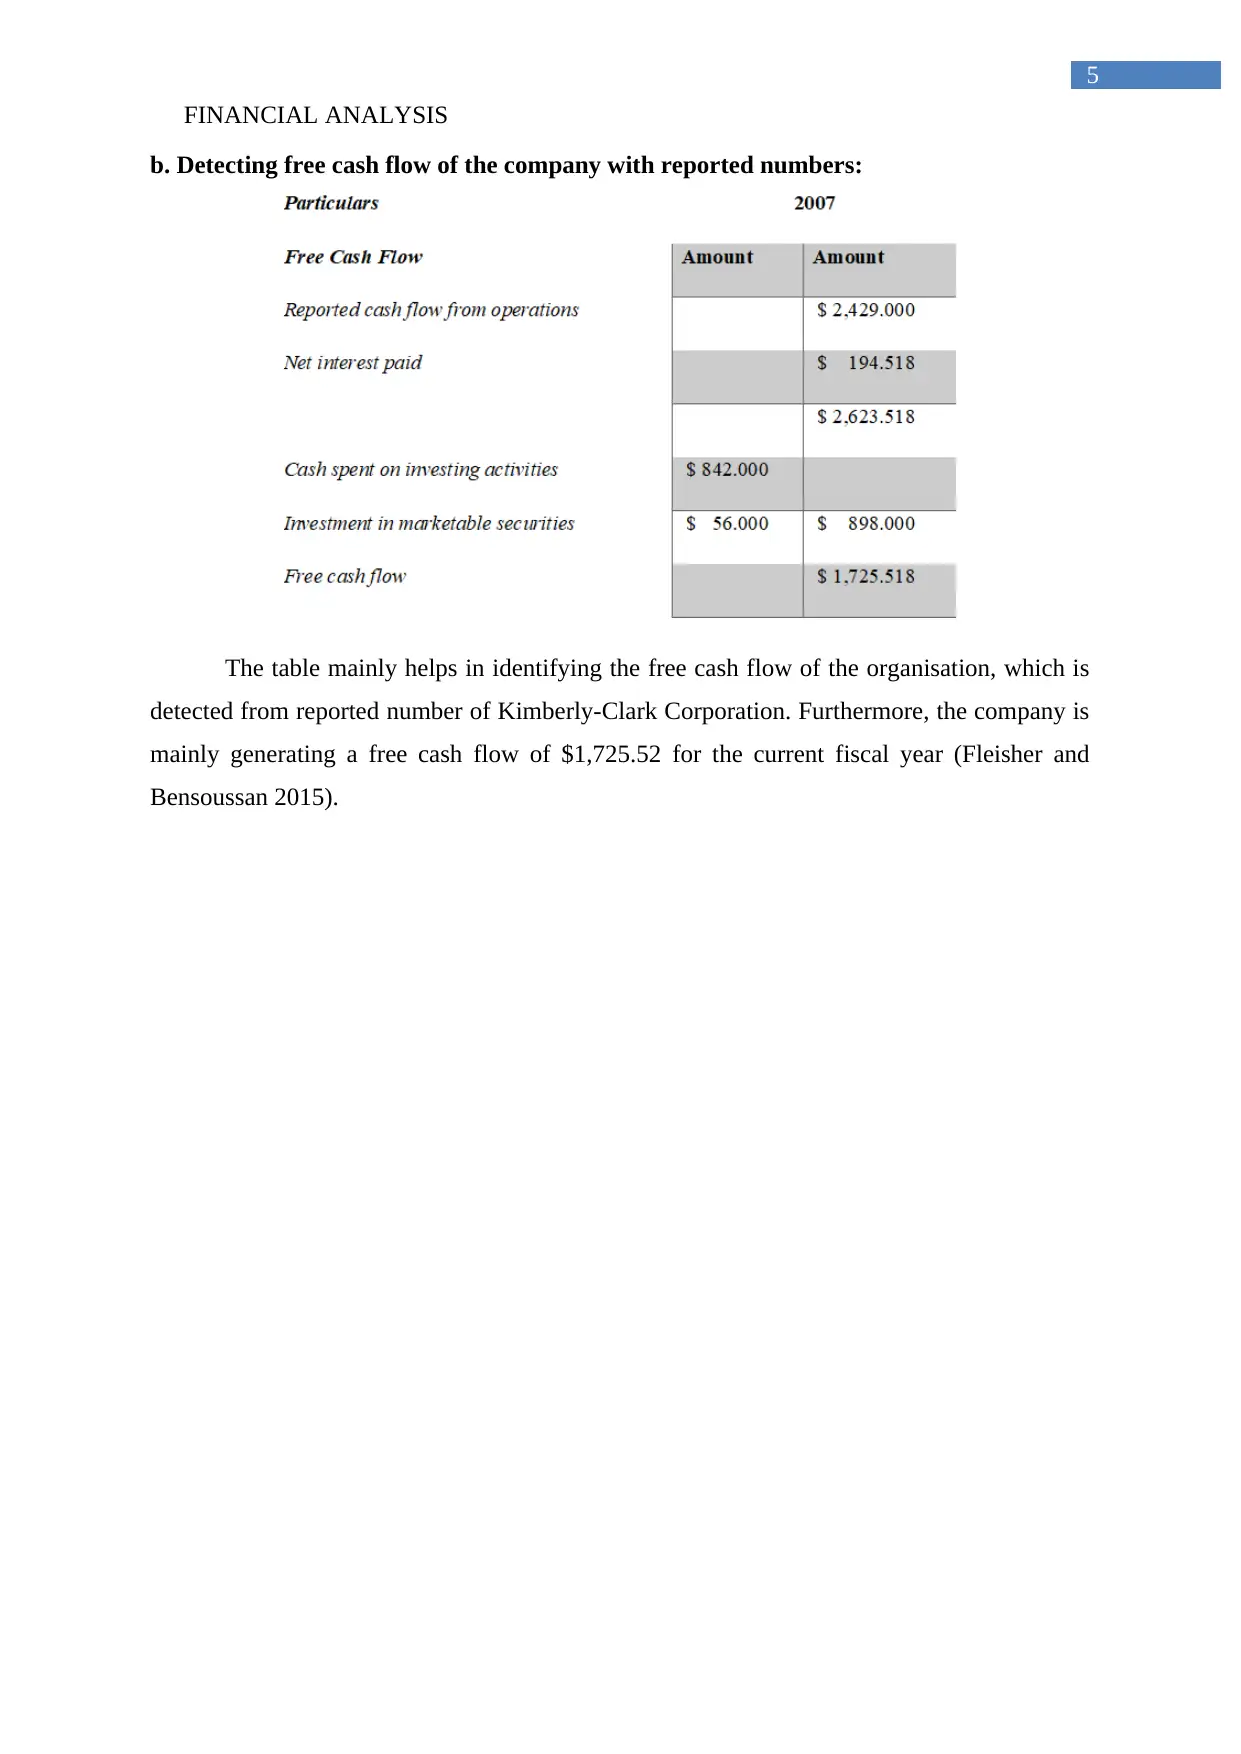
This report presents a financial analysis of General Mills, Inc. and Kimberly-Clark Corporation. It begins with a discounted cash flow (DCF) valuation of General Mills, calculating free cash flow and projecting its growth. The report then moves on to analyze Kimberly-Clark's free cash flow, utilizing two different methods and examining reported financial data. The analysis includes calculations of equity value, free cash flow, and net payouts to shareholders. The report also includes references to academic sources for the methodologies employed and the financial concepts discussed. The report aims to provide a comprehensive understanding of financial analysis techniques applied to real-world corporate scenarios, emphasizing valuation and cash flow management.

Running head: FINANCIAL ANALYSIS
Financial Analysis
Name of the Student:
Name of the University:
Authors Note:
Financial Analysis
Name of the Student:
Name of the University:
Authors Note:
Paraphrase This Document
Need a fresh take? Get an instant paraphrase of this document with our AI Paraphraser

FINANCIAL ANALYSIS
1
Table of Contents
Discounted Cash Flow Valuation (General Mills, Inc- Chapter 4):...........................................2
a. Detecting the level of free cash flow after 2009:...................................................................2
b. Stating that Free cash flow will grow at the rate of 3% after 2009:.......................................3
Free Cash Flow (Kimberly-Clark Corporation - Chapter 11):...................................................3
a. Calculating the Free cash with the help of Method 1 and Method 2, where net pay out to
shareholders were given in 2007:...............................................................................................3
b. Detecting free cash flow of the company with reported numbers:........................................5
Reference and Bibliography:......................................................................................................6

FINANCIAL ANALYSIS
2
Discounted Cash Flow Valuation (General Mills, Inc- Chapter 4):
a. Detecting the level of free cash flow after 2009:
The relevant table mainly helps in identifying the free cash flow of the organisation,
which is essential in detecting its actual value per share (Cinelli, Coles and Kirwan 2014).
Furthermore, the value per share of the organisation is detected to be at $32.83, which is
derived after detecting equity value of the organisation.
⊘ This is a preview!⊘
Do you want full access?
Subscribe today to unlock all pages.

Trusted by 1+ million students worldwide

FINANCIAL ANALYSIS
3
b. Stating that Free cash flow will grow at the rate of 3% after 2009:
The above tables mainly represent the overall value per share of the organisation,
when relevant 3% growth is obtained. The growth in value per share from $32.89 to $51.86 is
mainly seen, which was conducted due to the growth obtained by the company.
Free Cash Flow (Kimberly-Clark Corporation - Chapter 11):
a. Calculating the Free cash with the help of Method 1 and Method 2, where net pay out
to shareholders were given in 2007:
Paraphrase This Document
Need a fresh take? Get an instant paraphrase of this document with our AI Paraphraser

FINANCIAL ANALYSIS
4
The relevant detection of Free cash flow and Net pay out to shareholders is detected
to be around $1,563.9 and $3,405.9. In addition, both method 1 and method 2 is mainly
conducted in the above tables, which represents the firm value.
4
The relevant detection of Free cash flow and Net pay out to shareholders is detected
to be around $1,563.9 and $3,405.9. In addition, both method 1 and method 2 is mainly
conducted in the above tables, which represents the firm value.

FINANCIAL ANALYSIS
5
b. Detecting free cash flow of the company with reported numbers:
The table mainly helps in identifying the free cash flow of the organisation, which is
detected from reported number of Kimberly-Clark Corporation. Furthermore, the company is
mainly generating a free cash flow of $1,725.52 for the current fiscal year (Fleisher and
Bensoussan 2015).
⊘ This is a preview!⊘
Do you want full access?
Subscribe today to unlock all pages.

Trusted by 1+ million students worldwide

FINANCIAL ANALYSIS
6
Reference and Bibliography:
Cinelli, M., Coles, S.R. and Kirwan, K., 2014. Analysis of the potentials of multi criteria
decision analysis methods to conduct sustainability assessment. Ecological Indicators, 46,
pp.138-148.
Fleisher, C.S. and Bensoussan, B.E., 2015. Business and competitive analysis: effective
application of new and classic methods. FT Press.
Isard, W., Azis, I.J., Drennan, M.P., Miller, R.E., Saltzman, S. and Thorbecke, E.,
2017. Methods of interregional and regional analysis. Taylor & Francis.
Kou, G., Peng, Y. and Wang, G., 2014. Evaluation of clustering algorithms for financial risk
analysis using MCDM methods. Information Sciences, 275, pp.1-12.
Ott, R.L. and Longnecker, M.T., 2015. An introduction to statistical methods and data
analysis. Nelson Education.
Rigamonti, L., Ferreira, S., Grosso, M. and Marques, R.C., 2015. Economic-financial
analysis of the Italian packaging waste management system from a local authority's
perspective. Journal of Cleaner Production, 87, pp.533-541.
Shouman, E.R., El Shenawy, E.T. and Khattab, N.M., 2016. Market financial analysis and
cost performance for photovoltaic technology through international and national perspective
with case study for Egypt. Renewable and Sustainable Energy Reviews, 57, pp.540-549.
Vogel, H.L., 2014. Entertainment industry economics: A guide for financial analysis.
Cambridge University Press.
1 out of 7
Related Documents

Your All-in-One AI-Powered Toolkit for Academic Success.
+13062052269
info@desklib.com
Available 24*7 on WhatsApp / Email
Unlock your academic potential
Copyright © 2020–2025 A2Z Services. All Rights Reserved. Developed and managed by ZUCOL.