General Motors: Business and Financial Analysis Executive Summary
VerifiedAdded on 2022/10/09
|19
|705
|20
Report
AI Summary
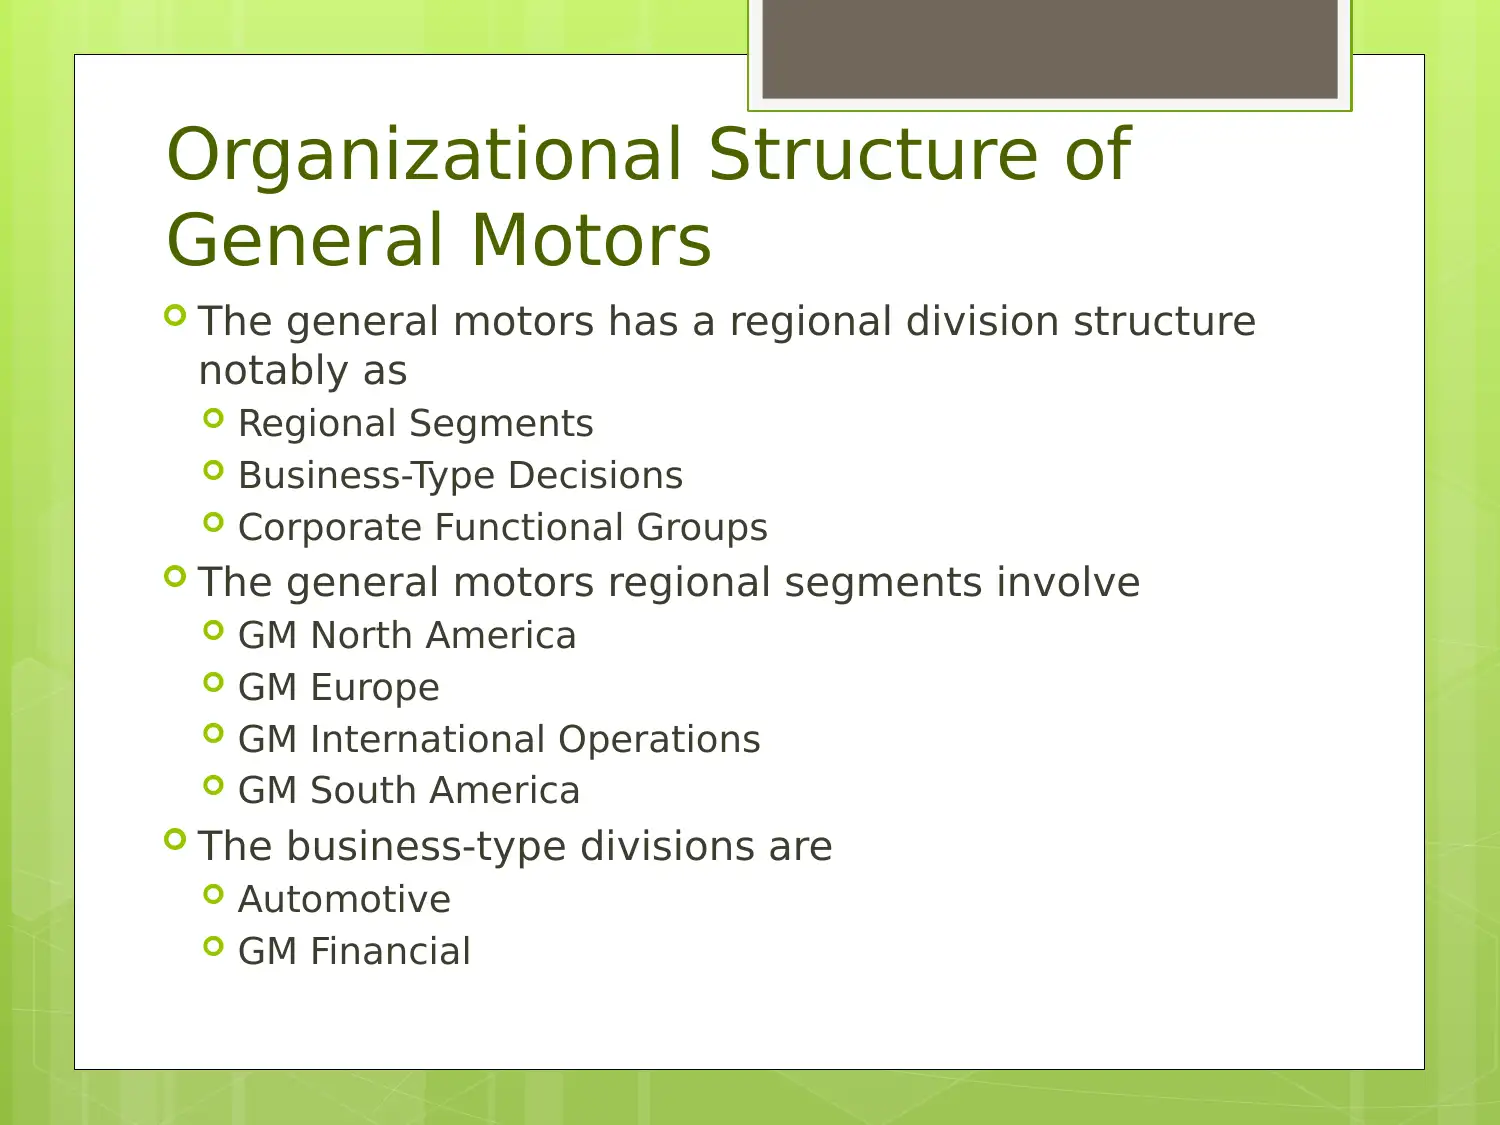
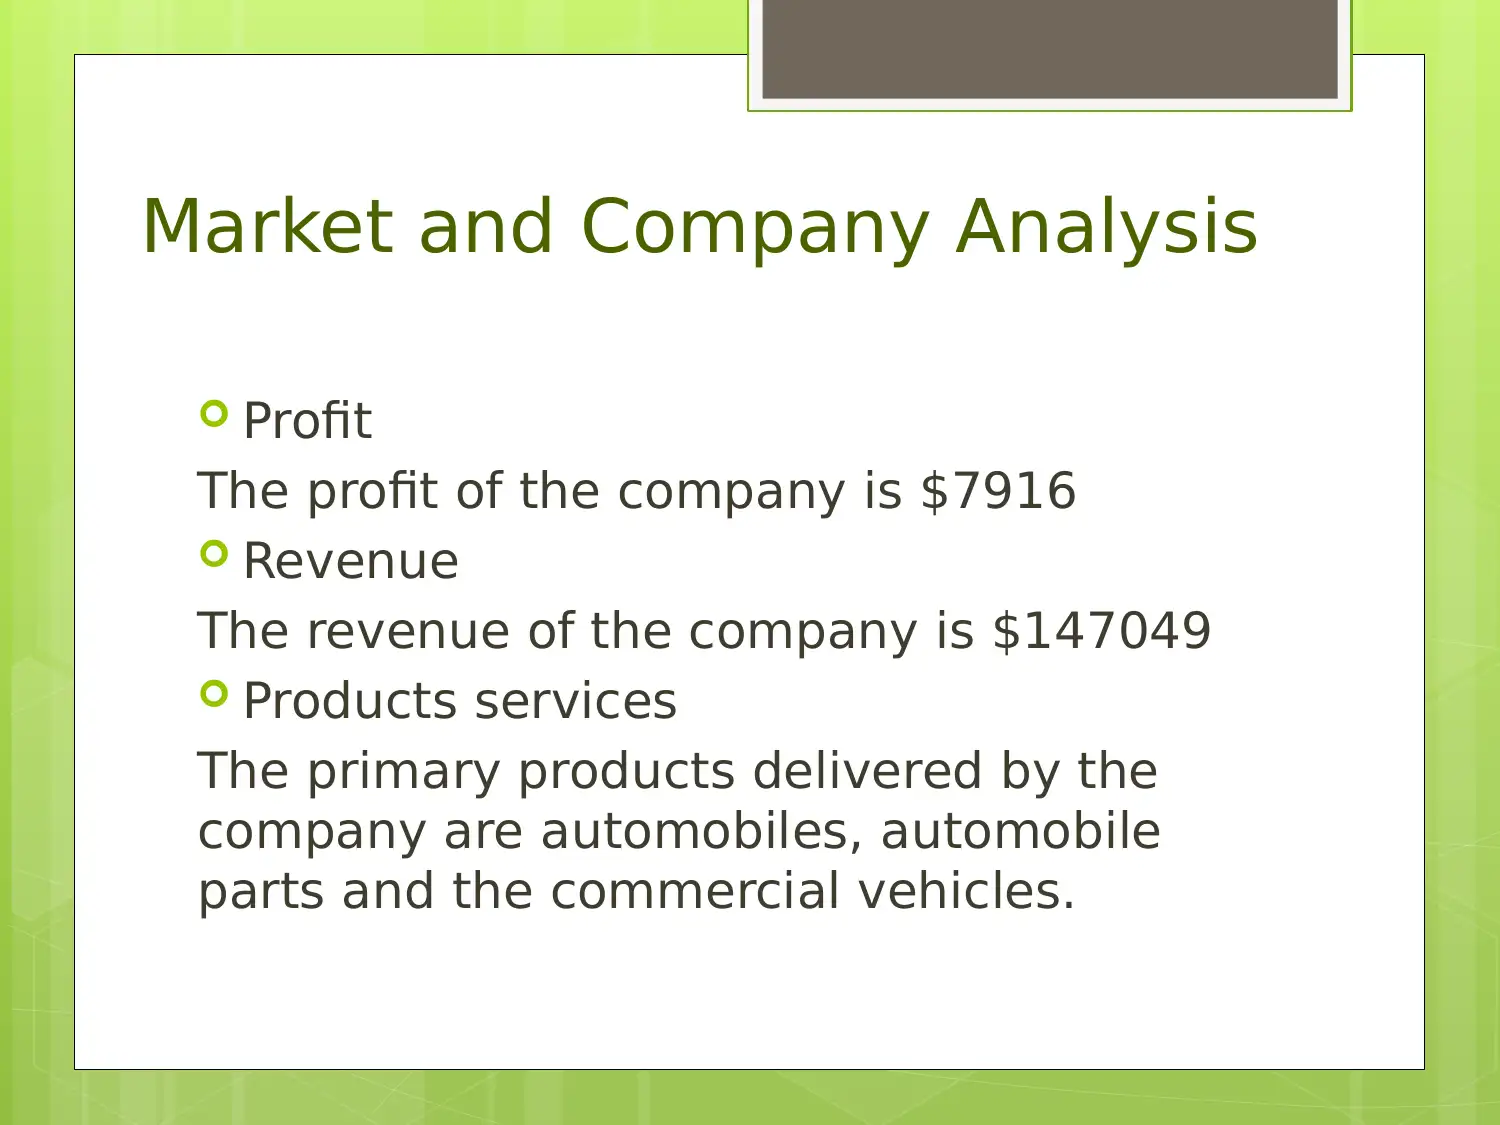
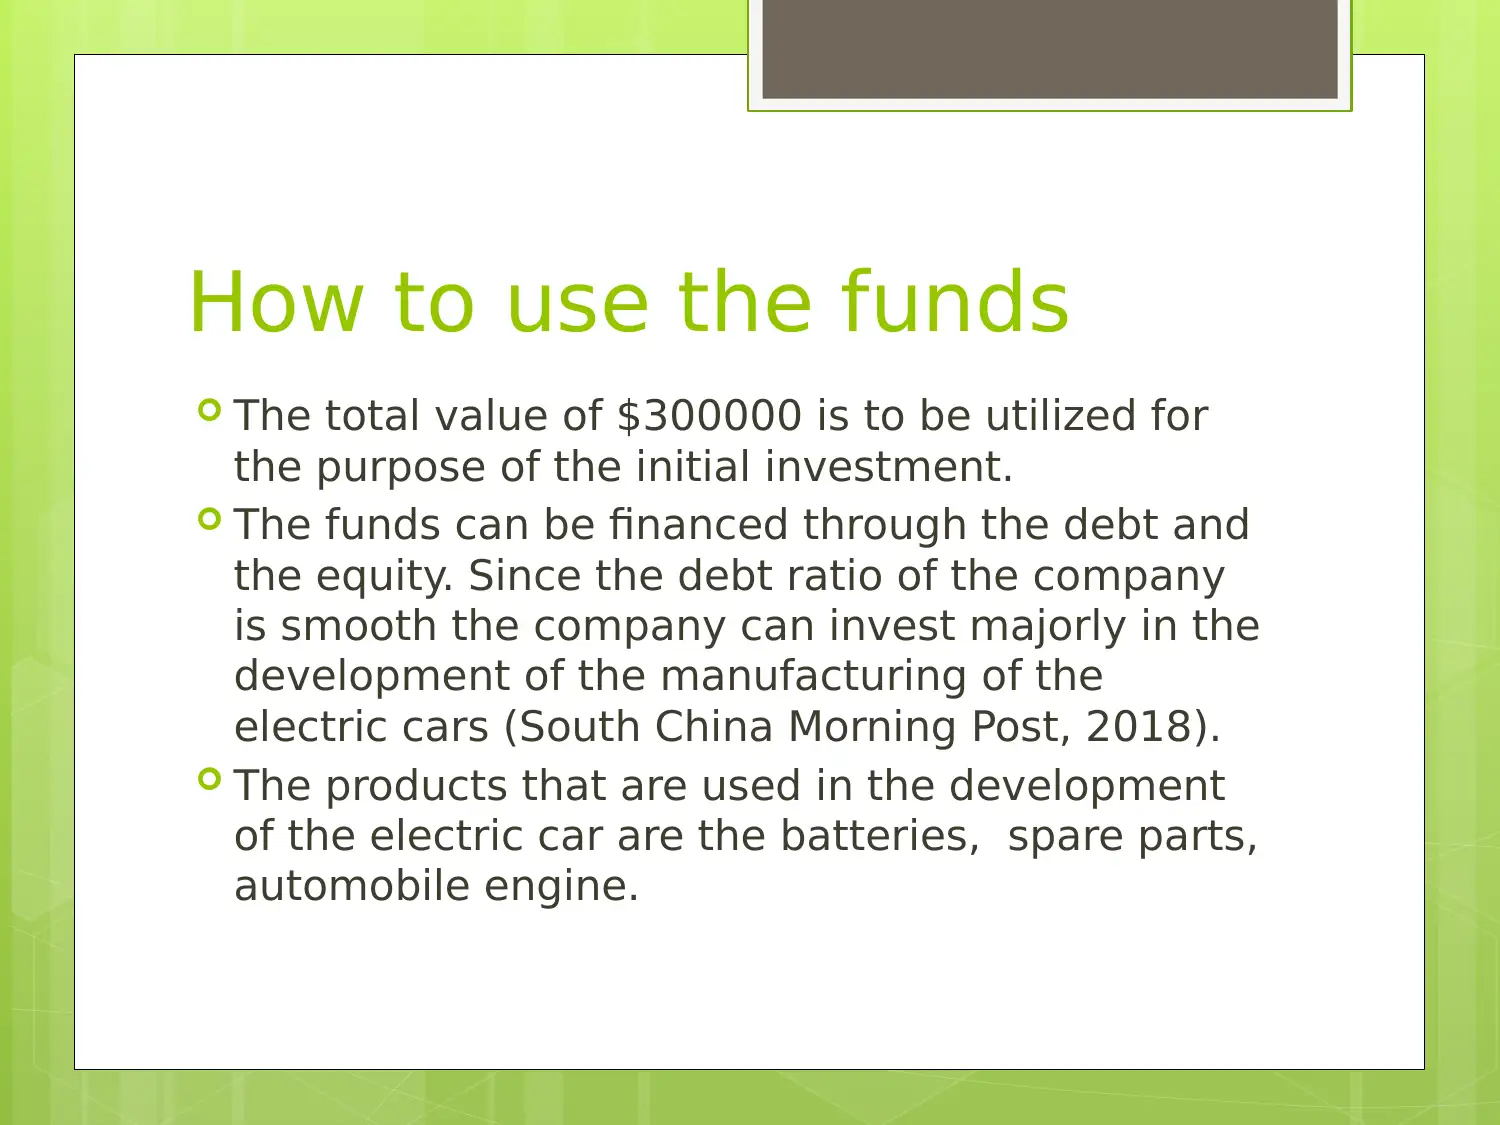
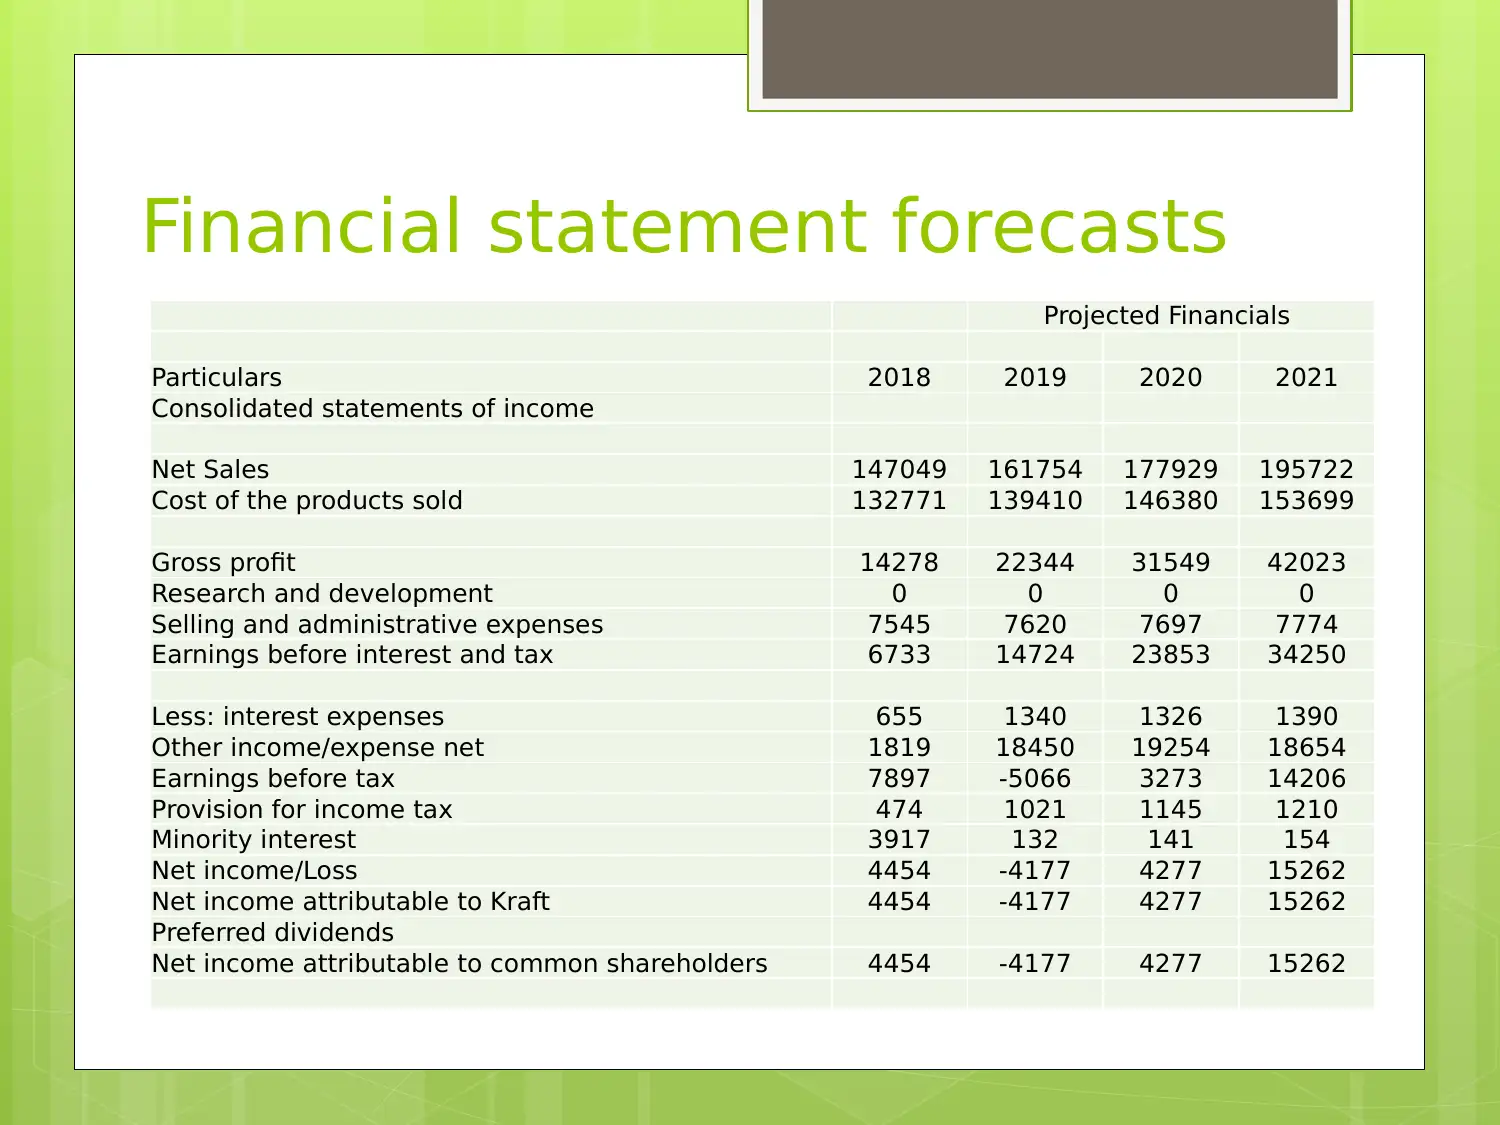
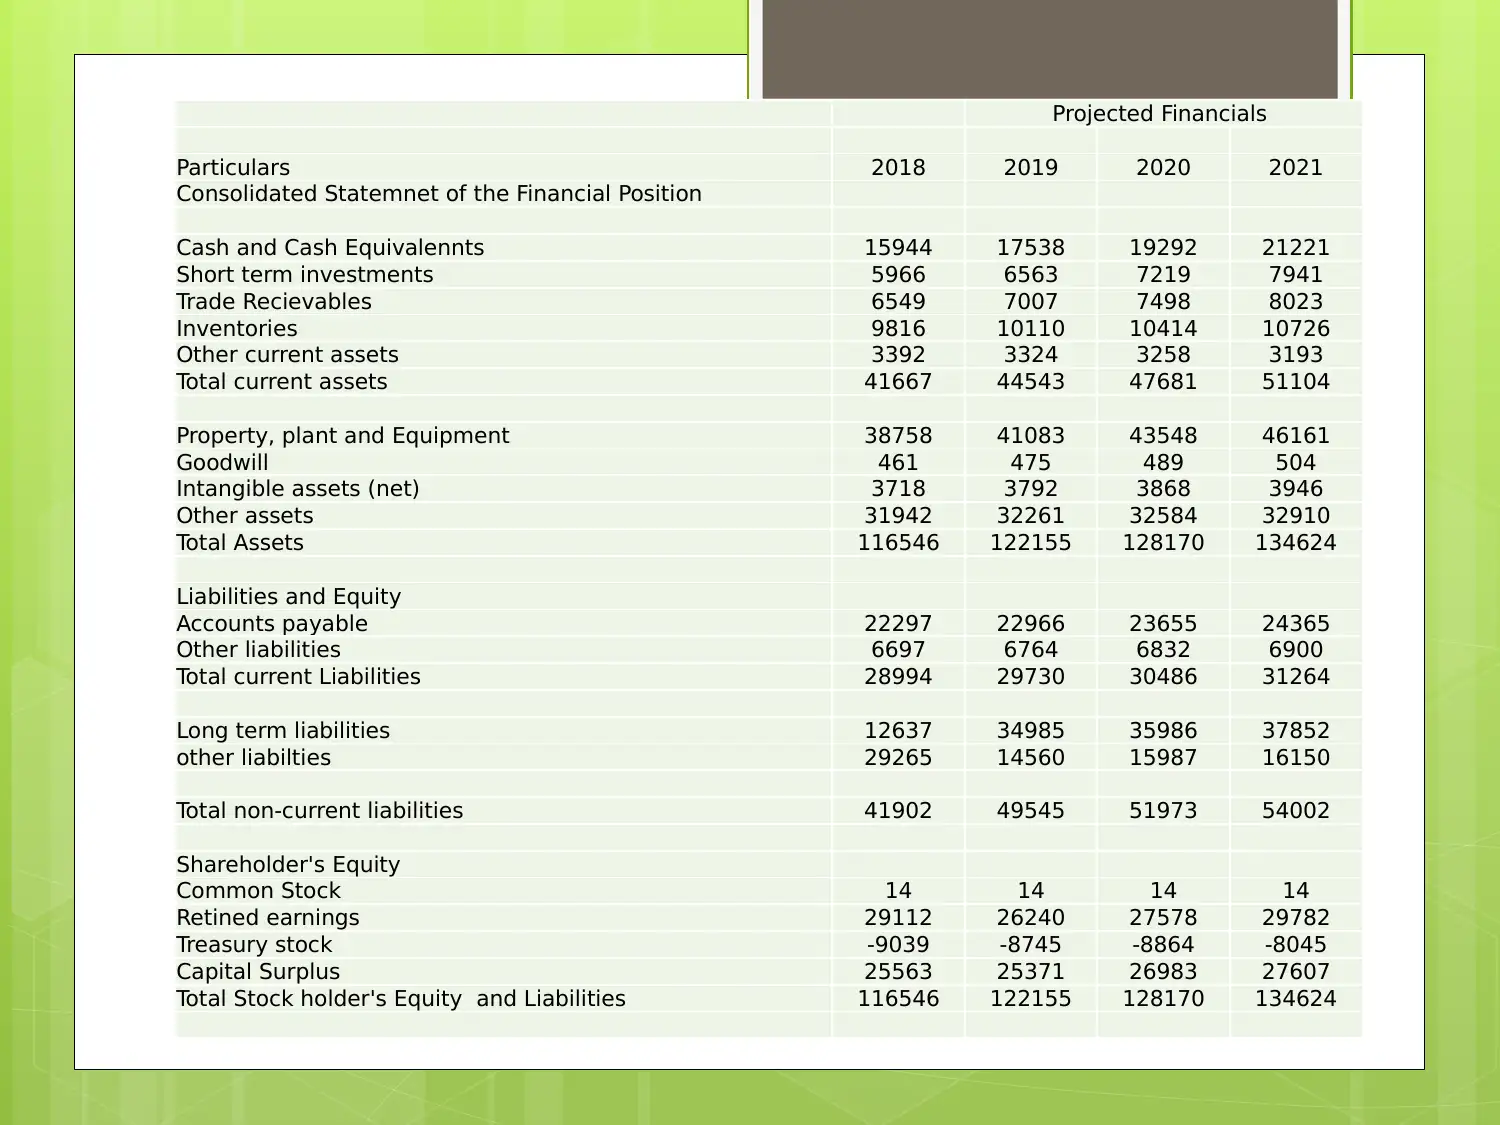
This report provides an executive summary and in-depth analysis of General Motors (GM), an American multinational corporation. It examines GM's business operations, financial performance, and investment strategies, including a focus on the company's expansion in the Chinese electric vehicle market. The report details the company's structure, regional segments, and business-type divisions, along with key financial data such as revenue and profit. It also explores market trends, including the development of new electric vehicle models. The report discusses how GM plans to utilize a $300,000 investment, emphasizing the potential use of debt and equity financing for electric car manufacturing. Furthermore, the report includes a business health assessment using ratio analysis to evaluate profitability, efficiency, liquidity, solvency, and market value. References from reputable sources are also included.

General
Motors
Motors
Paraphrase This Document
Need a fresh take? Get an instant paraphrase of this document with our AI Paraphraser

Executive Summary
General motors is an American
multinational corporation.
The report consists of the business and
the financial analysis of the GM
Moreover the company is trying to find
the ways to invest $300000
The company is expanding the business
in China, with the electric cars.
General motors is an American
multinational corporation.
The report consists of the business and
the financial analysis of the GM
Moreover the company is trying to find
the ways to invest $300000
The company is expanding the business
in China, with the electric cars.

Description of the Country
The automotive industry in China has been
termed as the largest since year 2008.
China provides a solid base for the
companies engaged in the business of the
automobiles globally.
China’s entry into the World trade
Organization accelerated the development
of the million of the vehicles.
The automotive industry in China has been
termed as the largest since year 2008.
China provides a solid base for the
companies engaged in the business of the
automobiles globally.
China’s entry into the World trade
Organization accelerated the development
of the million of the vehicles.
⊘ This is a preview!⊘
Do you want full access?
Subscribe today to unlock all pages.

Trusted by 1+ million students worldwide

Business description and
Structure
General Motors is commonly known as GE Motors
Its headquarters are in Detroit, Michigan US
The company came into existence in the year
1908, 110 years ago (General Motors, 2018).
The company has around 396 facilities on overall
six continents (General Motors, 2018).
The key persons involves in the business are Mary
T. Barra who is chairman as well as CEO of the
company.
The company operates in the automotive industry
Paraphrase This Document
Need a fresh take? Get an instant paraphrase of this document with our AI Paraphraser

Organizational Structure of
General Motors
The general motors has a regional division structure
notably as
Regional Segments
Business-Type Decisions
Corporate Functional Groups
The general motors regional segments involve
GM North America
GM Europe
GM International Operations
GM South America
The business-type divisions are
Automotive
GM Financial

Market and Company Analysis
Profit
The profit of the company is $7916
Revenue
The revenue of the company is $147049
Products services
The primary products delivered by the
company are automobiles, automobile
parts and the commercial vehicles.
Profit
The profit of the company is $7916
Revenue
The revenue of the company is $147049
Products services
The primary products delivered by the
company are automobiles, automobile
parts and the commercial vehicles.
⊘ This is a preview!⊘
Do you want full access?
Subscribe today to unlock all pages.

Trusted by 1+ million students worldwide

Market trends and development
According to GM the two new-vitality
models are to be included, the Velite 6
module half breed electric vehicle and the
Velite 6 electric vehicle to its new-vitality
armada, including the Regal Hybrid, Velite
5 and LaCrosse Hybrid, all sold under the
popular Buick identification.
All around, the organization has just said a
"significant" portion of GM's 20 new all-
electric vehicles to be presented by 2023
will be sold in China.
Paraphrase This Document
Need a fresh take? Get an instant paraphrase of this document with our AI Paraphraser

How to use the funds
The total value of $300000 is to be utilized for
the purpose of the initial investment.
The funds can be financed through the debt and
the equity. Since the debt ratio of the company
is smooth the company can invest majorly in the
development of the manufacturing of the
electric cars (South China Morning Post, 2018).
The products that are used in the development
of the electric car are the batteries, spare parts,
automobile engine.

Marketing and Sales
Operational Plan
Earnings Growth
It can be achieved by strong team
management. The costs savings are
expected around $2.4 billion (Panamore,
2018).
Disciplined capital allocation
Best-in-industry capital allocation
framework underpinned by transparency
Operational Plan
Earnings Growth
It can be achieved by strong team
management. The costs savings are
expected around $2.4 billion (Panamore,
2018).
Disciplined capital allocation
Best-in-industry capital allocation
framework underpinned by transparency
⊘ This is a preview!⊘
Do you want full access?
Subscribe today to unlock all pages.

Trusted by 1+ million students worldwide

Strong Protection and enhancement
With regards to robotized driving
innovation, the organization is
additionally adhering to its arrangement
of taking what it portrays as a
"progressive" course towards enormous
scale business generation of its key
model, the Cruise by 2019 (Kittaneh,
2018).
With regards to robotized driving
innovation, the organization is
additionally adhering to its arrangement
of taking what it portrays as a
"progressive" course towards enormous
scale business generation of its key
model, the Cruise by 2019 (Kittaneh,
2018).
Paraphrase This Document
Need a fresh take? Get an instant paraphrase of this document with our AI Paraphraser

Financial statement forecasts
Projected Financials
Particulars 2018 2019 2020 2021
Consolidated statements of income
Net Sales 147049 161754 177929 195722
Cost of the products sold 132771 139410 146380 153699
Gross profit 14278 22344 31549 42023
Research and development 0 0 0 0
Selling and administrative expenses 7545 7620 7697 7774
Earnings before interest and tax 6733 14724 23853 34250
Less: interest expenses 655 1340 1326 1390
Other income/expense net 1819 18450 19254 18654
Earnings before tax 7897 -5066 3273 14206
Provision for income tax 474 1021 1145 1210
Minority interest 3917 132 141 154
Net income/Loss 4454 -4177 4277 15262
Net income attributable to Kraft 4454 -4177 4277 15262
Preferred dividends
Net income attributable to common shareholders 4454 -4177 4277 15262

Projected Financials
Particulars 2018 2019 2020 2021
Consolidated Statemnet of the Financial Position
Cash and Cash Equivalennts 15944 17538 19292 21221
Short term investments 5966 6563 7219 7941
Trade Recievables 6549 7007 7498 8023
Inventories 9816 10110 10414 10726
Other current assets 3392 3324 3258 3193
Total current assets 41667 44543 47681 51104
Property, plant and Equipment 38758 41083 43548 46161
Goodwill 461 475 489 504
Intangible assets (net) 3718 3792 3868 3946
Other assets 31942 32261 32584 32910
Total Assets 116546 122155 128170 134624
Liabilities and Equity
Accounts payable 22297 22966 23655 24365
Other liabilities 6697 6764 6832 6900
Total current Liabilities 28994 29730 30486 31264
Long term liabilities 12637 34985 35986 37852
other liabilties 29265 14560 15987 16150
Total non-current liabilities 41902 49545 51973 54002
Shareholder's Equity
Common Stock 14 14 14 14
Retined earnings 29112 26240 27578 29782
Treasury stock -9039 -8745 -8864 -8045
Capital Surplus 25563 25371 26983 27607
Total Stock holder's Equity and Liabilities 116546 122155 128170 134624
⊘ This is a preview!⊘
Do you want full access?
Subscribe today to unlock all pages.

Trusted by 1+ million students worldwide
1 out of 19
Related Documents
Your All-in-One AI-Powered Toolkit for Academic Success.
+13062052269
info@desklib.com
Available 24*7 on WhatsApp / Email
Unlock your academic potential
Copyright © 2020–2025 A2Z Services. All Rights Reserved. Developed and managed by ZUCOL.


