Project Report: Analysis of Genetic Technologies Ltd. Financials
VerifiedAdded on 2020/05/08
|17
|4176
|469
Project
AI Summary
This project report provides a comprehensive financial analysis of Genetic Technologies Ltd. The report begins with an introduction and then delves into the company's financial performance, including debt valuation, share valuation, and cost of capital analysis. The analysis of debt valuation examines the company's short-term and long-term debt, comparing it to industry standards. The share valuation section uses various models, such as the dividend discount model and the PE multiple model, to assess the company's share price. The cost of capital analysis calculates the Weighted Average Cost of Capital (WACC), considering both debt and equity. The report also includes a market analysis, assessing the company's performance in relation to market conditions and providing recommendations for improvement. The conclusion summarizes the findings and suggests strategies for the company to optimize its capital structure and enhance its market share. References to financial websites and analyst reports are provided to support the analysis.

Running Head: Accounting
1
Project Report: Finance
1
Project Report: Finance
Paraphrase This Document
Need a fresh take? Get an instant paraphrase of this document with our AI Paraphraser
Accounting
2
Contents
Introduction of report........................................................................................................3
GENETIC TECHNOLOGIES LTD.................................................................................3
Analysis of Debt Valuation..............................................................................................3
Analysis of Share valuation..............................................................................................4
Analysis of Cost of capital................................................................................................6
Market analysis.................................................................................................................7
Conclusion........................................................................................................................8
References.........................................................................................................................9
Appendix.........................................................................................................................11
Accounting
3
Introduction of report:
Every individual has some savings with his or her. They save some amount form their
income or other sources to keep the amount for urgency or for raising the worth of that
amount. In this report, the share market has been analyzed in which the individual could
invest the amount and get back the amount whenever needed. This report has been prepared
over the comapny, Genetic technologies limited. This company’s financial performance and
the positive have been analyzed to depict the individual that whether they must invest into the
comapny or not. While preparing this report, analyst and various financial website have been
taken into the knowledge to get a better result.
GENETIC TECHNOLOGIES LTD:
GENETIC TECHONOLOGY LIMITED is a diagnostic comapny. This comapny
provides assessment and testing tolls to assist the physicians in managing the women’s health
proactively. This comapny has its operations into Australian as well as various other markets.
The comapny has a market of around $ 600 million annually. The performance and the
market share of the comapny is enhancing gradually (Home, 2017). And according to the
analysis over the comapny, future market of the comapny would be better.
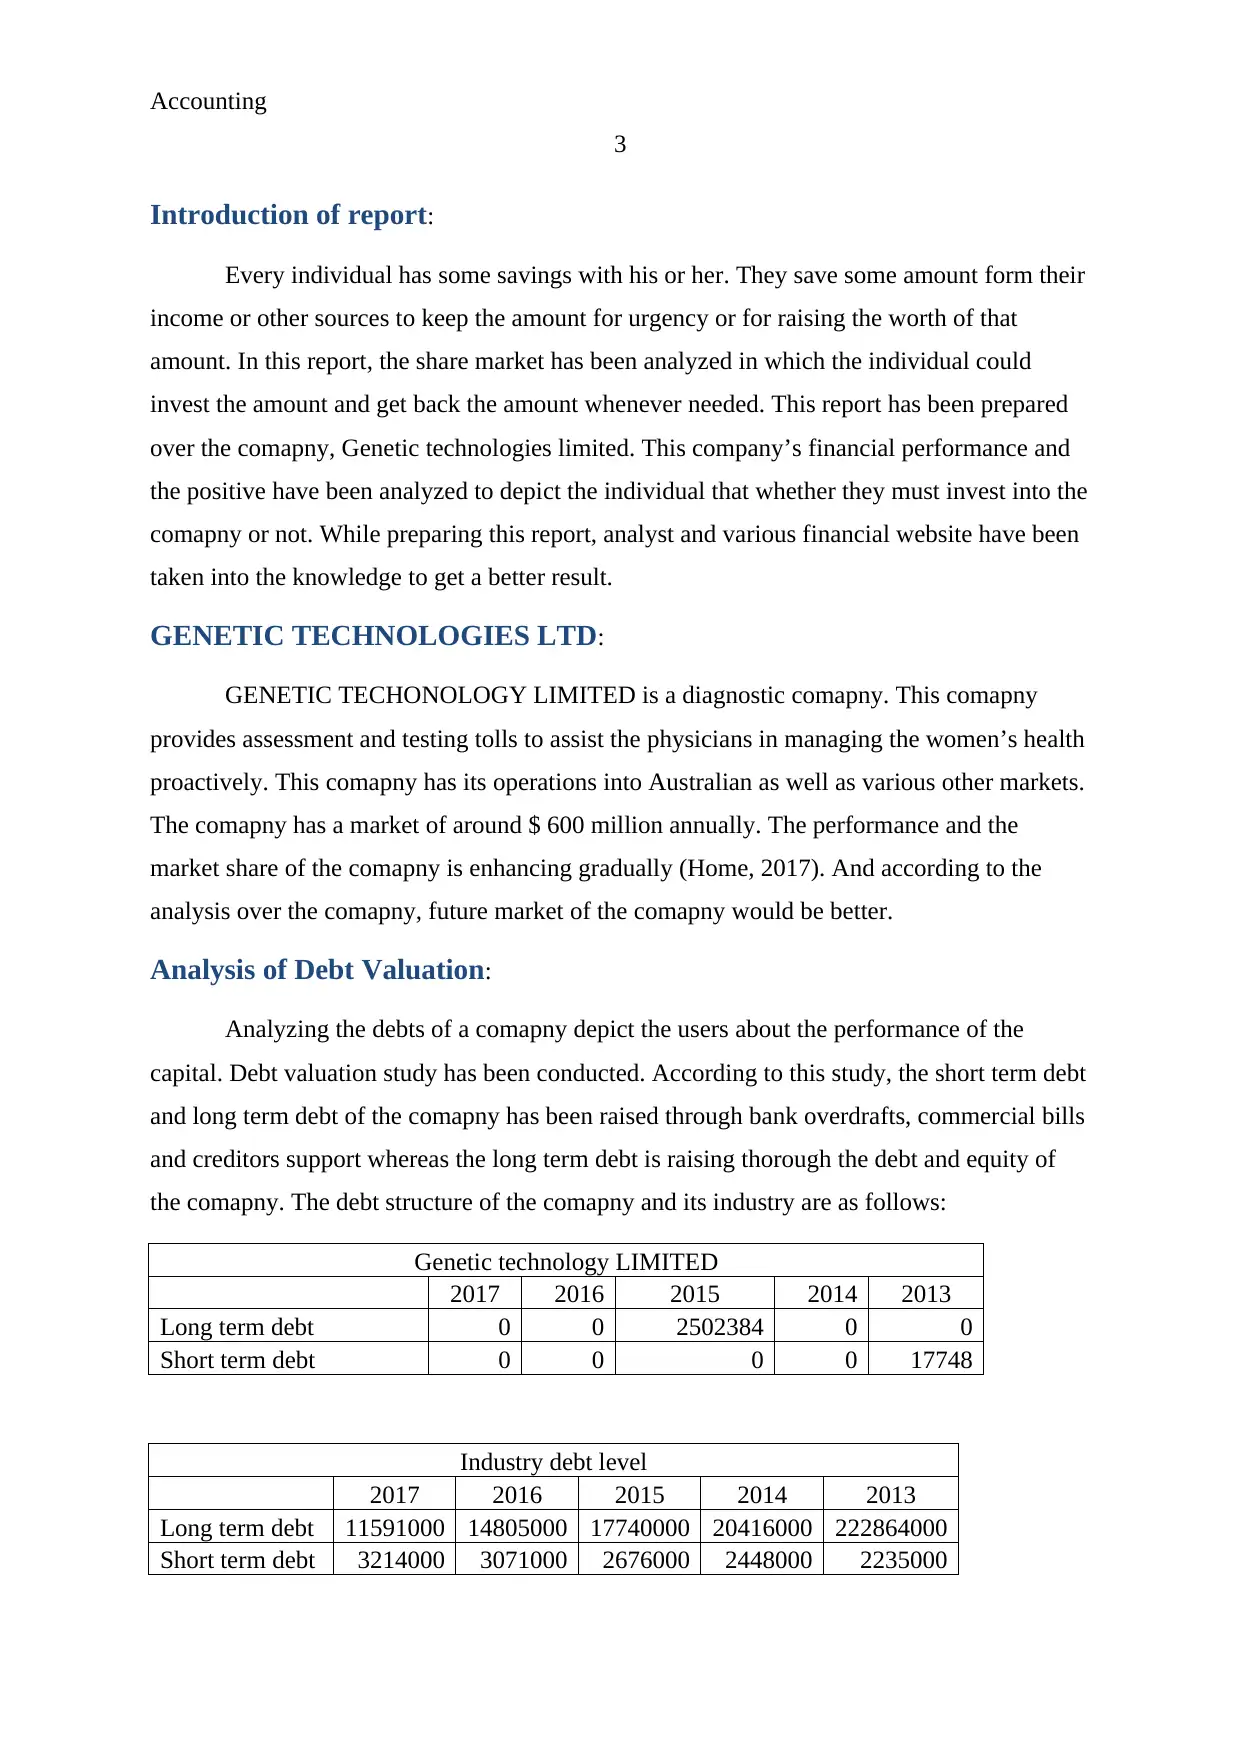
Analysis of Debt Valuation:
Analyzing the debts of a comapny depict the users about the performance of the
capital. Debt valuation study has been conducted. According to this study, the short term debt
and long term debt of the comapny has been raised through bank overdrafts, commercial bills
and creditors support whereas the long term debt is raising thorough the debt and equity of
the comapny. The debt structure of the comapny and its industry are as follows:
Genetic technology LIMITED
2017 2016 2015 2014 2013
Long term debt 0 0 2502384 0 0
Short term debt 0 0 0 0 17748
Industry debt level
2017 2016 2015 2014 2013
Long term debt 11591000 14805000 17740000 20416000 222864000
Short term debt 3214000 3071000 2676000 2448000 2235000
3
Introduction of report:
Every individual has some savings with his or her. They save some amount form their
income or other sources to keep the amount for urgency or for raising the worth of that
amount. In this report, the share market has been analyzed in which the individual could
invest the amount and get back the amount whenever needed. This report has been prepared
over the comapny, Genetic technologies limited. This company’s financial performance and
the positive have been analyzed to depict the individual that whether they must invest into the
comapny or not. While preparing this report, analyst and various financial website have been
taken into the knowledge to get a better result.
GENETIC TECHNOLOGIES LTD:
GENETIC TECHONOLOGY LIMITED is a diagnostic comapny. This comapny
provides assessment and testing tolls to assist the physicians in managing the women’s health
proactively. This comapny has its operations into Australian as well as various other markets.
The comapny has a market of around $ 600 million annually. The performance and the
market share of the comapny is enhancing gradually (Home, 2017). And according to the
analysis over the comapny, future market of the comapny would be better.
Analysis of Debt Valuation:
Analyzing the debts of a comapny depict the users about the performance of the
capital. Debt valuation study has been conducted. According to this study, the short term debt
and long term debt of the comapny has been raised through bank overdrafts, commercial bills
and creditors support whereas the long term debt is raising thorough the debt and equity of
the comapny. The debt structure of the comapny and its industry are as follows:
Genetic technology LIMITED
2017 2016 2015 2014 2013
Long term debt 0 0 2502384 0 0
Short term debt 0 0 0 0 17748
Industry debt level
2017 2016 2015 2014 2013
Long term debt 11591000 14805000 17740000 20416000 222864000
Short term debt 3214000 3071000 2676000 2448000 2235000
⊘ This is a preview!⊘
Do you want full access?
Subscribe today to unlock all pages.
Trusted by 1+ million students worldwide
Accounting
4
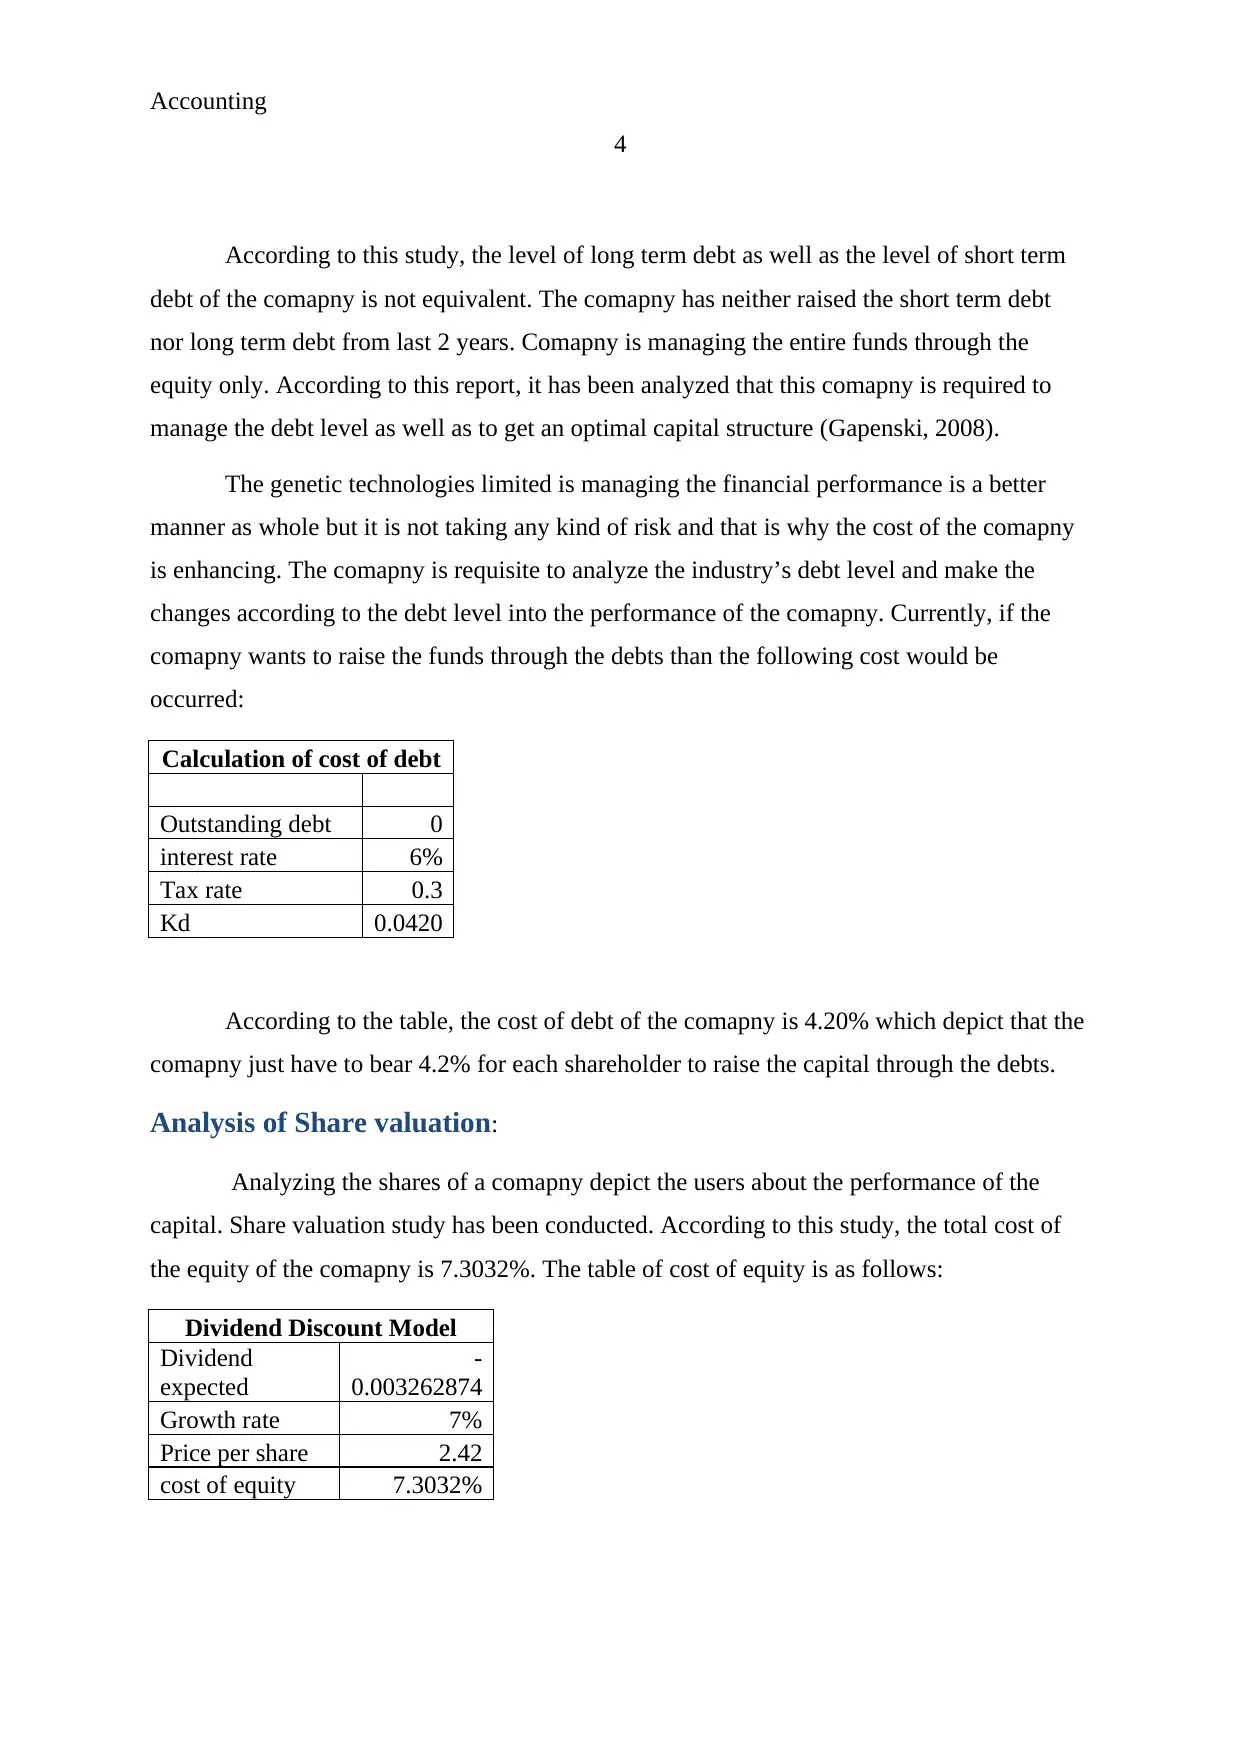
According to this study, the level of long term debt as well as the level of short term
debt of the comapny is not equivalent. The comapny has neither raised the short term debt
nor long term debt from last 2 years. Comapny is managing the entire funds through the
equity only. According to this report, it has been analyzed that this comapny is required to
manage the debt level as well as to get an optimal capital structure (Gapenski, 2008).
The genetic technologies limited is managing the financial performance is a better
manner as whole but it is not taking any kind of risk and that is why the cost of the comapny
is enhancing. The comapny is requisite to analyze the industry’s debt level and make the
changes according to the debt level into the performance of the comapny. Currently, if the
comapny wants to raise the funds through the debts than the following cost would be
occurred:
Calculation of cost of debt
Outstanding debt 0
interest rate 6%
Tax rate 0.3
Kd 0.0420
According to the table, the cost of debt of the comapny is 4.20% which depict that the
comapny just have to bear 4.2% for each shareholder to raise the capital through the debts.
Analysis of Share valuation:
Analyzing the shares of a comapny depict the users about the performance of the
capital. Share valuation study has been conducted. According to this study, the total cost of
the equity of the comapny is 7.3032%. The table of cost of equity is as follows:
Dividend Discount Model
Dividend
expected
-
0.003262874
Growth rate 7%
Price per share 2.42
cost of equity 7.3032%
4
According to this study, the level of long term debt as well as the level of short term
debt of the comapny is not equivalent. The comapny has neither raised the short term debt
nor long term debt from last 2 years. Comapny is managing the entire funds through the
equity only. According to this report, it has been analyzed that this comapny is required to
manage the debt level as well as to get an optimal capital structure (Gapenski, 2008).
The genetic technologies limited is managing the financial performance is a better
manner as whole but it is not taking any kind of risk and that is why the cost of the comapny
is enhancing. The comapny is requisite to analyze the industry’s debt level and make the
changes according to the debt level into the performance of the comapny. Currently, if the
comapny wants to raise the funds through the debts than the following cost would be
occurred:
Calculation of cost of debt
Outstanding debt 0
interest rate 6%
Tax rate 0.3
Kd 0.0420
According to the table, the cost of debt of the comapny is 4.20% which depict that the
comapny just have to bear 4.2% for each shareholder to raise the capital through the debts.
Analysis of Share valuation:
Analyzing the shares of a comapny depict the users about the performance of the
capital. Share valuation study has been conducted. According to this study, the total cost of
the equity of the comapny is 7.3032%. The table of cost of equity is as follows:
Dividend Discount Model
Dividend
expected
-
0.003262874
Growth rate 7%
Price per share 2.42
cost of equity 7.3032%
Paraphrase This Document
Need a fresh take? Get an instant paraphrase of this document with our AI Paraphraser
Accounting
5
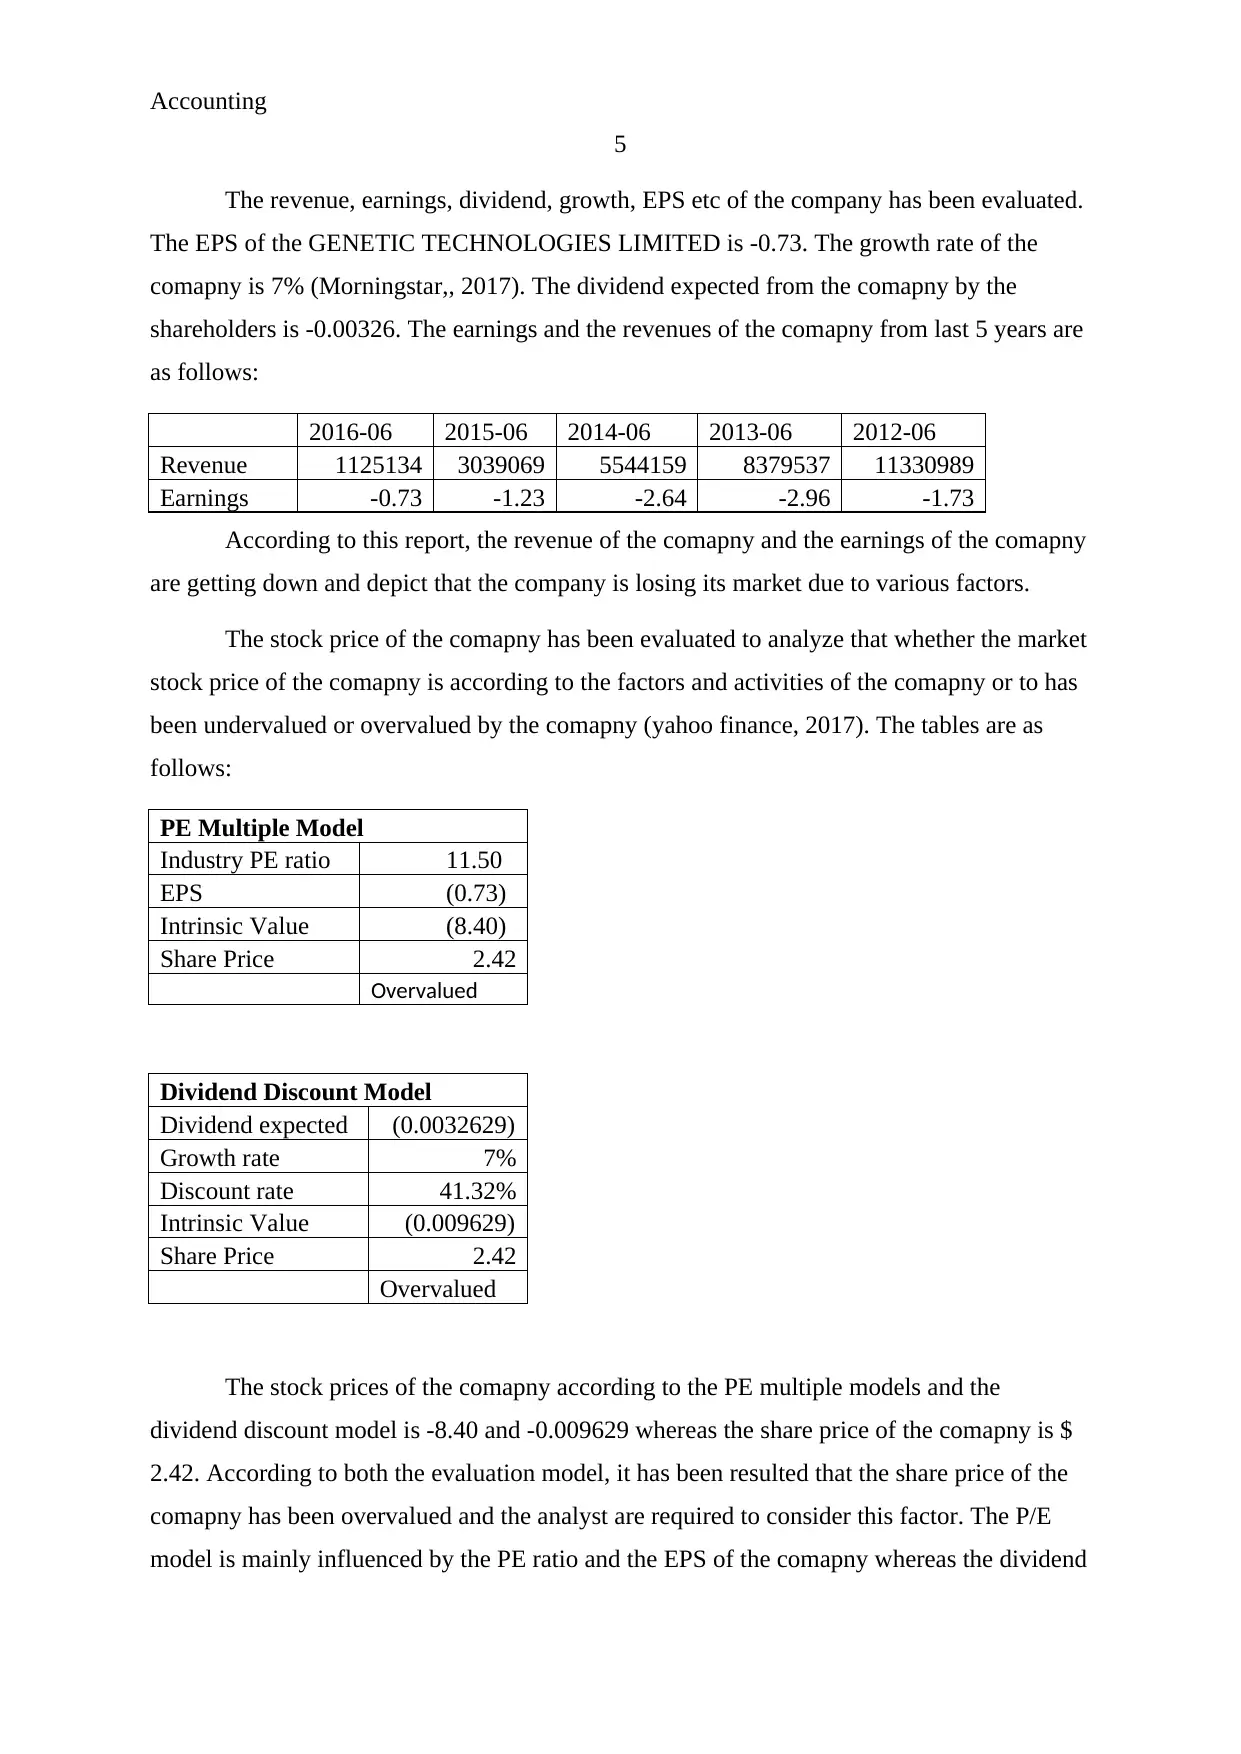
The revenue, earnings, dividend, growth, EPS etc of the company has been evaluated.
The EPS of the GENETIC TECHNOLOGIES LIMITED is -0.73. The growth rate of the
comapny is 7% (Morningstar,, 2017). The dividend expected from the comapny by the
shareholders is -0.00326. The earnings and the revenues of the comapny from last 5 years are
as follows:
2016-06 2015-06 2014-06 2013-06 2012-06
Revenue 1125134 3039069 5544159 8379537 11330989
Earnings -0.73 -1.23 -2.64 -2.96 -1.73
According to this report, the revenue of the comapny and the earnings of the comapny
are getting down and depict that the company is losing its market due to various factors.
The stock price of the comapny has been evaluated to analyze that whether the market
stock price of the comapny is according to the factors and activities of the comapny or to has
been undervalued or overvalued by the comapny (yahoo finance, 2017). The tables are as
follows:
PE Multiple Model
Industry PE ratio 11.50
EPS (0.73)
Intrinsic Value (8.40)
Share Price 2.42
Overvalued
Dividend Discount Model
Dividend expected (0.0032629)
Growth rate 7%
Discount rate 41.32%
Intrinsic Value (0.009629)
Share Price 2.42
Overvalued
The stock prices of the comapny according to the PE multiple models and the
dividend discount model is -8.40 and -0.009629 whereas the share price of the comapny is $
2.42. According to both the evaluation model, it has been resulted that the share price of the
comapny has been overvalued and the analyst are required to consider this factor. The P/E
model is mainly influenced by the PE ratio and the EPS of the comapny whereas the dividend
5
The revenue, earnings, dividend, growth, EPS etc of the company has been evaluated.
The EPS of the GENETIC TECHNOLOGIES LIMITED is -0.73. The growth rate of the
comapny is 7% (Morningstar,, 2017). The dividend expected from the comapny by the
shareholders is -0.00326. The earnings and the revenues of the comapny from last 5 years are
as follows:
2016-06 2015-06 2014-06 2013-06 2012-06
Revenue 1125134 3039069 5544159 8379537 11330989
Earnings -0.73 -1.23 -2.64 -2.96 -1.73
According to this report, the revenue of the comapny and the earnings of the comapny
are getting down and depict that the company is losing its market due to various factors.
The stock price of the comapny has been evaluated to analyze that whether the market
stock price of the comapny is according to the factors and activities of the comapny or to has
been undervalued or overvalued by the comapny (yahoo finance, 2017). The tables are as
follows:
PE Multiple Model
Industry PE ratio 11.50
EPS (0.73)
Intrinsic Value (8.40)
Share Price 2.42
Overvalued
Dividend Discount Model
Dividend expected (0.0032629)
Growth rate 7%
Discount rate 41.32%
Intrinsic Value (0.009629)
Share Price 2.42
Overvalued
The stock prices of the comapny according to the PE multiple models and the
dividend discount model is -8.40 and -0.009629 whereas the share price of the comapny is $
2.42. According to both the evaluation model, it has been resulted that the share price of the
comapny has been overvalued and the analyst are required to consider this factor. The P/E
model is mainly influenced by the PE ratio and the EPS of the comapny whereas the dividend
Accounting
6
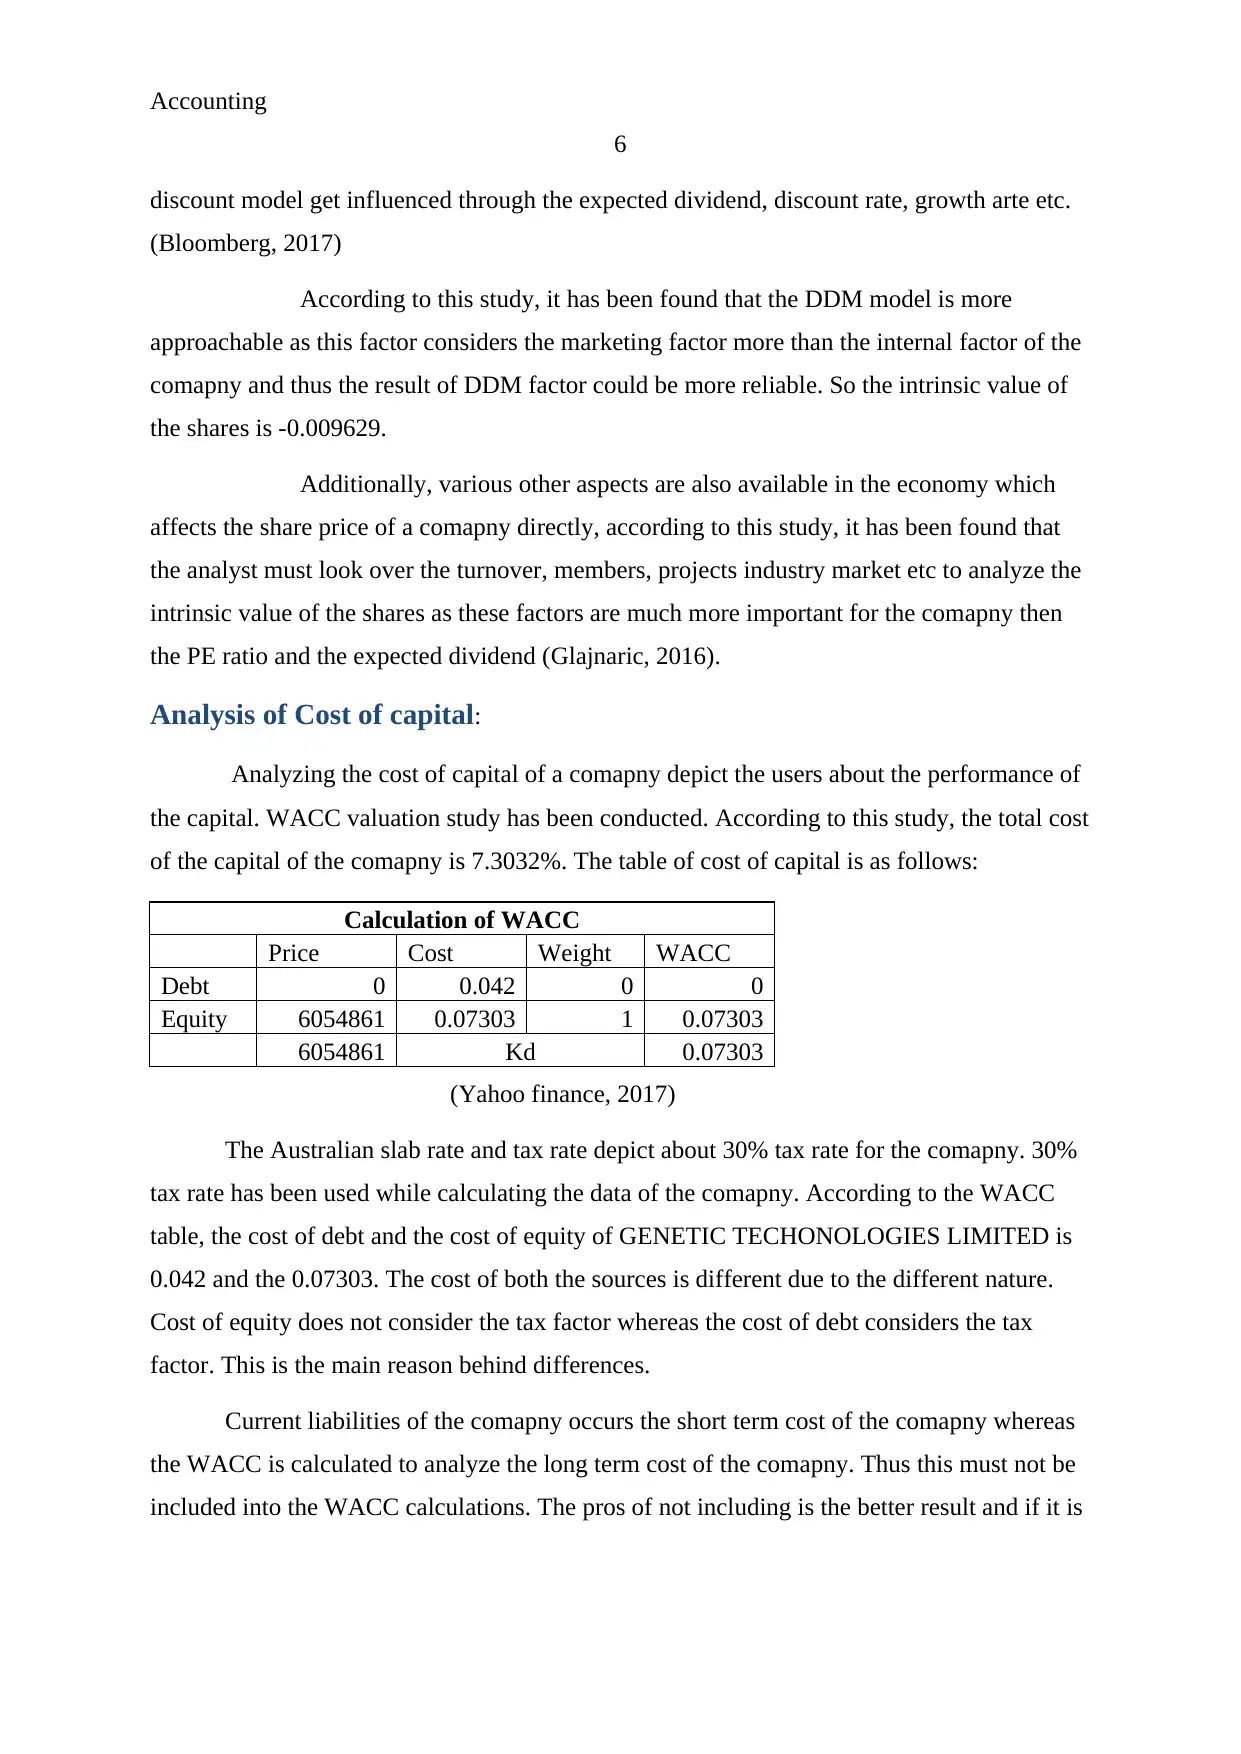
discount model get influenced through the expected dividend, discount rate, growth arte etc.
(Bloomberg, 2017)
According to this study, it has been found that the DDM model is more
approachable as this factor considers the marketing factor more than the internal factor of the
comapny and thus the result of DDM factor could be more reliable. So the intrinsic value of
the shares is -0.009629.
Additionally, various other aspects are also available in the economy which
affects the share price of a comapny directly, according to this study, it has been found that
the analyst must look over the turnover, members, projects industry market etc to analyze the
intrinsic value of the shares as these factors are much more important for the comapny then
the PE ratio and the expected dividend (Glajnaric, 2016).
Analysis of Cost of capital:
Analyzing the cost of capital of a comapny depict the users about the performance of
the capital. WACC valuation study has been conducted. According to this study, the total cost
of the capital of the comapny is 7.3032%. The table of cost of capital is as follows:
Calculation of WACC
Price Cost Weight WACC
Debt 0 0.042 0 0
Equity 6054861 0.07303 1 0.07303
6054861 Kd 0.07303
(Yahoo finance, 2017)
The Australian slab rate and tax rate depict about 30% tax rate for the comapny. 30%
tax rate has been used while calculating the data of the comapny. According to the WACC
table, the cost of debt and the cost of equity of GENETIC TECHONOLOGIES LIMITED is
0.042 and the 0.07303. The cost of both the sources is different due to the different nature.
Cost of equity does not consider the tax factor whereas the cost of debt considers the tax
factor. This is the main reason behind differences.
Current liabilities of the comapny occurs the short term cost of the comapny whereas
the WACC is calculated to analyze the long term cost of the comapny. Thus this must not be
included into the WACC calculations. The pros of not including is the better result and if it is
6
discount model get influenced through the expected dividend, discount rate, growth arte etc.
(Bloomberg, 2017)
According to this study, it has been found that the DDM model is more
approachable as this factor considers the marketing factor more than the internal factor of the
comapny and thus the result of DDM factor could be more reliable. So the intrinsic value of
the shares is -0.009629.
Additionally, various other aspects are also available in the economy which
affects the share price of a comapny directly, according to this study, it has been found that
the analyst must look over the turnover, members, projects industry market etc to analyze the
intrinsic value of the shares as these factors are much more important for the comapny then
the PE ratio and the expected dividend (Glajnaric, 2016).
Analysis of Cost of capital:
Analyzing the cost of capital of a comapny depict the users about the performance of
the capital. WACC valuation study has been conducted. According to this study, the total cost
of the capital of the comapny is 7.3032%. The table of cost of capital is as follows:
Calculation of WACC
Price Cost Weight WACC
Debt 0 0.042 0 0
Equity 6054861 0.07303 1 0.07303
6054861 Kd 0.07303
(Yahoo finance, 2017)
The Australian slab rate and tax rate depict about 30% tax rate for the comapny. 30%
tax rate has been used while calculating the data of the comapny. According to the WACC
table, the cost of debt and the cost of equity of GENETIC TECHONOLOGIES LIMITED is
0.042 and the 0.07303. The cost of both the sources is different due to the different nature.
Cost of equity does not consider the tax factor whereas the cost of debt considers the tax
factor. This is the main reason behind differences.
Current liabilities of the comapny occurs the short term cost of the comapny whereas
the WACC is calculated to analyze the long term cost of the comapny. Thus this must not be
included into the WACC calculations. The pros of not including is the better result and if it is
⊘ This is a preview!⊘
Do you want full access?
Subscribe today to unlock all pages.
Trusted by 1+ million students worldwide
Accounting
7
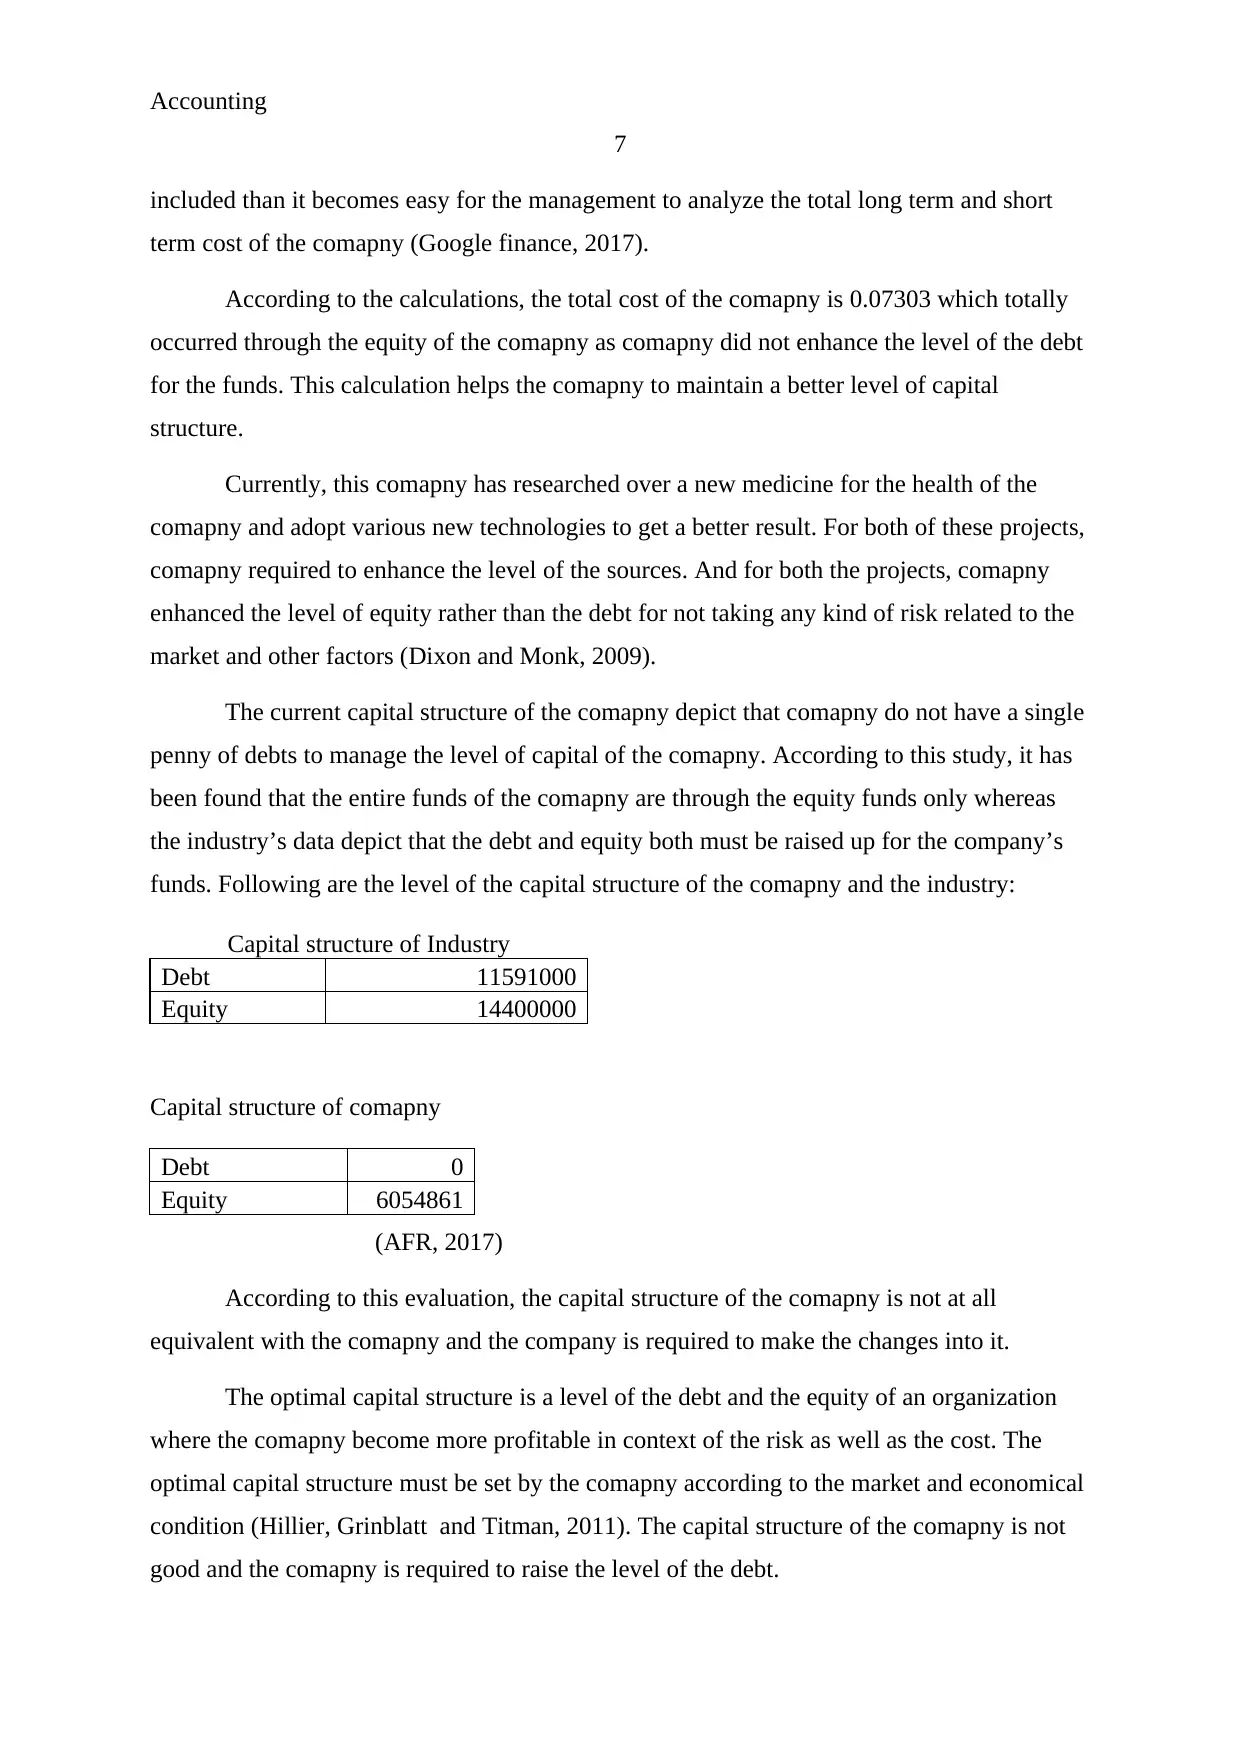
included than it becomes easy for the management to analyze the total long term and short
term cost of the comapny (Google finance, 2017).
According to the calculations, the total cost of the comapny is 0.07303 which totally
occurred through the equity of the comapny as comapny did not enhance the level of the debt
for the funds. This calculation helps the comapny to maintain a better level of capital
structure.
Currently, this comapny has researched over a new medicine for the health of the
comapny and adopt various new technologies to get a better result. For both of these projects,
comapny required to enhance the level of the sources. And for both the projects, comapny
enhanced the level of equity rather than the debt for not taking any kind of risk related to the
market and other factors (Dixon and Monk, 2009).
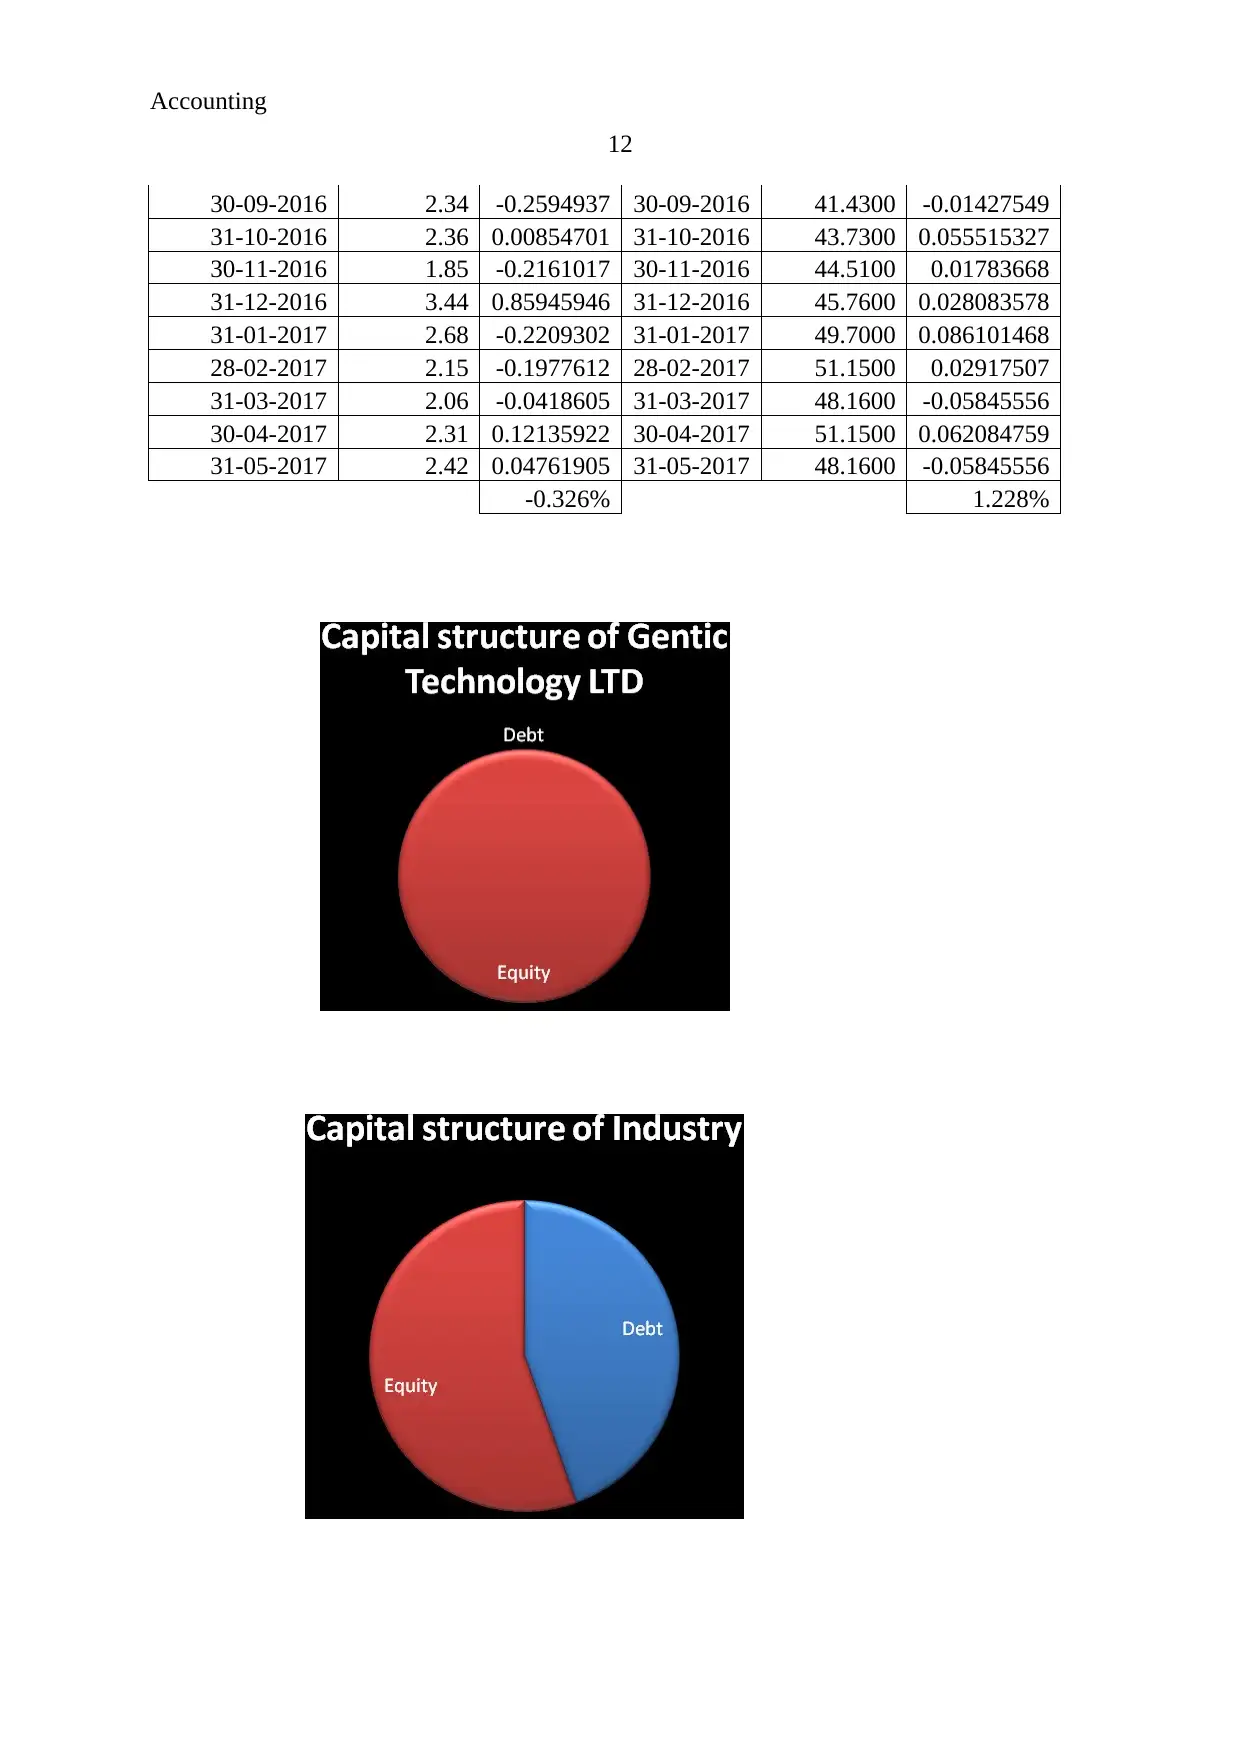
The current capital structure of the comapny depict that comapny do not have a single
penny of debts to manage the level of capital of the comapny. According to this study, it has
been found that the entire funds of the comapny are through the equity funds only whereas
the industry’s data depict that the debt and equity both must be raised up for the company’s
funds. Following are the level of the capital structure of the comapny and the industry:
Capital structure of Industry
Debt 11591000
Equity 14400000
Capital structure of comapny
Debt 0
Equity 6054861
(AFR, 2017)
According to this evaluation, the capital structure of the comapny is not at all
equivalent with the comapny and the company is required to make the changes into it.
The optimal capital structure is a level of the debt and the equity of an organization
where the comapny become more profitable in context of the risk as well as the cost. The
optimal capital structure must be set by the comapny according to the market and economical
condition (Hillier, Grinblatt and Titman, 2011). The capital structure of the comapny is not
good and the comapny is required to raise the level of the debt.
7
included than it becomes easy for the management to analyze the total long term and short
term cost of the comapny (Google finance, 2017).
According to the calculations, the total cost of the comapny is 0.07303 which totally
occurred through the equity of the comapny as comapny did not enhance the level of the debt
for the funds. This calculation helps the comapny to maintain a better level of capital
structure.
Currently, this comapny has researched over a new medicine for the health of the
comapny and adopt various new technologies to get a better result. For both of these projects,
comapny required to enhance the level of the sources. And for both the projects, comapny
enhanced the level of equity rather than the debt for not taking any kind of risk related to the
market and other factors (Dixon and Monk, 2009).
The current capital structure of the comapny depict that comapny do not have a single
penny of debts to manage the level of capital of the comapny. According to this study, it has
been found that the entire funds of the comapny are through the equity funds only whereas
the industry’s data depict that the debt and equity both must be raised up for the company’s
funds. Following are the level of the capital structure of the comapny and the industry:
Capital structure of Industry
Debt 11591000
Equity 14400000
Capital structure of comapny
Debt 0
Equity 6054861
(AFR, 2017)
According to this evaluation, the capital structure of the comapny is not at all
equivalent with the comapny and the company is required to make the changes into it.
The optimal capital structure is a level of the debt and the equity of an organization
where the comapny become more profitable in context of the risk as well as the cost. The
optimal capital structure must be set by the comapny according to the market and economical
condition (Hillier, Grinblatt and Titman, 2011). The capital structure of the comapny is not
good and the comapny is required to raise the level of the debt.
Paraphrase This Document
Need a fresh take? Get an instant paraphrase of this document with our AI Paraphraser
Accounting
8
Market analysis:
Market analysis study has been performed over the GENTIC TECHONOLOGIES
LIMITED to analyze that whether the performance of the comapny is according to the market
condition or not (Jiashu, 2009). The financial performance of the comapny is decreasing by a
great level and the comapny is required to maintain and enhance it.
Various financial analyst studies have been read over the comapny and it has been
analyzed that the performance of the comapny is not at all good. Comapny is required to
make various changes into its performance to manage the level of the revenue as well as the
capital structure (Voelkl and Fritz, 2017). The capital structure of the comapny is not optimal
and the managers are suggested to enhance the level of the debt so that the risk could be
average and the cost of capital could be reduced (Morningstar, 2017). Comapny is required to
make the changes into its financial policies to maintain the market (Yahoo finnce, 2017). The
health factors are increasing and comapny must use this opportunity to enhance and grab the
market share (Google finance, 2017).
Conclusion:
To conclude, the comapny has failed to manage the activities and opportunities in a
better manner. Company is required to reduce the level of the equity and enhance the level of
debt to make an optimal structure of the capital and comapny must grab the opportunity and
enhance the level of the market share.
Accounting
9
References:
AFR. 2017. GENETIC TECHONOLOGY LTD. Retrieved from
http://www.afr.com/research-tools/GNEE/company-profile/operational-history available on
14th Oct 2017.
Bloomberg. 2017. GENETIC TECHONOLOGY LTD. Retrieved from
https://www.bloomberg.com/quote/GENE:AU available on 14th Oct 2017.
Dixon, A.D. and Monk, A.H., 2009. The power of finance: accounting harmonization's effect
on pension provision. Journal of Economic Geography, 9(5), pp.619-639.
Gapenski, L.C., 2008. Healthcare finance: an introduction to accounting and financial
management. Health Administration Press.
Glajnaric, M., 2016. The importance of dividend paying stocks. Equity, 30(2), p.6.
Google finance. 2017. GENETIC TECHONOLOGY LTD. Retrieved from
http://finance.google.com/finance?q=ASX:GENE available on 14th Oct 2017.
Hillier, D., Grinblatt, M. and Titman, S., 2011. Financial markets and corporate strategy.
McGraw Hill.
Home. 2017. GENETIC TECHONOLOGY LTD. Retrieved from http://gtgcorporate.com/
available on 14th Oct 2017.
Jiashu, G., 2009. Study on Fair Value Accounting——on the essential characteristics of
financial accounting [J]. Accounting Research, 5, p.003.
Morningstar. 2017. GENETIC TECHONOLOGY LTD. Reterived from
http://financials.morningstar.com/company-profile/c.action?
t=GENE®ion=usa&culture=en-US available on 14th Oct 2017.
⊘ This is a preview!⊘
Do you want full access?
Subscribe today to unlock all pages.
Trusted by 1+ million students worldwide
Accounting
10
Voelkl, B. and Fritz, J., 2017. Relation between travel strategy and social organization of
migrating birds with special consideration of formation flight in the northern bald ibis. Phil.
Trans. R. Soc. B, 372(1727), p.20160235.
Yahoo finance. 2017. GENETIC TECHNOLOGY LIMITED. Retrieved from
https://finance.yahoo.com/quote/gene.ax?ltr=1 available on 3rd Oct 2017.
Paraphrase This Document
Need a fresh take? Get an instant paraphrase of this document with our AI Paraphraser
Accounting
11
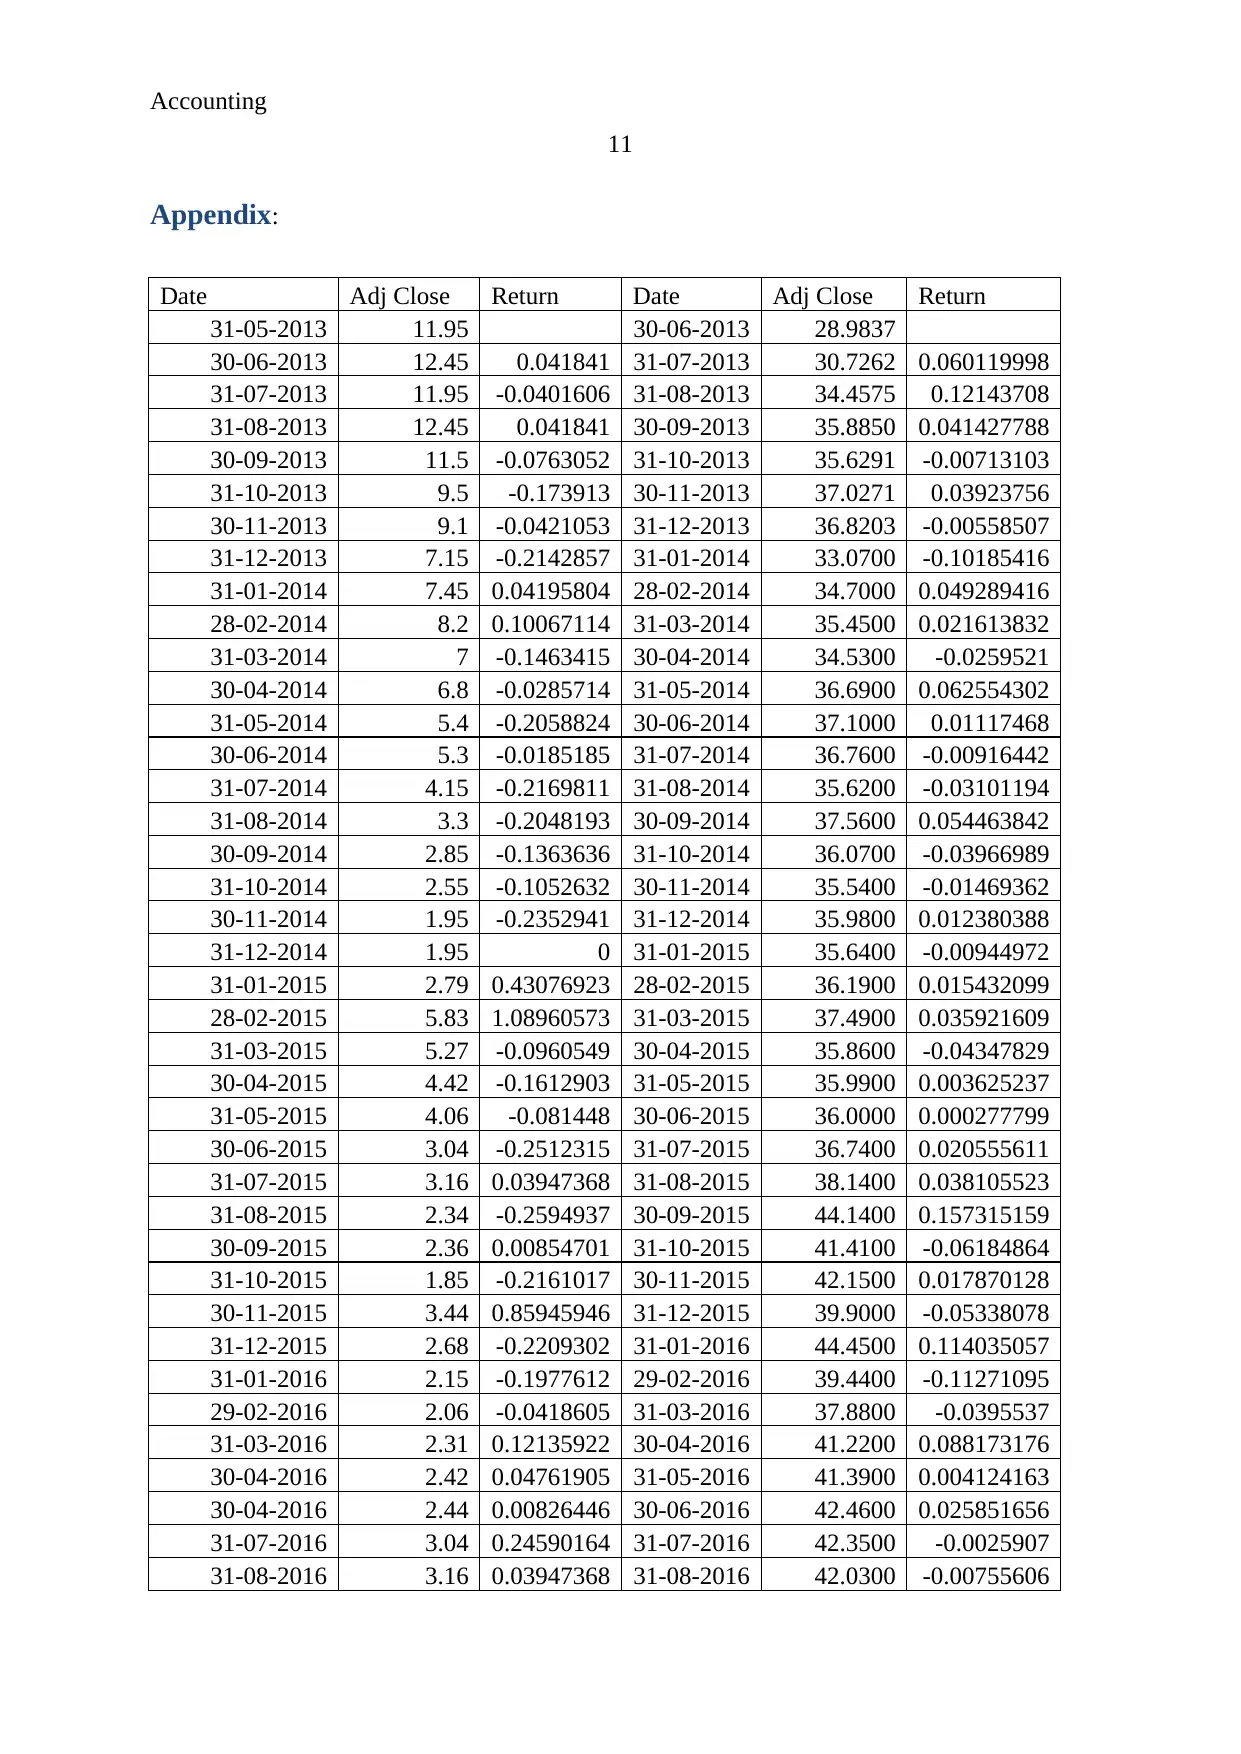
Appendix:
Date Adj Close Return Date Adj Close Return
31-05-2013 11.95 30-06-2013 28.9837
30-06-2013 12.45 0.041841 31-07-2013 30.7262 0.060119998
31-07-2013 11.95 -0.0401606 31-08-2013 34.4575 0.12143708
31-08-2013 12.45 0.041841 30-09-2013 35.8850 0.041427788
30-09-2013 11.5 -0.0763052 31-10-2013 35.6291 -0.00713103
31-10-2013 9.5 -0.173913 30-11-2013 37.0271 0.03923756
30-11-2013 9.1 -0.0421053 31-12-2013 36.8203 -0.00558507
31-12-2013 7.15 -0.2142857 31-01-2014 33.0700 -0.10185416
31-01-2014 7.45 0.04195804 28-02-2014 34.7000 0.049289416
28-02-2014 8.2 0.10067114 31-03-2014 35.4500 0.021613832
31-03-2014 7 -0.1463415 30-04-2014 34.5300 -0.0259521
30-04-2014 6.8 -0.0285714 31-05-2014 36.6900 0.062554302
31-05-2014 5.4 -0.2058824 30-06-2014 37.1000 0.01117468
30-06-2014 5.3 -0.0185185 31-07-2014 36.7600 -0.00916442
31-07-2014 4.15 -0.2169811 31-08-2014 35.6200 -0.03101194
31-08-2014 3.3 -0.2048193 30-09-2014 37.5600 0.054463842
30-09-2014 2.85 -0.1363636 31-10-2014 36.0700 -0.03966989
31-10-2014 2.55 -0.1052632 30-11-2014 35.5400 -0.01469362
30-11-2014 1.95 -0.2352941 31-12-2014 35.9800 0.012380388
31-12-2014 1.95 0 31-01-2015 35.6400 -0.00944972
31-01-2015 2.79 0.43076923 28-02-2015 36.1900 0.015432099
28-02-2015 5.83 1.08960573 31-03-2015 37.4900 0.035921609
31-03-2015 5.27 -0.0960549 30-04-2015 35.8600 -0.04347829
30-04-2015 4.42 -0.1612903 31-05-2015 35.9900 0.003625237
31-05-2015 4.06 -0.081448 30-06-2015 36.0000 0.000277799
30-06-2015 3.04 -0.2512315 31-07-2015 36.7400 0.020555611
31-07-2015 3.16 0.03947368 31-08-2015 38.1400 0.038105523
31-08-2015 2.34 -0.2594937 30-09-2015 44.1400 0.157315159
30-09-2015 2.36 0.00854701 31-10-2015 41.4100 -0.06184864
31-10-2015 1.85 -0.2161017 30-11-2015 42.1500 0.017870128
30-11-2015 3.44 0.85945946 31-12-2015 39.9000 -0.05338078
31-12-2015 2.68 -0.2209302 31-01-2016 44.4500 0.114035057
31-01-2016 2.15 -0.1977612 29-02-2016 39.4400 -0.11271095
29-02-2016 2.06 -0.0418605 31-03-2016 37.8800 -0.0395537
31-03-2016 2.31 0.12135922 30-04-2016 41.2200 0.088173176
30-04-2016 2.42 0.04761905 31-05-2016 41.3900 0.004124163
30-04-2016 2.44 0.00826446 30-06-2016 42.4600 0.025851656
31-07-2016 3.04 0.24590164 31-07-2016 42.3500 -0.0025907
31-08-2016 3.16 0.03947368 31-08-2016 42.0300 -0.00755606
11
Appendix:
Date Adj Close Return Date Adj Close Return
31-05-2013 11.95 30-06-2013 28.9837
30-06-2013 12.45 0.041841 31-07-2013 30.7262 0.060119998
31-07-2013 11.95 -0.0401606 31-08-2013 34.4575 0.12143708
31-08-2013 12.45 0.041841 30-09-2013 35.8850 0.041427788
30-09-2013 11.5 -0.0763052 31-10-2013 35.6291 -0.00713103
31-10-2013 9.5 -0.173913 30-11-2013 37.0271 0.03923756
30-11-2013 9.1 -0.0421053 31-12-2013 36.8203 -0.00558507
31-12-2013 7.15 -0.2142857 31-01-2014 33.0700 -0.10185416
31-01-2014 7.45 0.04195804 28-02-2014 34.7000 0.049289416
28-02-2014 8.2 0.10067114 31-03-2014 35.4500 0.021613832
31-03-2014 7 -0.1463415 30-04-2014 34.5300 -0.0259521
30-04-2014 6.8 -0.0285714 31-05-2014 36.6900 0.062554302
31-05-2014 5.4 -0.2058824 30-06-2014 37.1000 0.01117468
30-06-2014 5.3 -0.0185185 31-07-2014 36.7600 -0.00916442
31-07-2014 4.15 -0.2169811 31-08-2014 35.6200 -0.03101194
31-08-2014 3.3 -0.2048193 30-09-2014 37.5600 0.054463842
30-09-2014 2.85 -0.1363636 31-10-2014 36.0700 -0.03966989
31-10-2014 2.55 -0.1052632 30-11-2014 35.5400 -0.01469362
30-11-2014 1.95 -0.2352941 31-12-2014 35.9800 0.012380388
31-12-2014 1.95 0 31-01-2015 35.6400 -0.00944972
31-01-2015 2.79 0.43076923 28-02-2015 36.1900 0.015432099
28-02-2015 5.83 1.08960573 31-03-2015 37.4900 0.035921609
31-03-2015 5.27 -0.0960549 30-04-2015 35.8600 -0.04347829
30-04-2015 4.42 -0.1612903 31-05-2015 35.9900 0.003625237
31-05-2015 4.06 -0.081448 30-06-2015 36.0000 0.000277799
30-06-2015 3.04 -0.2512315 31-07-2015 36.7400 0.020555611
31-07-2015 3.16 0.03947368 31-08-2015 38.1400 0.038105523
31-08-2015 2.34 -0.2594937 30-09-2015 44.1400 0.157315159
30-09-2015 2.36 0.00854701 31-10-2015 41.4100 -0.06184864
31-10-2015 1.85 -0.2161017 30-11-2015 42.1500 0.017870128
30-11-2015 3.44 0.85945946 31-12-2015 39.9000 -0.05338078
31-12-2015 2.68 -0.2209302 31-01-2016 44.4500 0.114035057
31-01-2016 2.15 -0.1977612 29-02-2016 39.4400 -0.11271095
29-02-2016 2.06 -0.0418605 31-03-2016 37.8800 -0.0395537
31-03-2016 2.31 0.12135922 30-04-2016 41.2200 0.088173176
30-04-2016 2.42 0.04761905 31-05-2016 41.3900 0.004124163
30-04-2016 2.44 0.00826446 30-06-2016 42.4600 0.025851656
31-07-2016 3.04 0.24590164 31-07-2016 42.3500 -0.0025907
31-08-2016 3.16 0.03947368 31-08-2016 42.0300 -0.00755606
Accounting
12
30-09-2016 2.34 -0.2594937 30-09-2016 41.4300 -0.01427549
31-10-2016 2.36 0.00854701 31-10-2016 43.7300 0.055515327
30-11-2016 1.85 -0.2161017 30-11-2016 44.5100 0.01783668
31-12-2016 3.44 0.85945946 31-12-2016 45.7600 0.028083578
31-01-2017 2.68 -0.2209302 31-01-2017 49.7000 0.086101468
28-02-2017 2.15 -0.1977612 28-02-2017 51.1500 0.02917507
31-03-2017 2.06 -0.0418605 31-03-2017 48.1600 -0.05845556
30-04-2017 2.31 0.12135922 30-04-2017 51.1500 0.062084759
31-05-2017 2.42 0.04761905 31-05-2017 48.1600 -0.05845556
-0.326% 1.228%
⊘ This is a preview!⊘
Do you want full access?
Subscribe today to unlock all pages.
Trusted by 1+ million students worldwide
1 out of 17
Related Documents


Your All-in-One AI-Powered Toolkit for Academic Success.
+13062052269
info@desklib.com
Available 24*7 on WhatsApp / Email
![[object Object]](/_next/static/media/star-bottom.7253800d.svg)
Unlock your academic potential
Copyright © 2020–2026 A2Z Services. All Rights Reserved. Developed and managed by ZUCOL.