Fingerprint Pattern and Ridge Count Analysis: Genetics Lab Assignment
VerifiedAdded on 2023/04/20
|8
|2131
|346
Homework Assignment
AI Summary
This assignment focuses on analyzing fingerprint patterns and ridge counts to understand genetic inheritance. The student calculates and compares fingerprint patterns (arch, loop, whorl) and total ridge counts (TRC) for a dataset of 35 individuals, differentiating between males and females. The objective is to determine the existence of different fingerprint patterns between sexes and how they differ. The assignment includes comparing the student's TRC to the average TRC in the dataset and discussing the findings in relation to published data. Further, the assignment explores a polygenic model of inheritance, predicting TRCs based on genotypes and calculating probabilities of specific genetic outcomes in offspring, using a four-locus model. The assignment extends to discussing discrepancies between predicted and measured TRC values and considering multifactorial inheritance.

Fingerprint Ridge Count
Institution:
Student Name:
Institution:
Student Name:
Paraphrase This Document
Need a fresh take? Get an instant paraphrase of this document with our AI Paraphraser
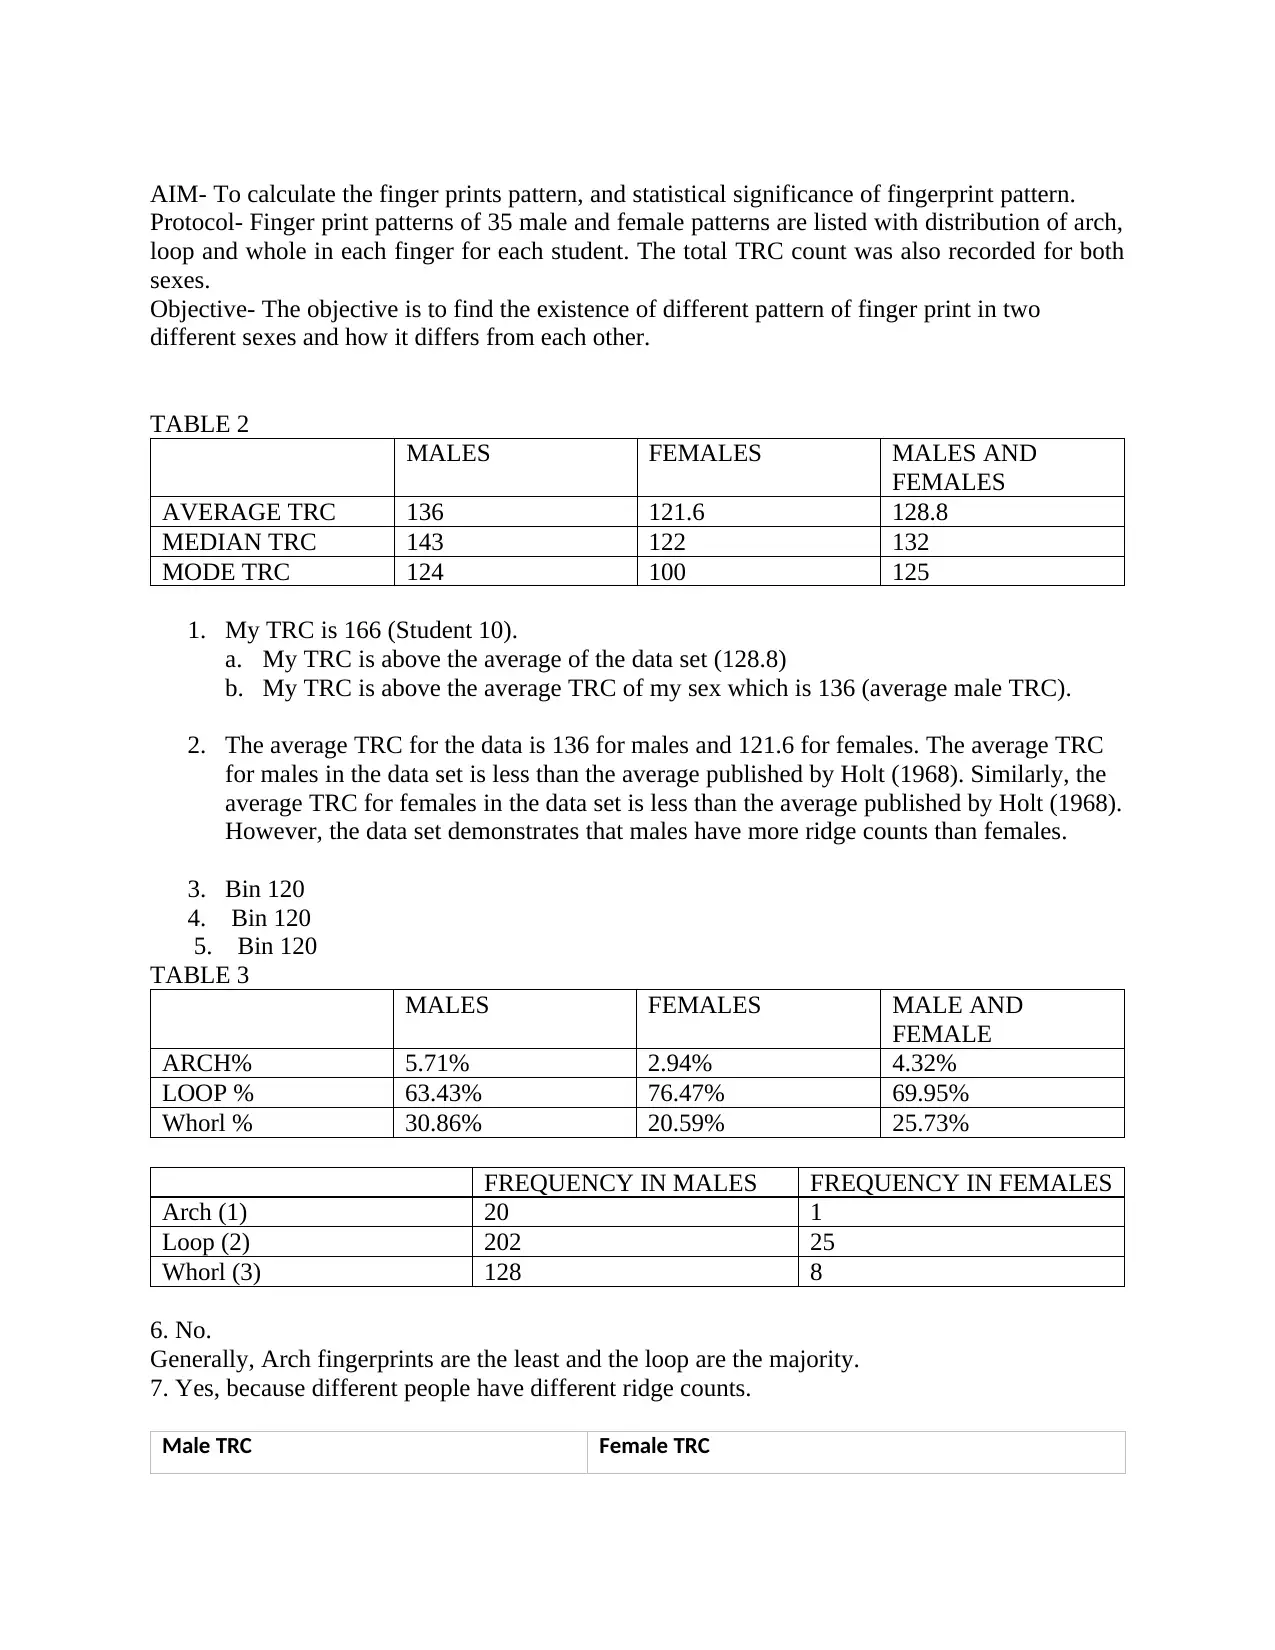
AIM- To calculate the finger prints pattern, and statistical significance of fingerprint pattern.
Protocol- Finger print patterns of 35 male and female patterns are listed with distribution of arch,
loop and whole in each finger for each student. The total TRC count was also recorded for both
sexes.
Objective- The objective is to find the existence of different pattern of finger print in two
different sexes and how it differs from each other.
TABLE 2
MALES FEMALES MALES AND
FEMALES
AVERAGE TRC 136 121.6 128.8
MEDIAN TRC 143 122 132
MODE TRC 124 100 125
1. My TRC is 166 (Student 10).
a. My TRC is above the average of the data set (128.8)
b. My TRC is above the average TRC of my sex which is 136 (average male TRC).
2. The average TRC for the data is 136 for males and 121.6 for females. The average TRC
for males in the data set is less than the average published by Holt (1968). Similarly, the
average TRC for females in the data set is less than the average published by Holt (1968).
However, the data set demonstrates that males have more ridge counts than females.
3. Bin 120
4. Bin 120
5. Bin 120
TABLE 3
MALES FEMALES MALE AND
FEMALE
ARCH% 5.71% 2.94% 4.32%
LOOP % 63.43% 76.47% 69.95%
Whorl % 30.86% 20.59% 25.73%
FREQUENCY IN MALES FREQUENCY IN FEMALES
Arch (1) 20 1
Loop (2) 202 25
Whorl (3) 128 8
6. No.
Generally, Arch fingerprints are the least and the loop are the majority.
7. Yes, because different people have different ridge counts.
Male TRC Female TRC
84 84
124 115
66 140
125 180
163 158
144 100
141 103
179 173
133 92
166 85
121 150
187 170
127 179
167 157
61 121
161 69
165 137
147 114
65 122
167 123
67 141
124 45
143 105
153 137
164 73
139 132
80 100
134 131
152 125
166 125
187 118
149 99
136 162
109 89
164 102
124 115
66 140
125 180
163 158
144 100
141 103
179 173
133 92
166 85
121 150
187 170
127 179
167 157
61 121
161 69
165 137
147 114
65 122
167 123
67 141
124 45
143 105
153 137
164 73
139 132
80 100
134 131
152 125
166 125
187 118
149 99
136 162
109 89
164 102
⊘ This is a preview!⊘
Do you want full access?
Subscribe today to unlock all pages.
Trusted by 1+ million students worldwide
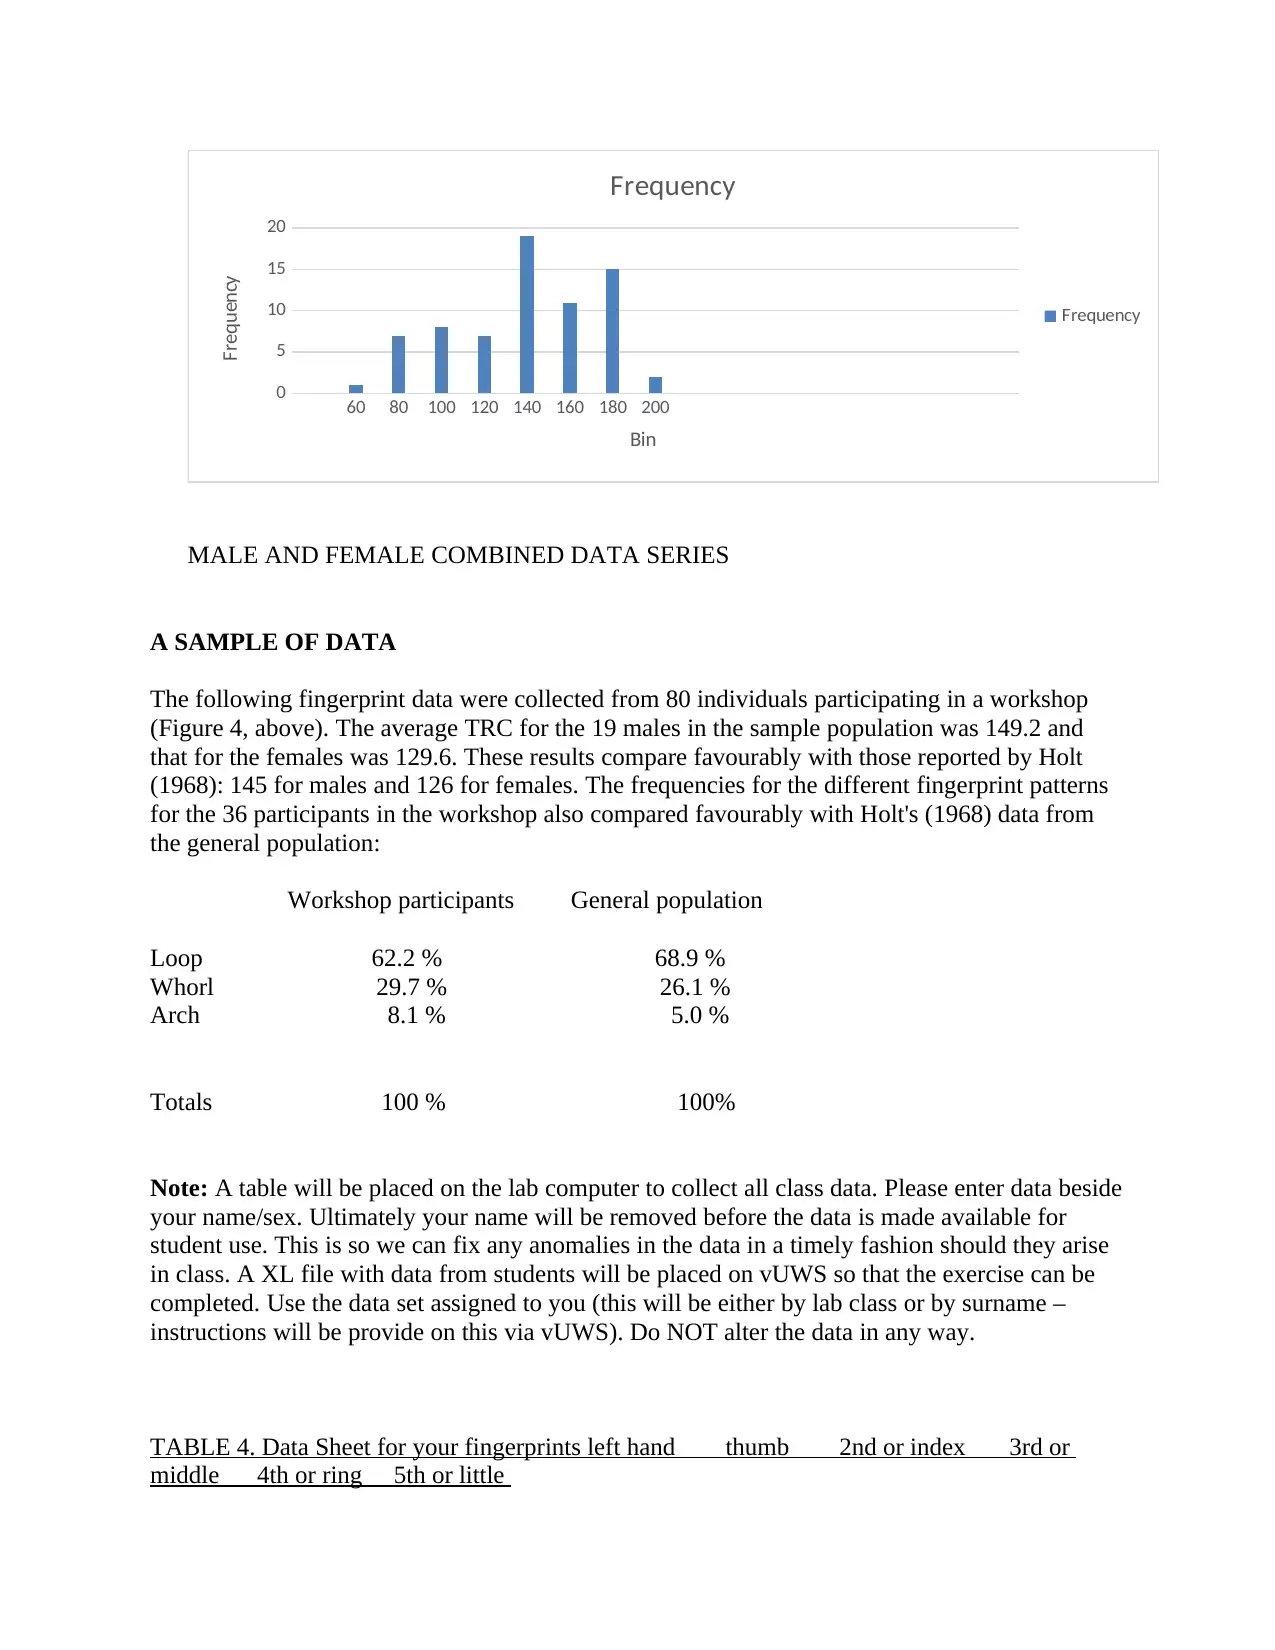
60 80 100 120 140 160 180 200
0
5
10
15
20
Frequency
Frequency
Bin
Frequency
MALE AND FEMALE COMBINED DATA SERIES
A SAMPLE OF DATA
The following fingerprint data were collected from 80 individuals participating in a workshop
(Figure 4, above). The average TRC for the 19 males in the sample population was 149.2 and
that for the females was 129.6. These results compare favourably with those reported by Holt
(1968): 145 for males and 126 for females. The frequencies for the different fingerprint patterns
for the 36 participants in the workshop also compared favourably with Holt's (1968) data from
the general population:
Workshop participants General population
Loop 62.2 % 68.9 %
Whorl 29.7 % 26.1 %
Arch 8.1 % 5.0 %
Totals 100 % 100%
Note: A table will be placed on the lab computer to collect all class data. Please enter data beside
your name/sex. Ultimately your name will be removed before the data is made available for
student use. This is so we can fix any anomalies in the data in a timely fashion should they arise
in class. A XL file with data from students will be placed on vUWS so that the exercise can be
completed. Use the data set assigned to you (this will be either by lab class or by surname –
instructions will be provide on this via vUWS). Do NOT alter the data in any way.
TABLE 4. Data Sheet for your fingerprints left hand thumb 2nd or index 3rd or
middle 4th or ring 5th or little
Paraphrase This Document
Need a fresh take? Get an instant paraphrase of this document with our AI Paraphraser
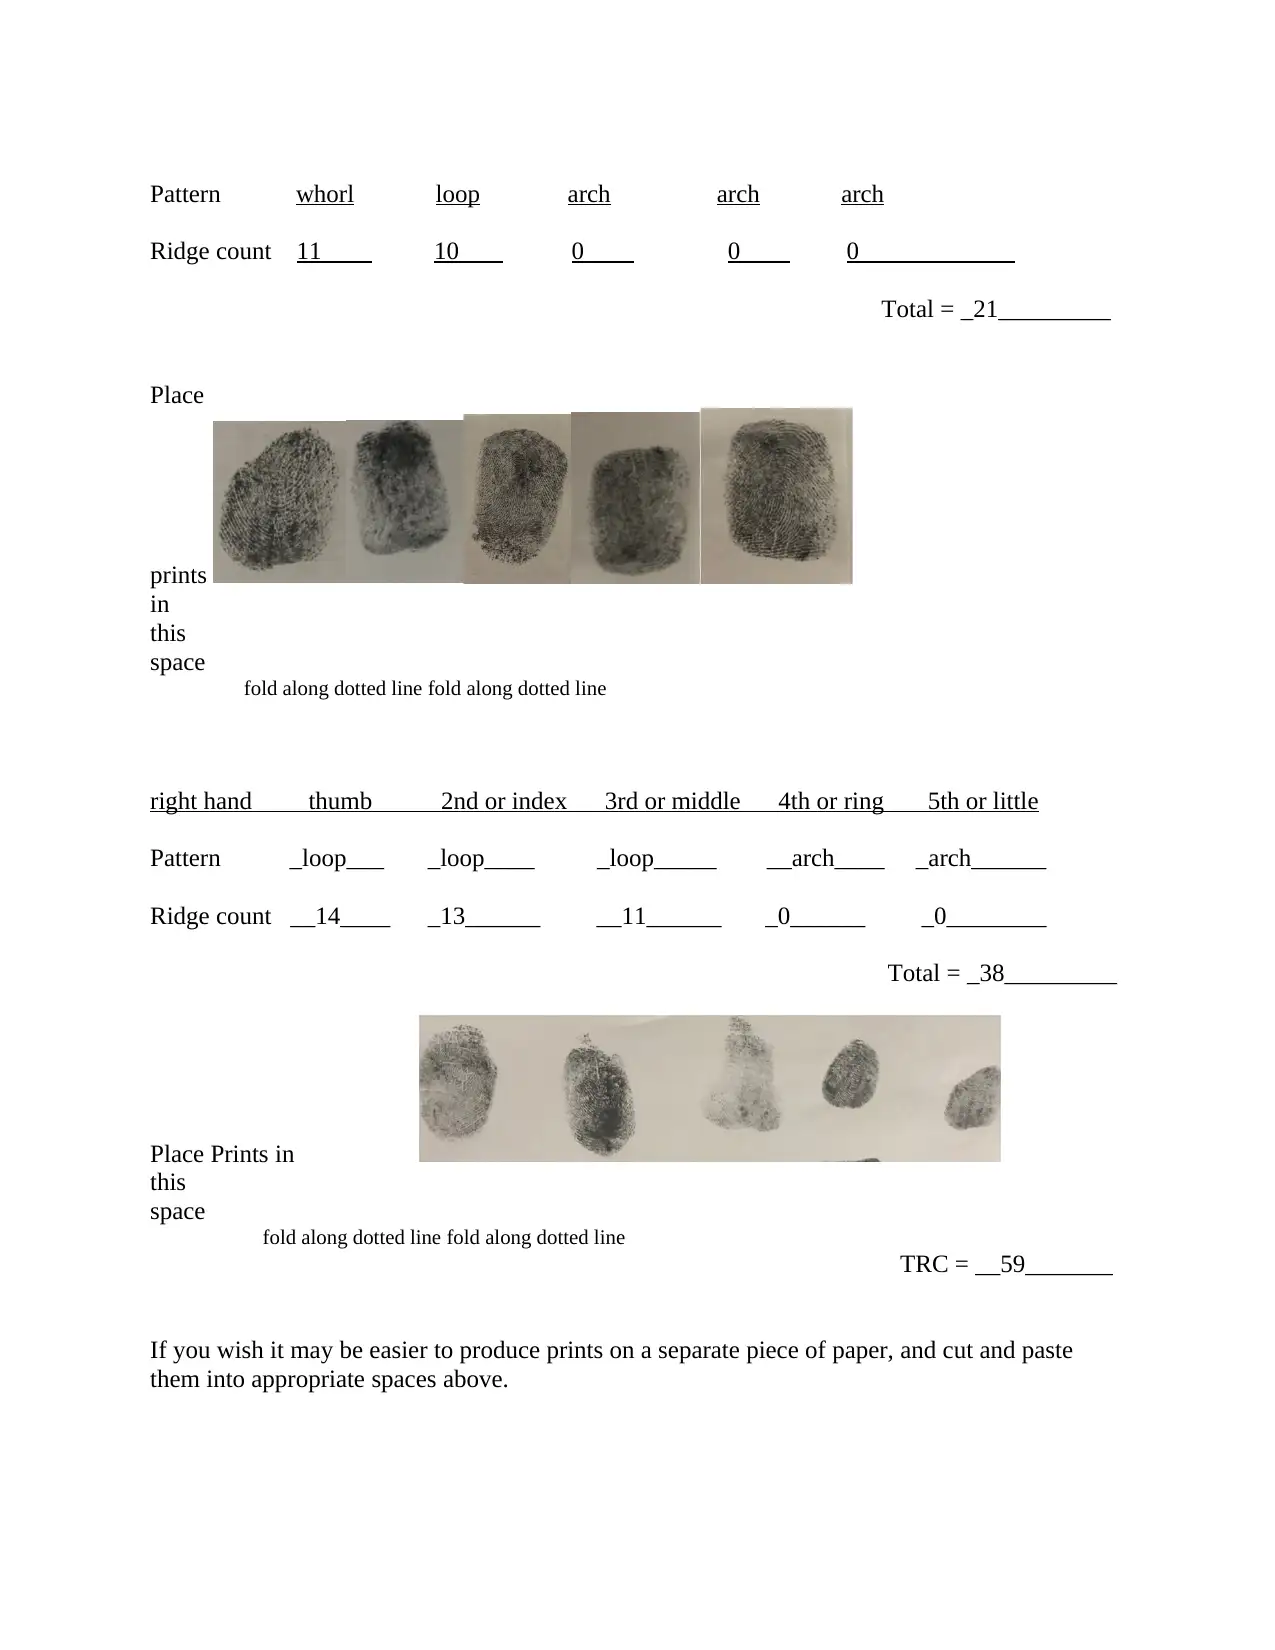
Pattern whorl loop arch arch arch
Ridge count 11 10 0 0 0
Total = _21_________
Place
prints
in
this
space fold along dotted line fold along dotted line
right hand thumb 2nd or index 3rd or middle 4th or ring 5th or little
Pattern _loop___ _loop____ _loop_____ __arch____ _arch______
Ridge count __14____ _13______ __11______ _0______ _0________
Total = _38_________
Place Prints in
this
space fold along dotted line fold along dotted line
TRC = __59_______
If you wish it may be easier to produce prints on a separate piece of paper, and cut and paste
them into appropriate spaces above.
EXTEND YOUR UNDERSTANDING WITH ADDITIONAL TRC PROBLEMS
Total fingerprint ridge count exemplifies a polygenic inheritance pattern. Penrose (1969) and
others have suggested that a minimum of seven gene loci contribute to TRC, but a four-locus
model is hypothesized in the problems that follow. Thus, AABBCCDD represents the genotype
for maximum ridge count and aabbccdd symbolizes the genotype for the minimum ridge count.
Assume that each active (dominant) allele adds 12 ridges to the TRC of the male and 9 to the
TRC of the female and that having the genotype aabbccdd produces a baseline TRC of 80 for
males and 70 for females. (one answer is given below to clarify any issues with these
instructions). You must also complete these questions for the assignment.
8. Predict the TRC for each of the following individuals.
Genotype Male Female
AABBCCDD _176____________ _142_____________
AabbccDd _104_____________ _88______________
AaBBCcDD _152____________ _124_____________
aaBbCCDd answer = 128 _106_____________
9a. Write the genotypes of both parents (the parental cross) who are heterozygous for all four
genes (i.e. tetrahybrid cross).
_P1=_AaBbCcDD______P2=AaBbCcDd_______________________________________
b. Write the genotype of the child (from the cross above in Question 9) who has the maximum
number of active alleles possible.
_AABBCCDD____________________________________________________________
c. What are the TRCs for the parents and their child above (assume that the child is a male)?
Parents: mother: 106 Father: 128 TRC: 234
Male Child: TRC is 176
d. Calculate the probability that these parents (above) would produce a child with the minimum
number of active alleles (i.e. all loci recessive). Show your calculations.
1/4 * ¼ * ¼ * ¼ = 1 over 256
10a. If an AaBbCcdd male mates with an AaBbCCDD female
b. What is the minimum number of ridge-producing alleles possible in one of their children?
____aabbCcDd_____________________________________________________________
c. What would be the TRC for this child if it is a male? _104______________________
⊘ This is a preview!⊘
Do you want full access?
Subscribe today to unlock all pages.
Trusted by 1+ million students worldwide

d. What would be the TRC for this child if it is a female? _88_____________________
e. If this child is a male, will he have a higher or lower TRC than the parent with the lower ridge
count?
The TRC of the male will be less than the parent with a lower ridge count.
f. What is the maximum number of ridge-producing alleles possible in a child of this couple?
_AABBCCDd_= 7alleles________________________________________________
g. If this child is a female, will she have a higher or lower TRC than the parent with the higher
ridge count?
The female child will have a higher TRC than the parent with the higher ridge count.
11. If an AaBBCcdd male mates with an AABbCcDd female,
a. What is the minimum number of active alleles possible in a child this couple could produce?
__aabbCcdD_= 2 alleles________________________________________________________
b. What would be the probability of producing a child with the minimum number of active
alleles?
Probability ½ * ½ * ¼ *1/2 = 1 over 32
c. What would be the TRC for this child if it were male? 80 + (2*12)= 104
d. What would be the TRC for this child if it were female? 70+ (2*9)= 88
12. In solving some problems above, you made some predictions of TRCs based on the
genotypes of the individuals involved. Suppose we could measure the TRCs for some people
with those genotypes and found the actual values to be different from those predicted by your
calculations. How would you explain these discrepancies (think about multifactorial inheritance -
you could consult your textbook and look in the chapter that covers quantitative genetics)?
Discrepancies within the results are caused by a variety of factors which may include booth
environment and genetic influences. Multiple factors causing defects within traits are usually
reformed to as multifactorial inheritance. Environmental factors can develop traits and defect
like genes received from parents. Genetic factors that are received from parents include the
influence of sustenance are examples of environmental factors that may cause the
aforementioned defects.
REFERENCES AND FURTHER READING (it is not necessary that you go to these below,
they are here for those that may be interested in fingerprints).
Crawford, M.H., and R. Duggirala. 1992. Digital dermatoglyphic patterns of Eskimo and
Amerindian populations: relationships between
Paraphrase This Document
Need a fresh take? Get an instant paraphrase of this document with our AI Paraphraser
geographic, dermatoglyphic, genetic and linguistic distances. Human Biology 64(5):683-704.
Durham, N.M., and C.C. Plato, eds. 1990. Trends in dermatoglyphic research. New York,
Springer.
Galton, F. 1892. Finger prints. London: Macmillan and Company.
Garruto, R.M., C.C. Plato, and B.A. Schaurnann, eds. 1991. Dermatoglyphics: science in
transitions. Birth Defects Original Article Series.
New York: Wiley-Liss.
Holt, S. B. l968. The genetics of dermal ridges. Thomas, Springfield, Illinois, 195 pages.
Klug, W.S., and M.R. Cummings. 2006. Concepts of Genetics. 8th ed.
Kücken, M. (2007). Models for fingerprint formation. Forensic Science International, 171, 85-
96.
Lynch, M., and B. Walsh. 1999. Genetics and analysis of quantitative traits. Sunderland, MA:
Sinauer
Mendenhall, G., T. Mertens, and J. Hendrix. 1989. Fingerprint ridge count-A polygenic trait
useful classroom instruction. The American
Biology : Teacher 51(4):203-207.
Mendenhall, G., T. Mertens, and J. Hendrix. 1989. Fingerprint ridge count. American Biology
Teacher, 51:203–207.
Moore, L.A. 1987. Dermatoglyphics. Gene Pool, January: 1-4. [A Resource Letter for Educators
and Students. Dayton, OH: Children's
Medical Center.]
Nagle, J.J. 1984. Heredity and human affairs, 3rd ed. St. Louis, MO: Times Mirror/Mosby
College. Publishing.
Nagy, A.S., and M. Pap. 2004. Comparative analysis of dermatoglyphic traits in Hungarian and
Gypsy Populations. Human Biology 76(3):383-400.
Penrose, L.S. 1969. Dermatoglyphics. Scientific American, 221 (6), 72-83. Note there is
something wrong with the page numbering with this article – it jumps from 84 to 79.
Reed, T. 1981. Dermatoglyphics in medicine: Problems and use in suspected chromosome
abnormalities. American Journal of Medical
Genetics, 8:411–429.
Reed, T. 1981. Review: Dermatoglyphics in medicine--problems and use in suspected
chromosome abnormalities. American journal of
Medical Genetics 8:411-429. 15 Genetics Laboratory 300845
Roberts, D. 1979. Dermatoglyphics and human genetics. Pages 475–494, in Dermatoglyphics –
Fifty years later (W. Wertelecki and C. C. Plato, Editors). Birth Defects: Original Article Series,
Vol. 15, No. 6, Alan R. Liss, New York, 800 pages. Russell, P.J. 2006. iGenetics a Mendelian
approach -New York: Benjamin/Cummings Publishing Company. Schaumann, B., and M. Alter.
1976. Dermatoglyphics in medical disorders. Springer-Verlag, New York, 258 pages. Slatis, H.
M., M. B. Katznelson, and B. Bonne-Tamir. l976. The inheritance of fingerprint patterns.
American Journal of Human Genetics, 28:280–289.
Spence, M. A., R. C. Elston, K. K. Namboodiri, and W. S. Pollitzer. 1973. Evidence for a
possible major gene effect in absolute finger ridge count. Human Heredity, 23:414–421.
1 out of 8
Your All-in-One AI-Powered Toolkit for Academic Success.
+13062052269
info@desklib.com
Available 24*7 on WhatsApp / Email
![[object Object]](/_next/static/media/star-bottom.7253800d.svg)
Unlock your academic potential
Copyright © 2020–2026 A2Z Services. All Rights Reserved. Developed and managed by ZUCOL.