Strategic Management for Competitive Advantage: Genius Car Ltd Report
VerifiedAdded on 2023/01/11
|30
|5696
|75
Report
AI Summary
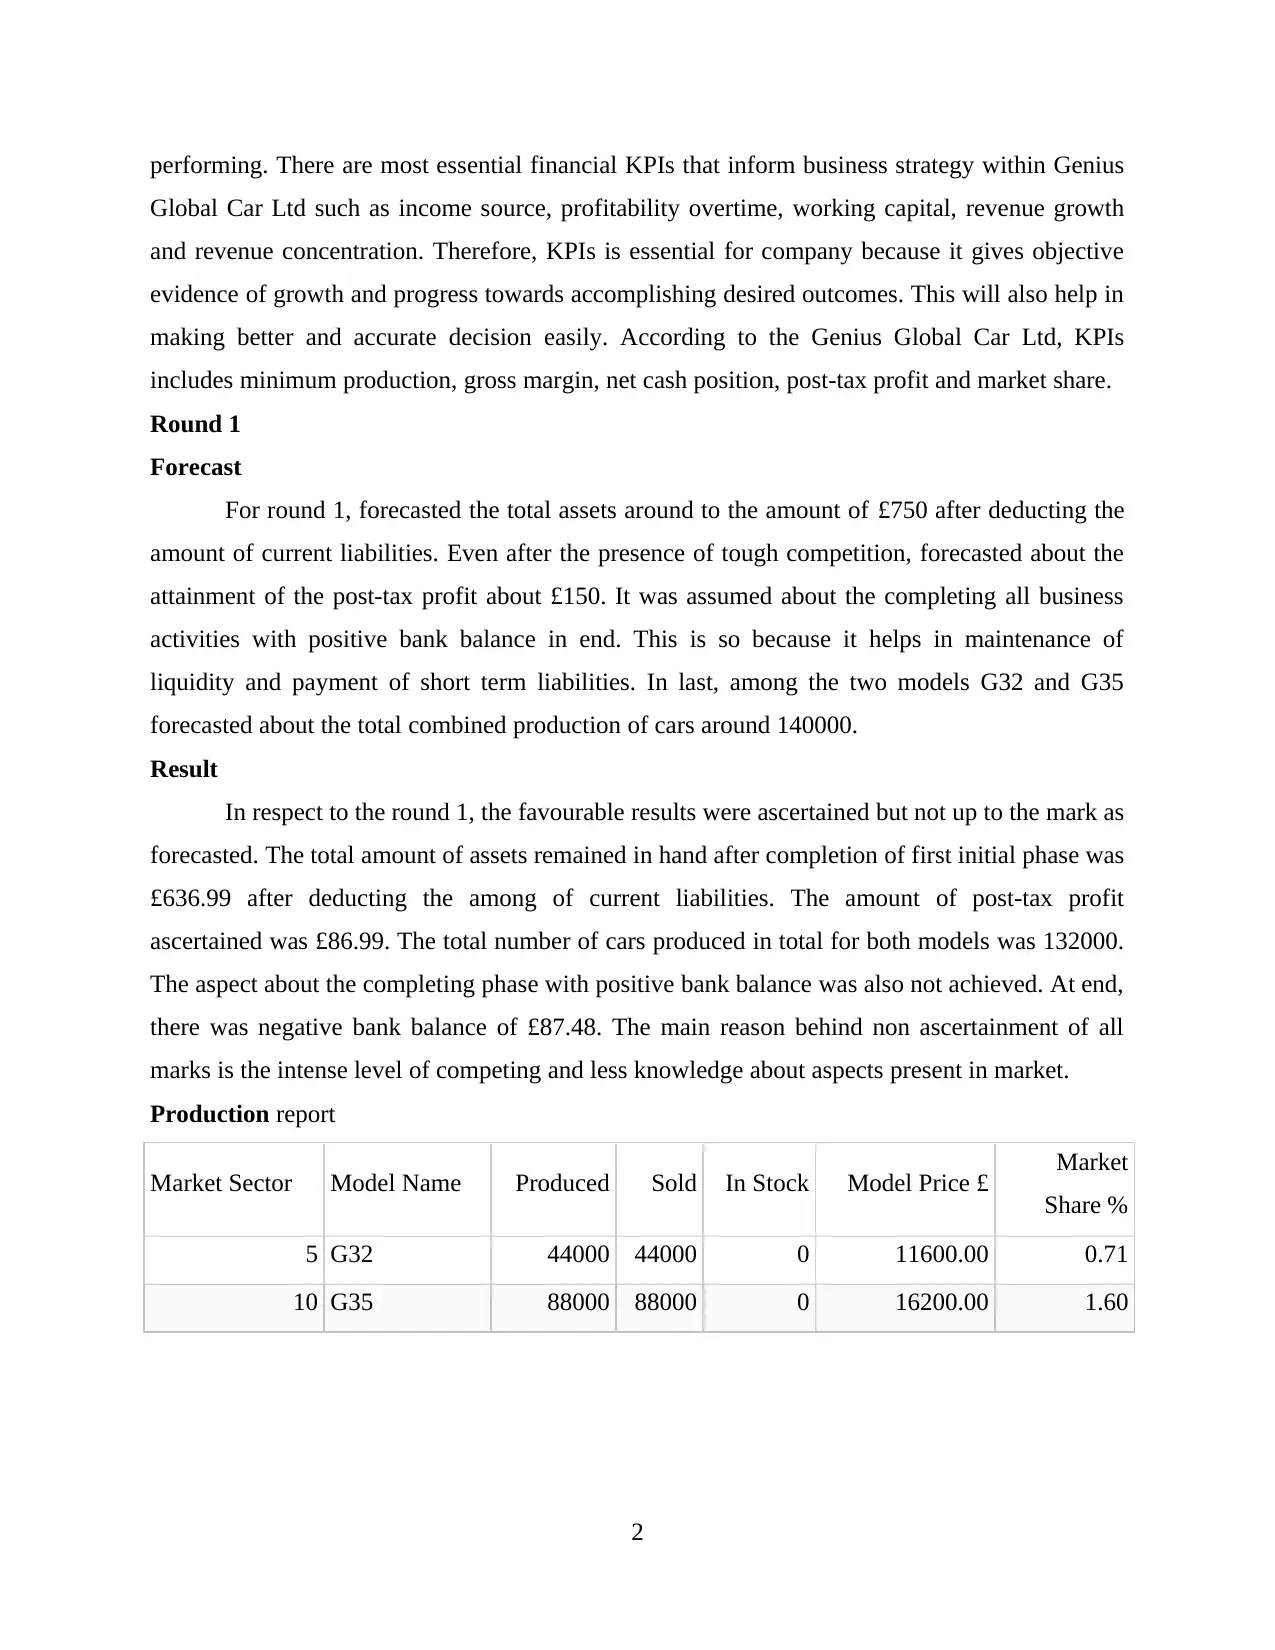
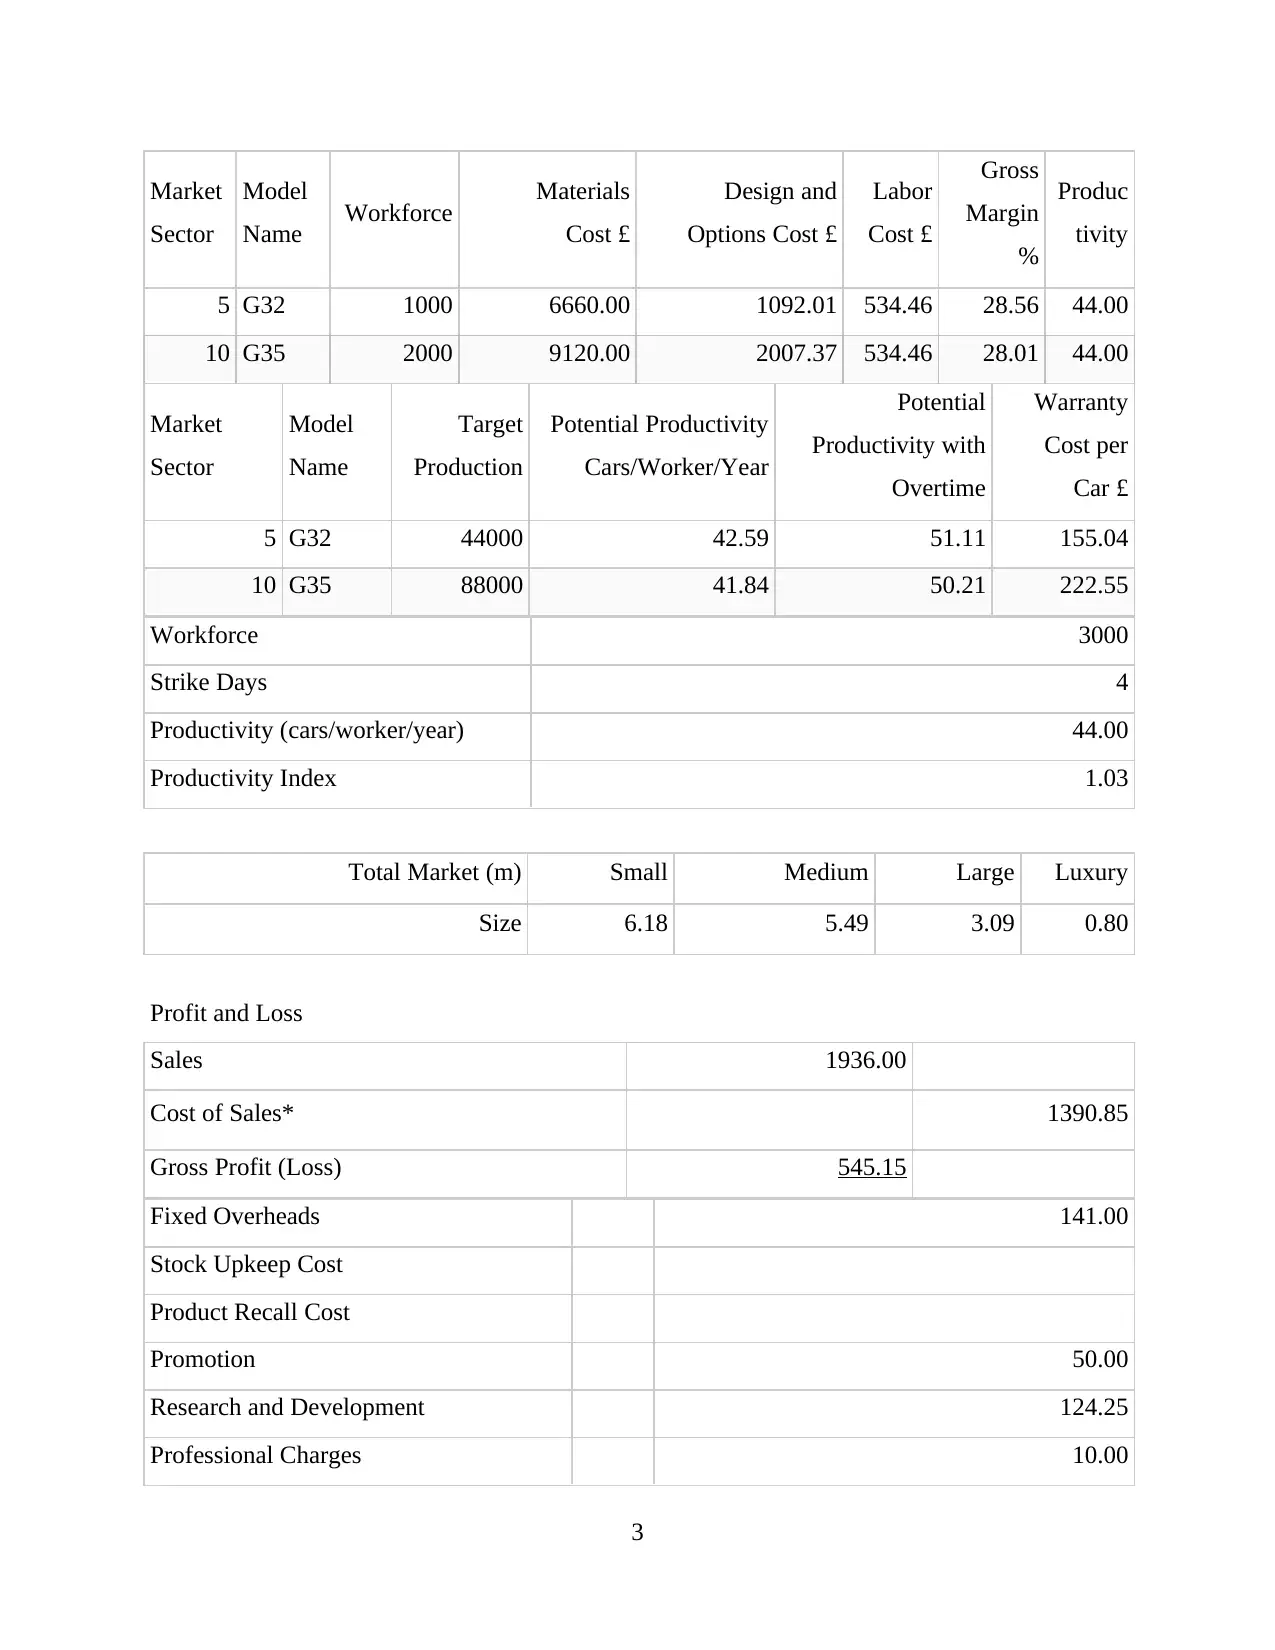
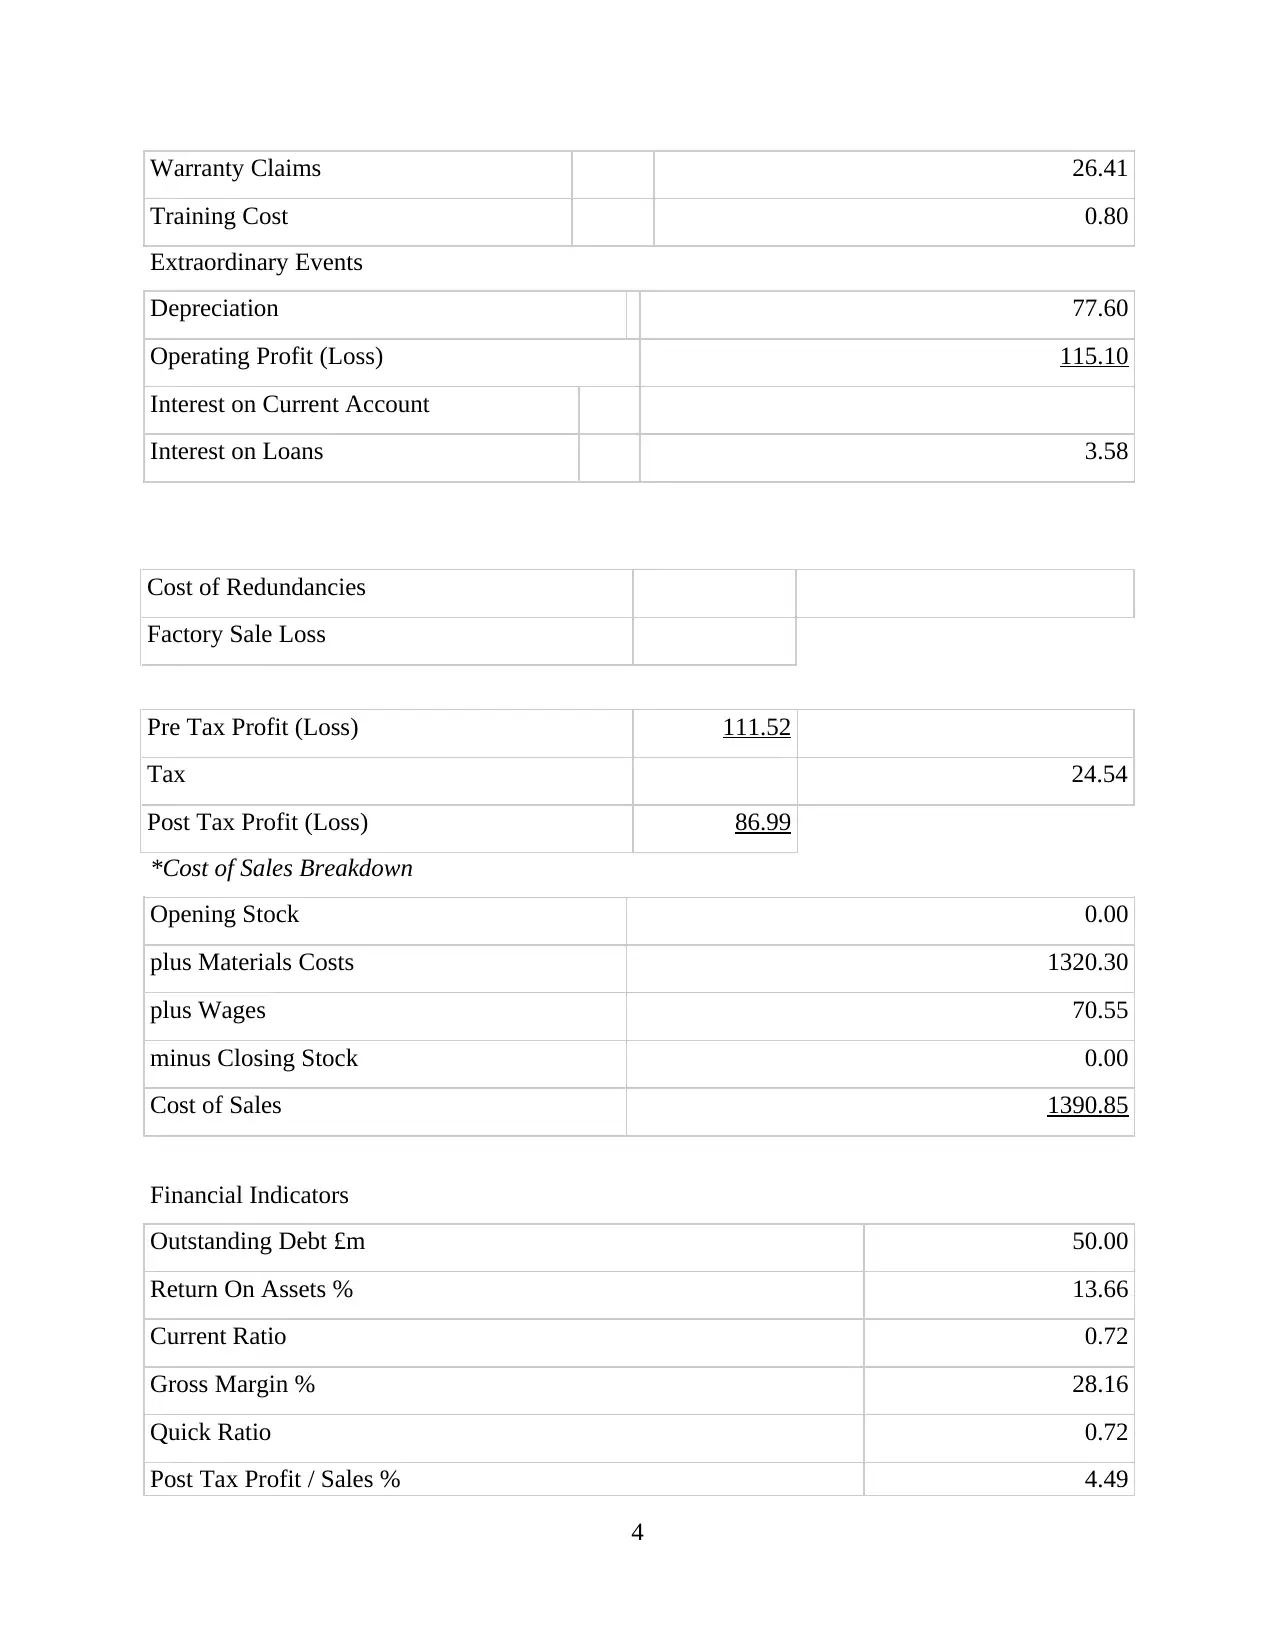
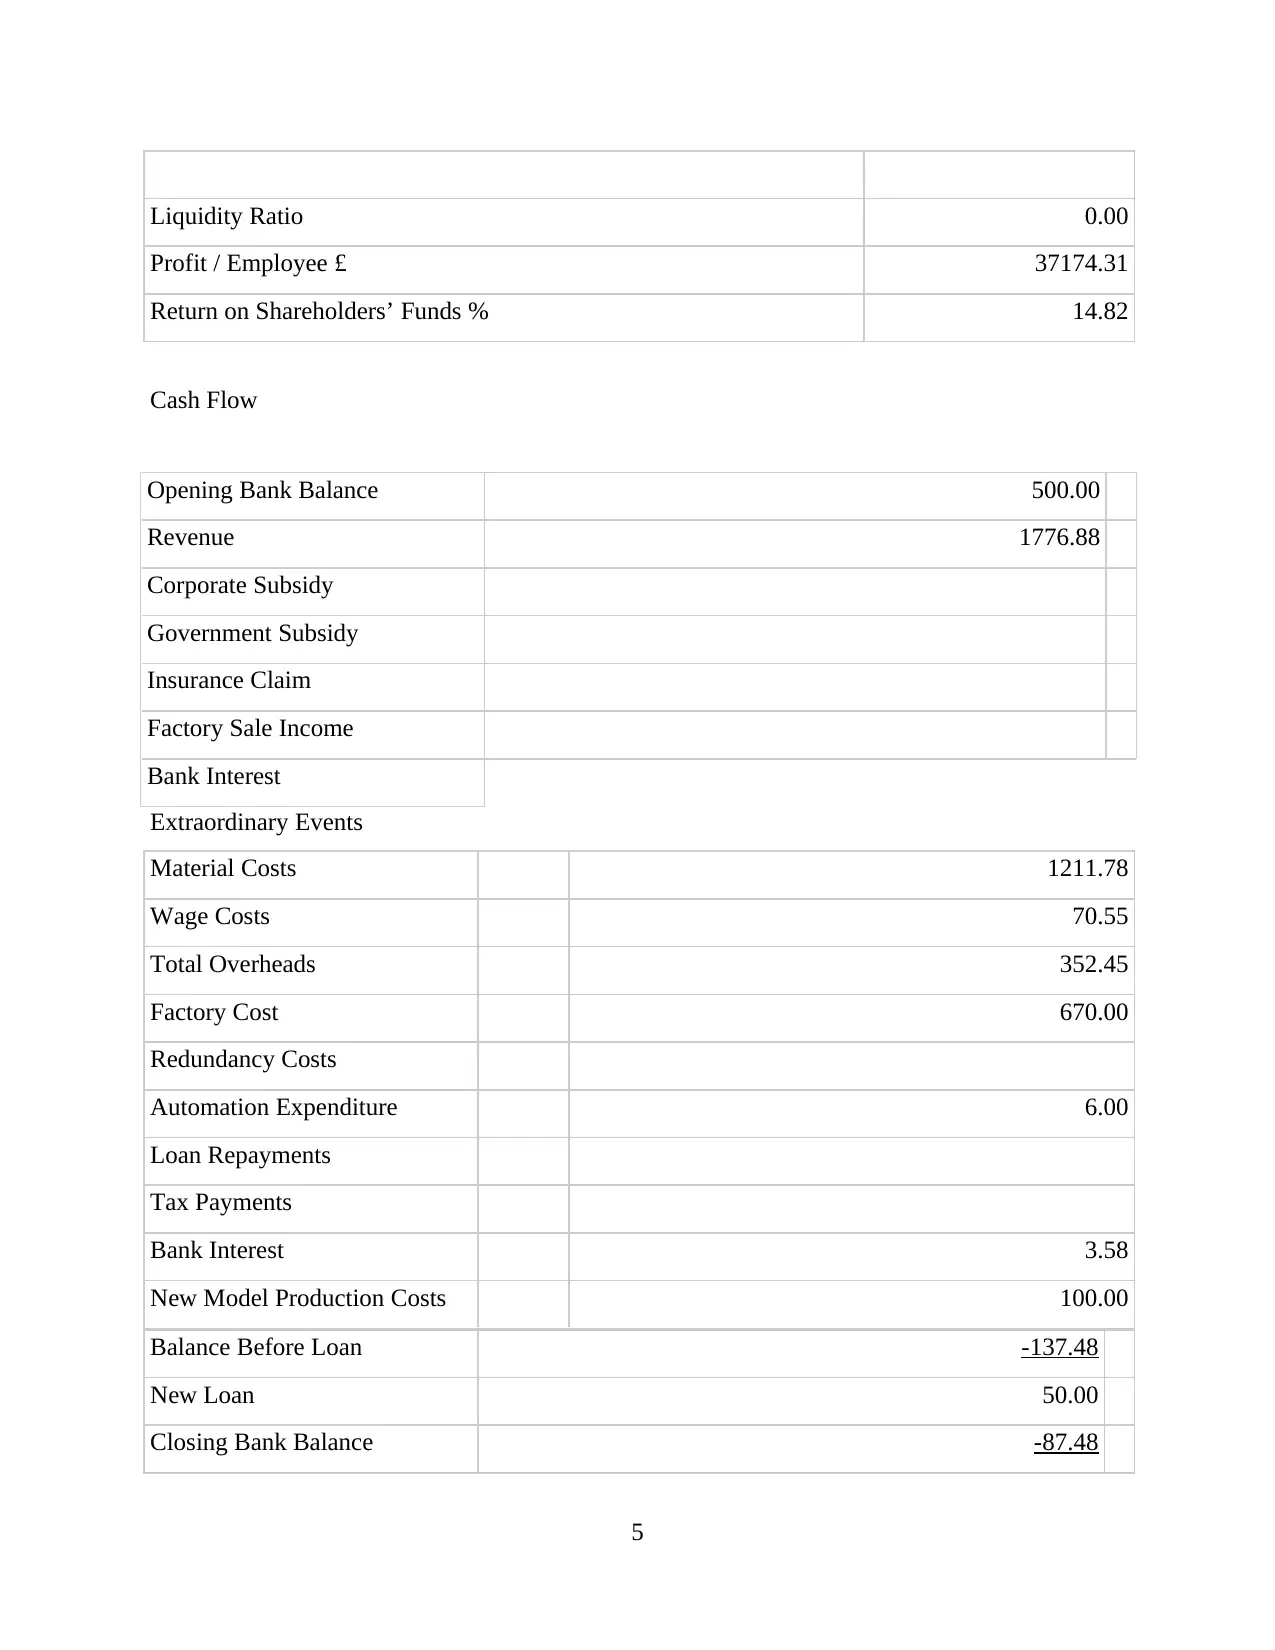
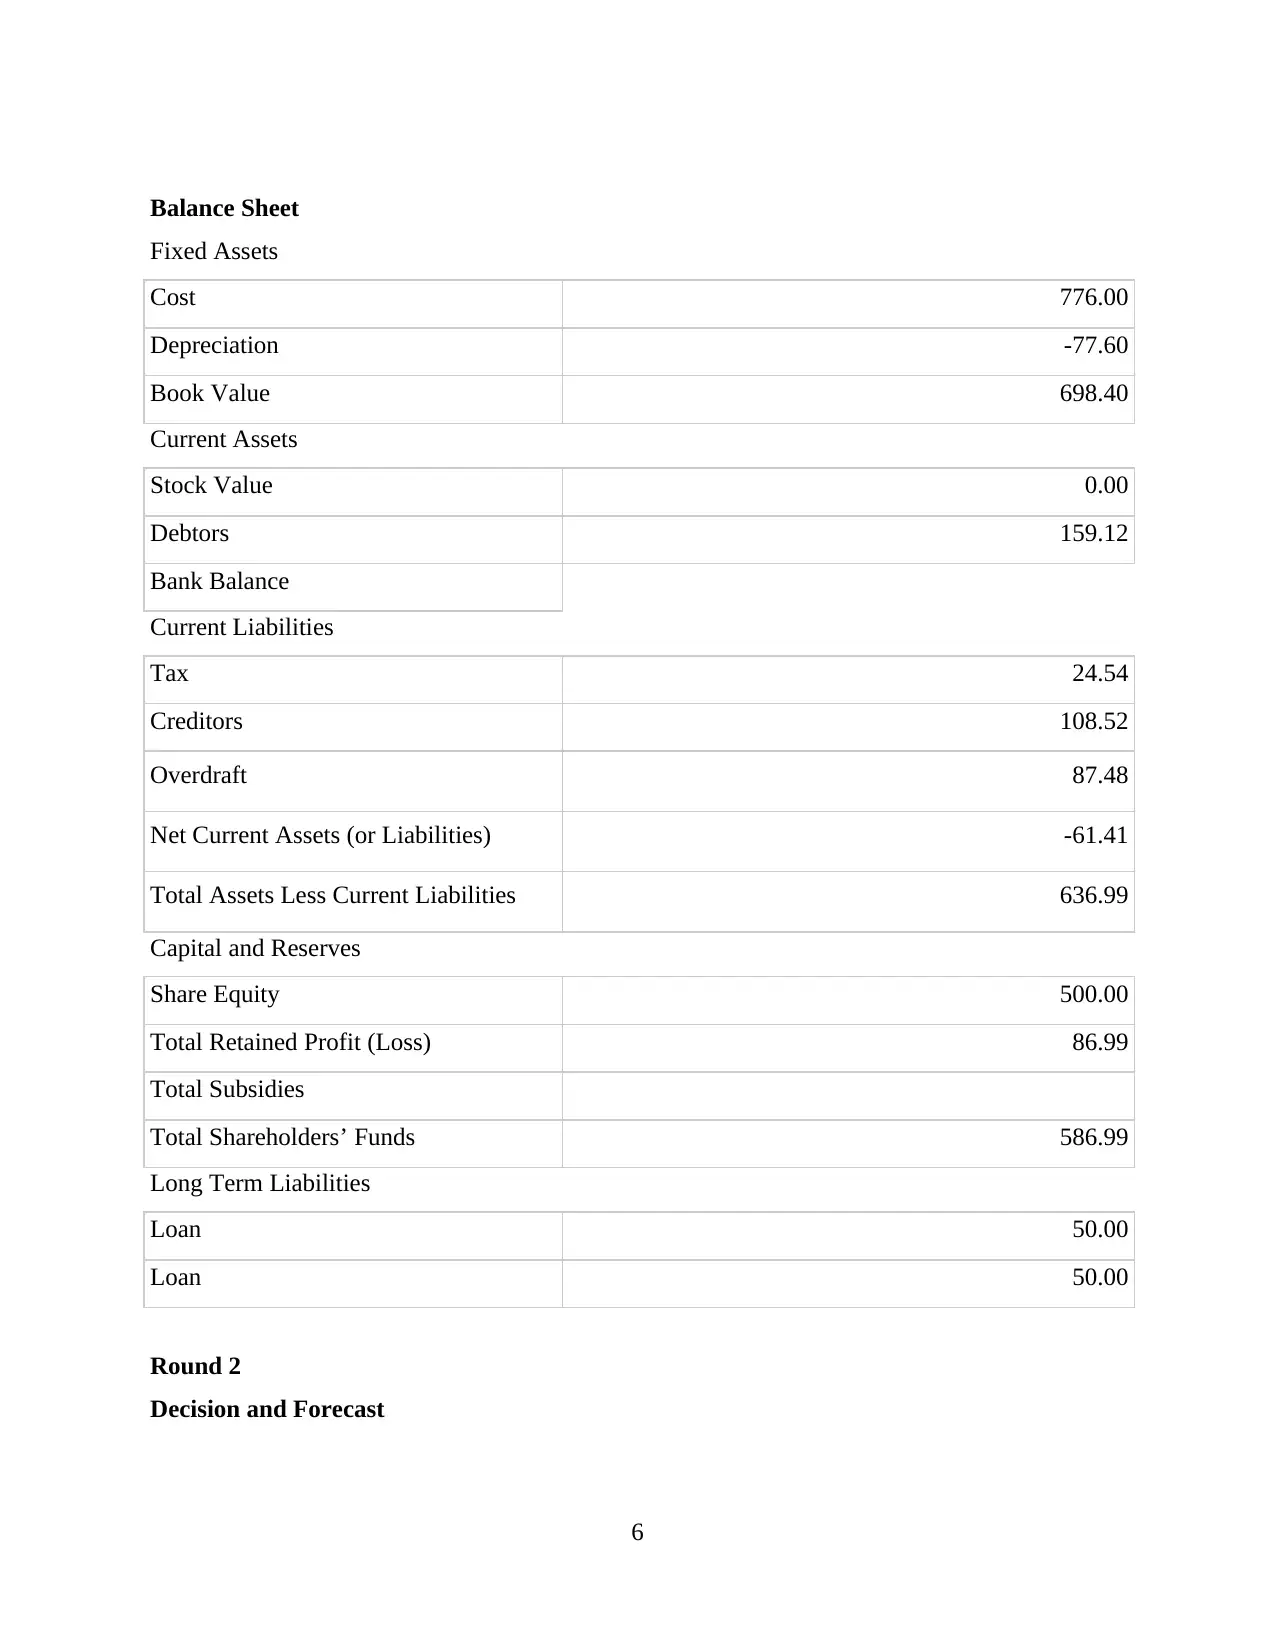
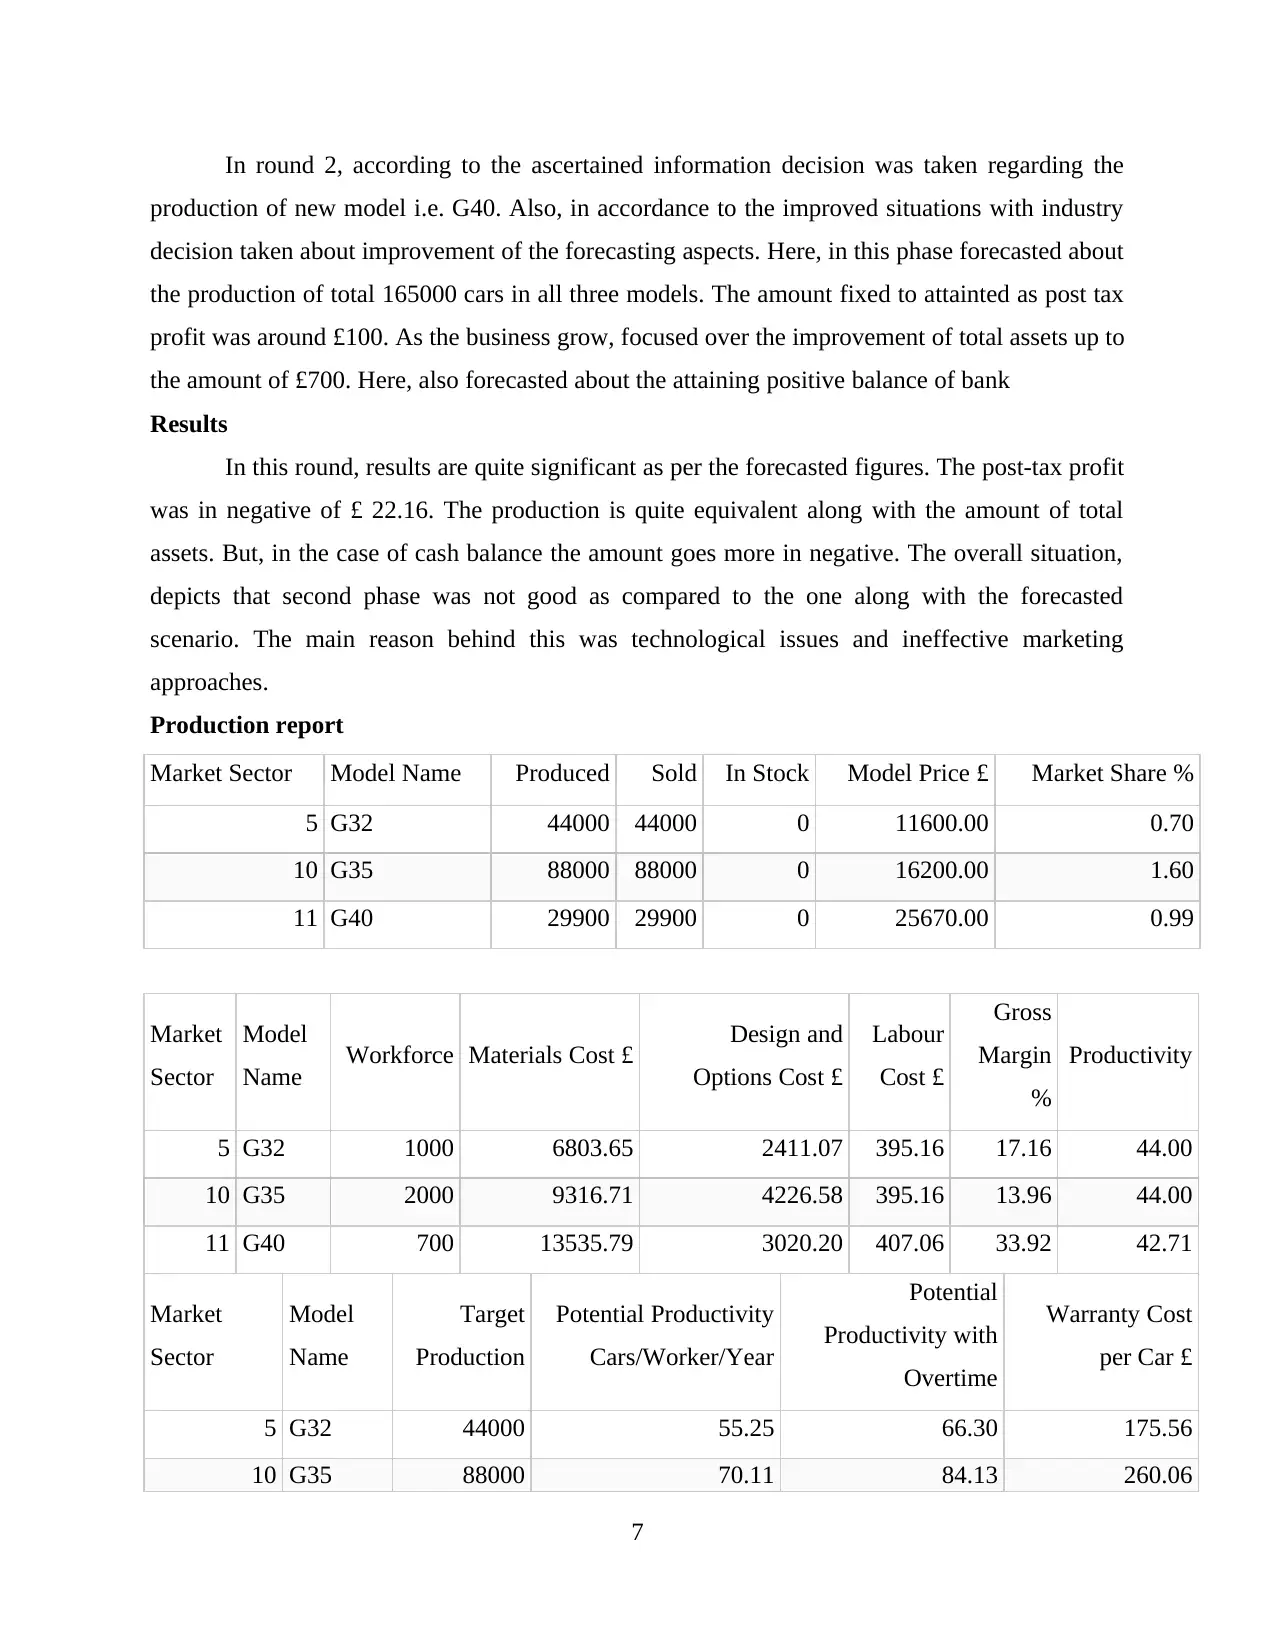
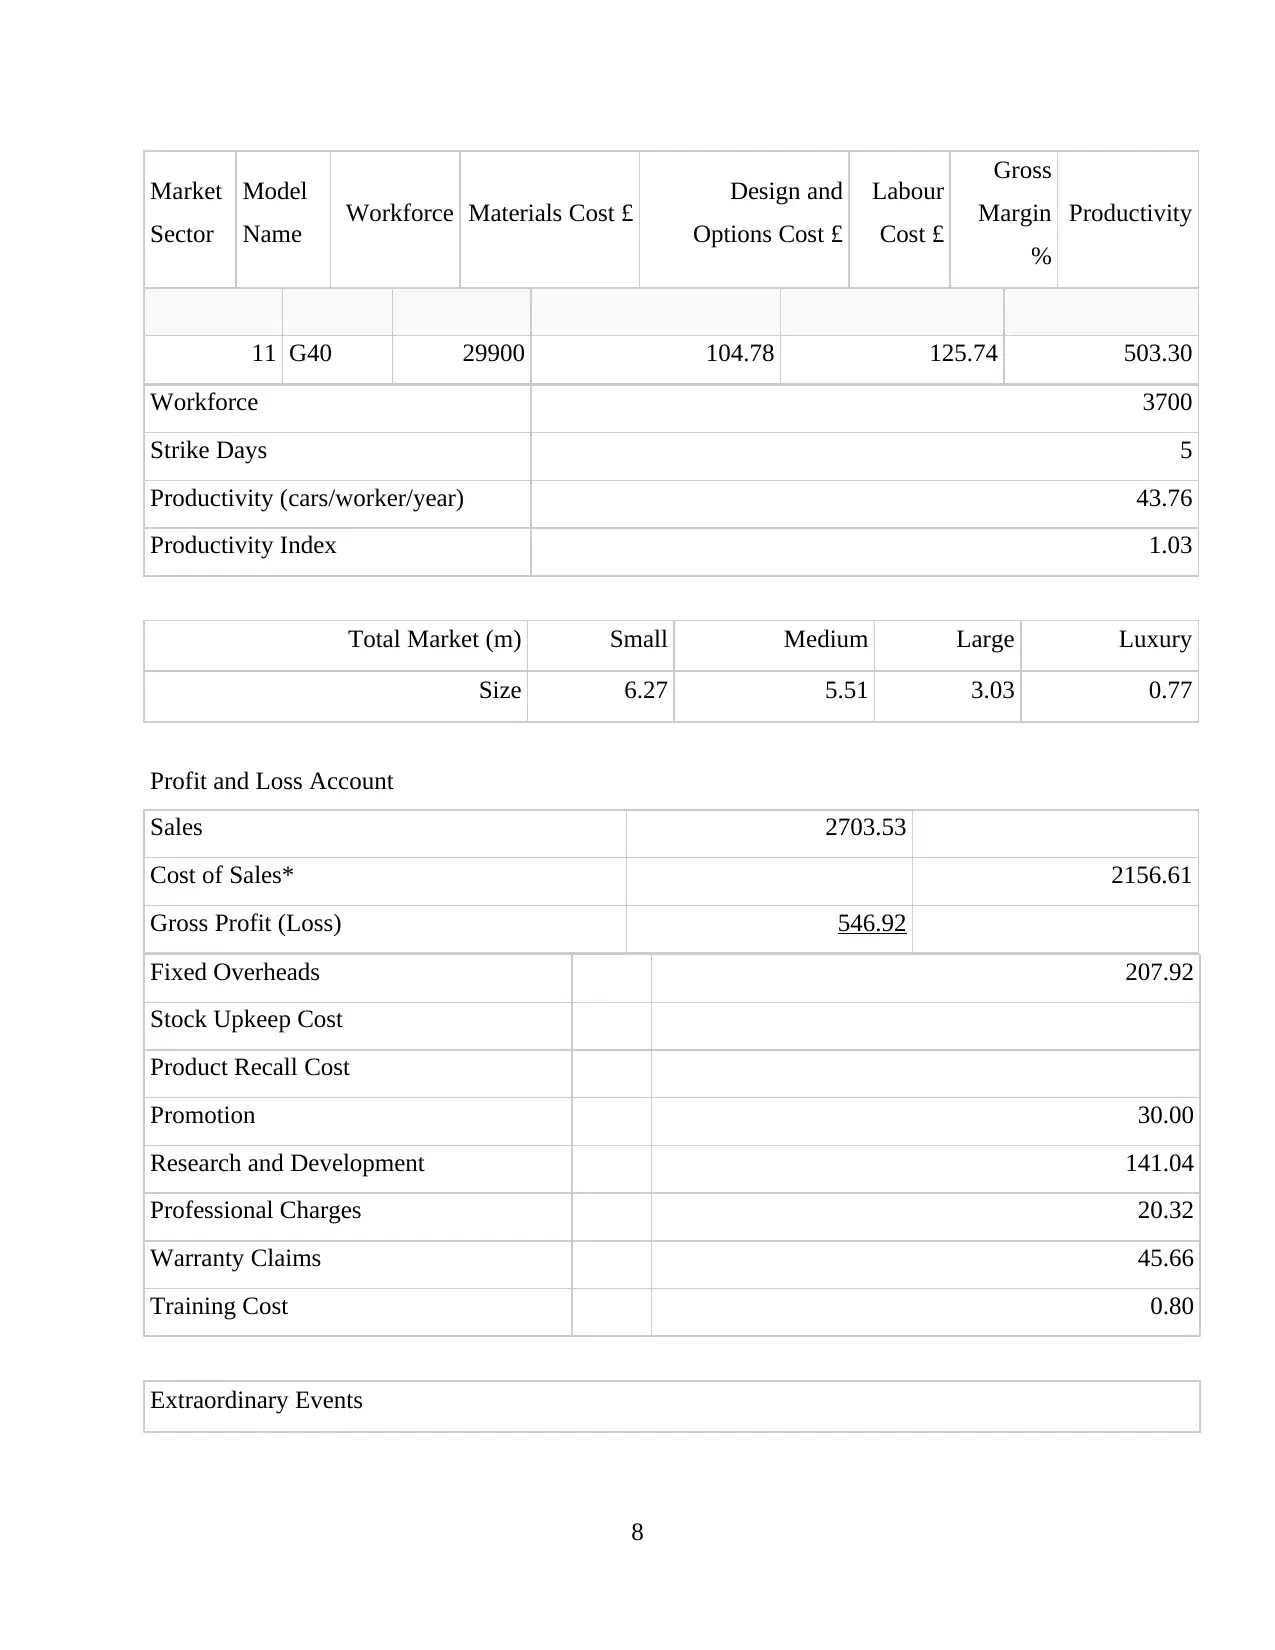
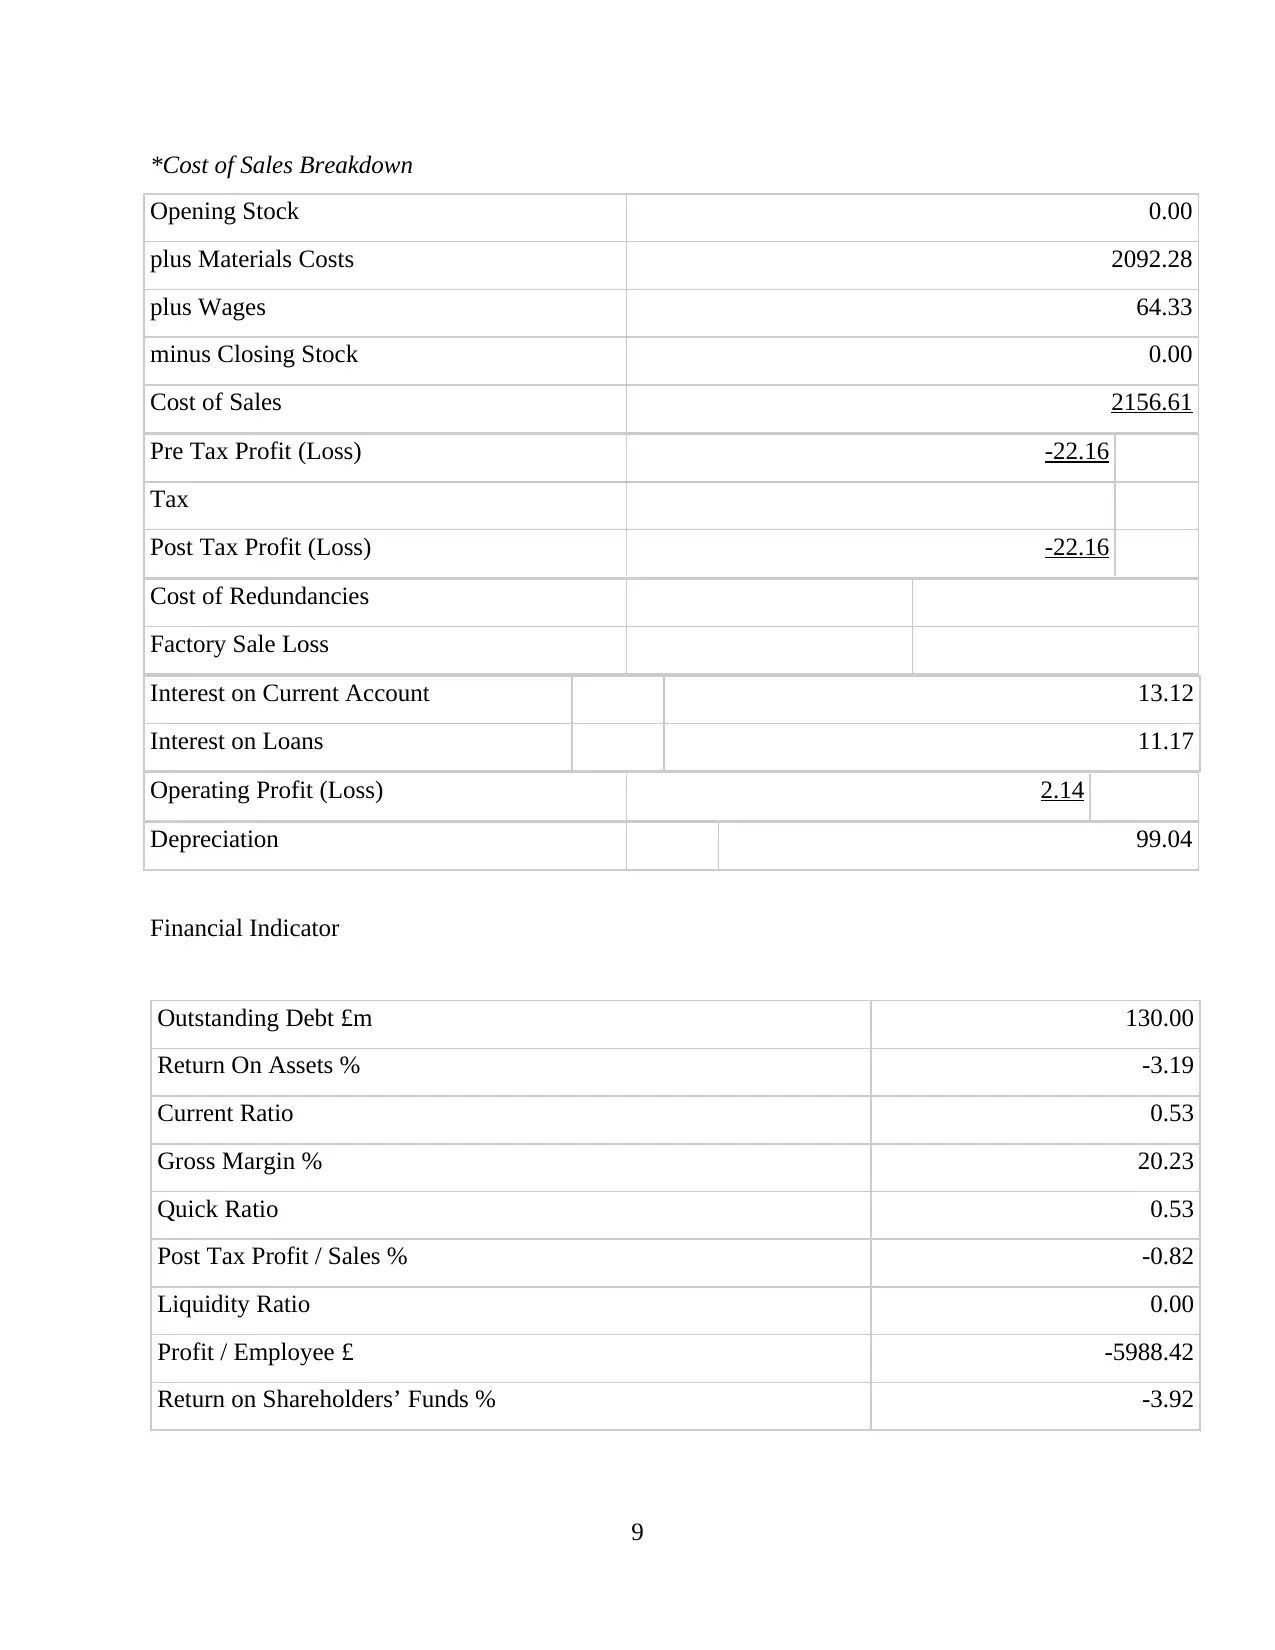
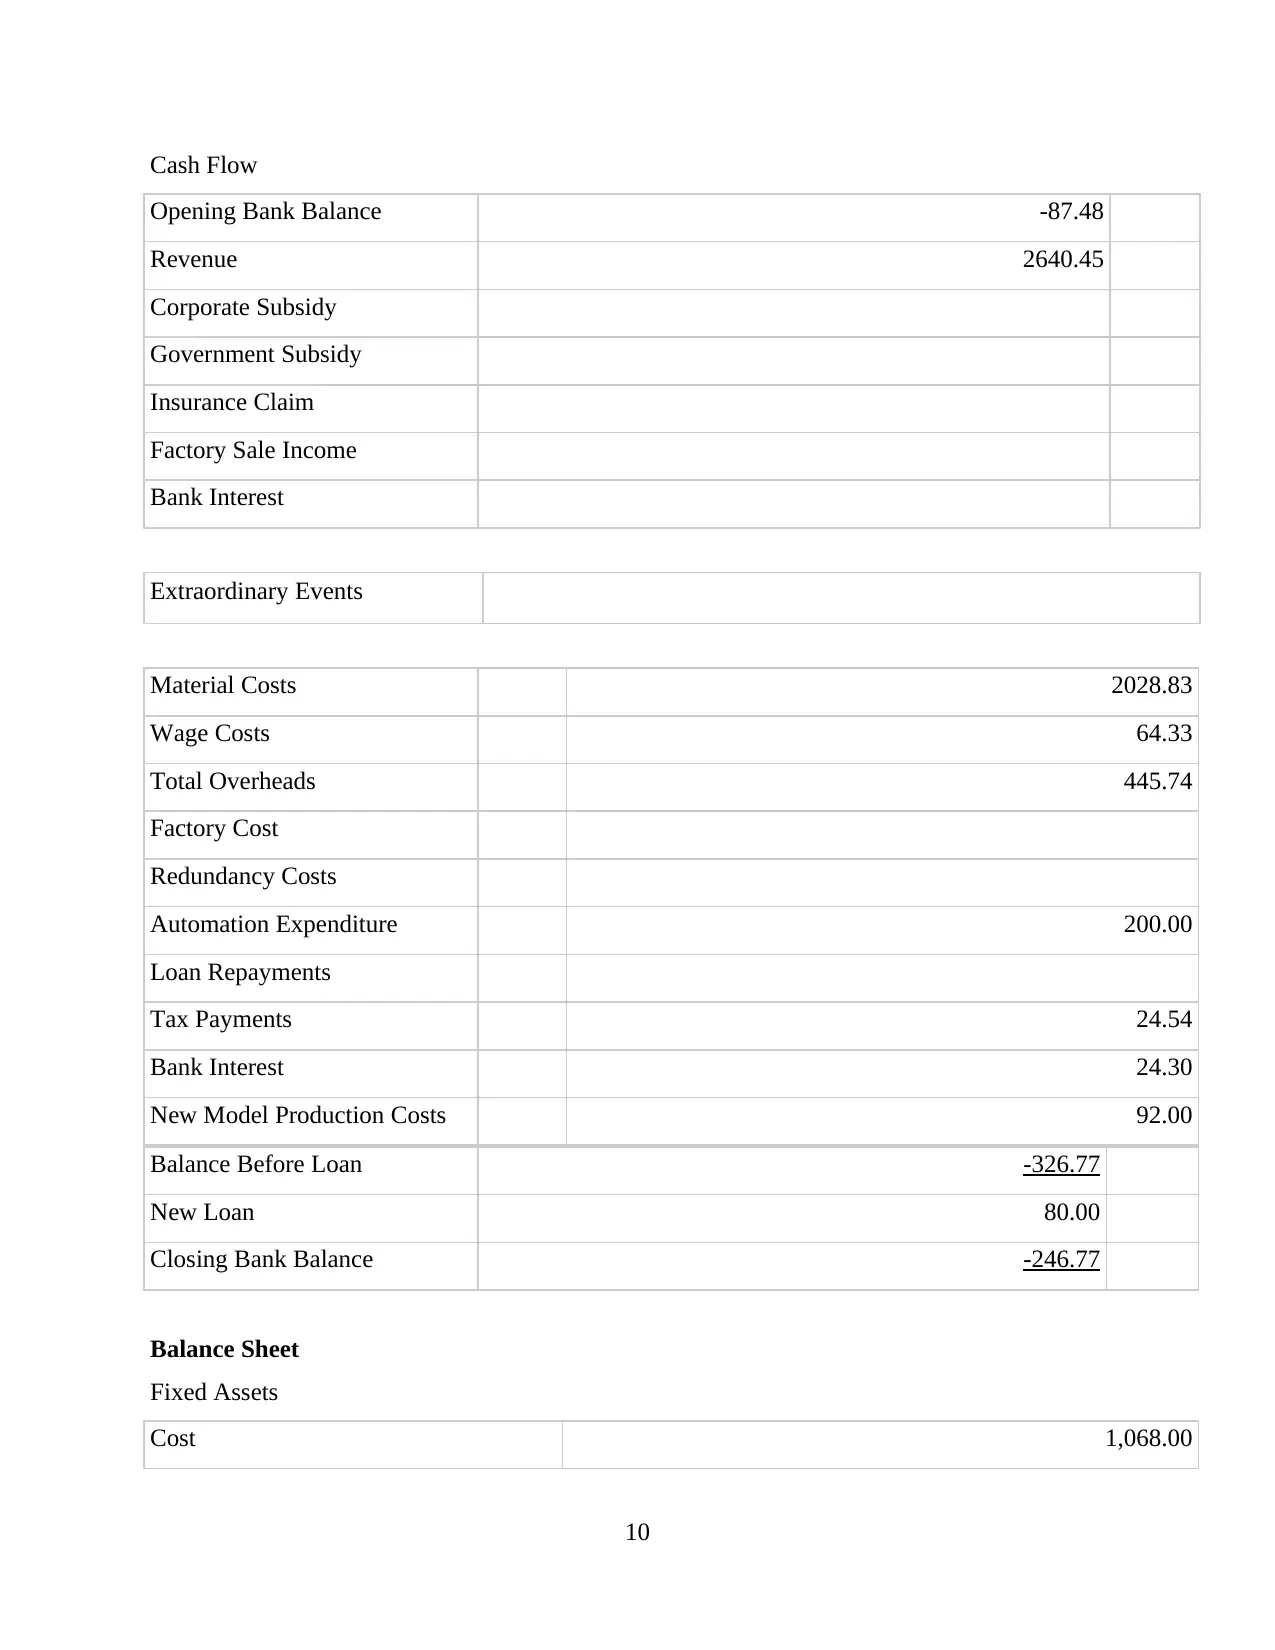
This report provides a comprehensive analysis of Genius Car Ltd's strategic management, focusing on the company's performance and competitive advantage. The report examines key performance indicators (KPIs) across three rounds, evaluating financial metrics such as post-tax profit, market share, and asset values. It details the company's forecasting, decision-making processes, and the outcomes of different strategies, including production levels, market sectors, and workforce management. The report highlights the challenges faced by the company, such as intense competition and technological issues, and assesses the impact of marketing approaches and new model introductions. The analysis covers financial indicators, cash flow, and balance sheet data, offering a detailed view of the company's progress and strategic adjustments over the analyzed period. Finally, the report also includes the evaluation of team performance.

Strategic Management for Competitive
Advantage
Advantage
Paraphrase This Document
Need a fresh take? Get an instant paraphrase of this document with our AI Paraphraser

Contents
INTRODUCTION...........................................................................................................................1
MAIN BODY..................................................................................................................................1
Company performance.................................................................................................................1
Learning.....................................................................................................................................22
CONCLUSION..............................................................................................................................25
Team Performance.....................................................................................................................25
REFERENCES..............................................................................................................................28

INTRODUCTION
Strategic management is crucial part of organisation that will assist business in gaining
competitive edge over other companies (Torres, Ferrar and Santos-Rodrigues, 2018). Strategic
management can be describe as the process of organisation which will includes planning and
implementation of business strategy. This will help in increasing performance and productivity
of organisation as well as help in attain set goals. This report is based on Genius car
organization. This company is manufacturing high quality cars which is affordable for
customers. This organization is based in European market area in order to provide small and
medium vehicles to targeted customers. In this report company performance in properly
evaluated. Different learning about various concepts is determined for increasing decision
making. Apart from this team performance of organization is evaluated.
MAIN BODY
Company performance
Company performance refers as a composite assessment of how well an enterprise
executes or performs on its most essential parameters, typically, market, stakeholders and
financial performance. For this Key performance indicator is a best measurement tool that will
be beneficial for an organisation in measurement of its market and financial performance easily.
In context of Genius Global Car Ltd, KPIs measures their success versus a set of objectives,
industry peers or targets. It can be financial, considering revenue minus certain expenses, net
profit (or the gross profit margin, bottom line), or the current ratio i.e. liquidity and cash
availability. There are different rounds that help in identification of company performance with
the use of balance sheet, cash flow, company report, current cost and data sheet, financial
indicators, decisions included, profit and loss, profit and loss breakdown, production cost,
product life cycle etc. All these are considering best ways for measuring financial performance
of Genius Global Car Ltd in four rounds.
Along with this, there are certain benefits for using Key performance indicators as a
performance measurement tool for Genius Global Car Ltd. These are improving decision
makings, performance evaluation, complete overview of progress towards goals, direct
behaviours and performance visibility. This will help company by keeping real metrics visible to
each and every stakeholder such as scores shows who is and more essentially who is not
1
⊘ This is a preview!⊘
Do you want full access?
Subscribe today to unlock all pages.

Trusted by 1+ million students worldwide

performing. There are most essential financial KPIs that inform business strategy within Genius
Global Car Ltd such as income source, profitability overtime, working capital, revenue growth
and revenue concentration. Therefore, KPIs is essential for company because it gives objective
evidence of growth and progress towards accomplishing desired outcomes. This will also help in
making better and accurate decision easily. According to the Genius Global Car Ltd, KPIs
includes minimum production, gross margin, net cash position, post-tax profit and market share.
Round 1
Forecast
For round 1, forecasted the total assets around to the amount of £750 after deducting the
amount of current liabilities. Even after the presence of tough competition, forecasted about the
attainment of the post-tax profit about £150. It was assumed about the completing all business
activities with positive bank balance in end. This is so because it helps in maintenance of
liquidity and payment of short term liabilities. In last, among the two models G32 and G35
forecasted about the total combined production of cars around 140000.
Result
In respect to the round 1, the favourable results were ascertained but not up to the mark as
forecasted. The total amount of assets remained in hand after completion of first initial phase was
£636.99 after deducting the among of current liabilities. The amount of post-tax profit
ascertained was £86.99. The total number of cars produced in total for both models was 132000.
The aspect about the completing phase with positive bank balance was also not achieved. At end,
there was negative bank balance of £87.48. The main reason behind non ascertainment of all
marks is the intense level of competing and less knowledge about aspects present in market.
Production report
Market Sector Model Name Produced Sold In Stock Model Price £ Market
Share %
5 G32 44000 44000 0 11600.00 0.71
10 G35 88000 88000 0 16200.00 1.60
2
Paraphrase This Document
Need a fresh take? Get an instant paraphrase of this document with our AI Paraphraser

Market
Sector
Model
Name Workforce Materials
Cost £
Design and
Options Cost £
Labor
Cost £
Gross
Margin
%
Produc
tivity
5 G32 1000 6660.00 1092.01 534.46 28.56 44.00
10 G35 2000 9120.00 2007.37 534.46 28.01 44.00
Market
Sector
Model
Name
Target
Production
Potential Productivity
Cars/Worker/Year
Potential
Productivity with
Overtime
Warranty
Cost per
Car £
5 G32 44000 42.59 51.11 155.04
10 G35 88000 41.84 50.21 222.55
Workforce 3000
Strike Days 4
Productivity (cars/worker/year) 44.00
Productivity Index 1.03
Total Market (m) Small Medium Large Luxury
Size 6.18 5.49 3.09 0.80
Profit and Loss
Sales 1936.00
Cost of Sales* 1390.85
Gross Profit (Loss) 545.15
Fixed Overheads 141.00
Stock Upkeep Cost
Product Recall Cost
Promotion 50.00
Research and Development 124.25
Professional Charges 10.00
3
Sector
Model
Name Workforce Materials
Cost £
Design and
Options Cost £
Labor
Cost £
Gross
Margin
%
Produc
tivity
5 G32 1000 6660.00 1092.01 534.46 28.56 44.00
10 G35 2000 9120.00 2007.37 534.46 28.01 44.00
Market
Sector
Model
Name
Target
Production
Potential Productivity
Cars/Worker/Year
Potential
Productivity with
Overtime
Warranty
Cost per
Car £
5 G32 44000 42.59 51.11 155.04
10 G35 88000 41.84 50.21 222.55
Workforce 3000
Strike Days 4
Productivity (cars/worker/year) 44.00
Productivity Index 1.03
Total Market (m) Small Medium Large Luxury
Size 6.18 5.49 3.09 0.80
Profit and Loss
Sales 1936.00
Cost of Sales* 1390.85
Gross Profit (Loss) 545.15
Fixed Overheads 141.00
Stock Upkeep Cost
Product Recall Cost
Promotion 50.00
Research and Development 124.25
Professional Charges 10.00
3

Warranty Claims 26.41
Training Cost 0.80
Extraordinary Events
Depreciation 77.60
Operating Profit (Loss) 115.10
Interest on Current Account
Interest on Loans 3.58
Cost of Redundancies
Factory Sale Loss
Pre Tax Profit (Loss) 111.52
Tax 24.54
Post Tax Profit (Loss) 86.99
*Cost of Sales Breakdown
Opening Stock 0.00
plus Materials Costs 1320.30
plus Wages 70.55
minus Closing Stock 0.00
Cost of Sales 1390.85
Financial Indicators
Outstanding Debt £m 50.00
Return On Assets % 13.66
Current Ratio 0.72
Gross Margin % 28.16
Quick Ratio 0.72
Post Tax Profit / Sales % 4.49
4
⊘ This is a preview!⊘
Do you want full access?
Subscribe today to unlock all pages.

Trusted by 1+ million students worldwide

Liquidity Ratio 0.00
Profit / Employee £ 37174.31
Return on Shareholders’ Funds % 14.82
Cash Flow
Opening Bank Balance 500.00
Revenue 1776.88
Corporate Subsidy
Government Subsidy
Insurance Claim
Factory Sale Income
Bank Interest
Extraordinary Events
Material Costs 1211.78
Wage Costs 70.55
Total Overheads 352.45
Factory Cost 670.00
Redundancy Costs
Automation Expenditure 6.00
Loan Repayments
Tax Payments
Bank Interest 3.58
New Model Production Costs 100.00
Balance Before Loan -137.48
New Loan 50.00
Closing Bank Balance -87.48
5
Paraphrase This Document
Need a fresh take? Get an instant paraphrase of this document with our AI Paraphraser

Balance Sheet
Fixed Assets
Cost 776.00
Depreciation -77.60
Book Value 698.40
Current Assets
Stock Value 0.00
Debtors 159.12
Bank Balance
Current Liabilities
Tax 24.54
Creditors 108.52
Overdraft 87.48
Net Current Assets (or Liabilities) -61.41
Total Assets Less Current Liabilities 636.99
Capital and Reserves
Share Equity 500.00
Total Retained Profit (Loss) 86.99
Total Subsidies
Total Shareholders’ Funds 586.99
Long Term Liabilities
Loan 50.00
Loan 50.00
Round 2
Decision and Forecast
6

In round 2, according to the ascertained information decision was taken regarding the
production of new model i.e. G40. Also, in accordance to the improved situations with industry
decision taken about improvement of the forecasting aspects. Here, in this phase forecasted about
the production of total 165000 cars in all three models. The amount fixed to attainted as post tax
profit was around £100. As the business grow, focused over the improvement of total assets up to
the amount of £700. Here, also forecasted about the attaining positive balance of bank
Results
In this round, results are quite significant as per the forecasted figures. The post-tax profit
was in negative of £ 22.16. The production is quite equivalent along with the amount of total
assets. But, in the case of cash balance the amount goes more in negative. The overall situation,
depicts that second phase was not good as compared to the one along with the forecasted
scenario. The main reason behind this was technological issues and ineffective marketing
approaches.
Production report
Market Sector Model Name Produced Sold In Stock Model Price £ Market Share %
5 G32 44000 44000 0 11600.00 0.70
10 G35 88000 88000 0 16200.00 1.60
11 G40 29900 29900 0 25670.00 0.99
Market
Sector
Model
Name Workforce Materials Cost £ Design and
Options Cost £
Labour
Cost £
Gross
Margin
%
Productivity
5 G32 1000 6803.65 2411.07 395.16 17.16 44.00
10 G35 2000 9316.71 4226.58 395.16 13.96 44.00
11 G40 700 13535.79 3020.20 407.06 33.92 42.71
Market
Sector
Model
Name
Target
Production
Potential Productivity
Cars/Worker/Year
Potential
Productivity with
Overtime
Warranty Cost
per Car £
5 G32 44000 55.25 66.30 175.56
10 G35 88000 70.11 84.13 260.06
7
⊘ This is a preview!⊘
Do you want full access?
Subscribe today to unlock all pages.

Trusted by 1+ million students worldwide

Market
Sector
Model
Name Workforce Materials Cost £ Design and
Options Cost £
Labour
Cost £
Gross
Margin
%
Productivity
11 G40 29900 104.78 125.74 503.30
Workforce 3700
Strike Days 5
Productivity (cars/worker/year) 43.76
Productivity Index 1.03
Total Market (m) Small Medium Large Luxury
Size 6.27 5.51 3.03 0.77
Profit and Loss Account
Sales 2703.53
Cost of Sales* 2156.61
Gross Profit (Loss) 546.92
Fixed Overheads 207.92
Stock Upkeep Cost
Product Recall Cost
Promotion 30.00
Research and Development 141.04
Professional Charges 20.32
Warranty Claims 45.66
Training Cost 0.80
Extraordinary Events
8
Paraphrase This Document
Need a fresh take? Get an instant paraphrase of this document with our AI Paraphraser

*Cost of Sales Breakdown
Opening Stock 0.00
plus Materials Costs 2092.28
plus Wages 64.33
minus Closing Stock 0.00
Cost of Sales 2156.61
Pre Tax Profit (Loss) -22.16
Tax
Post Tax Profit (Loss) -22.16
Cost of Redundancies
Factory Sale Loss
Interest on Current Account 13.12
Interest on Loans 11.17
Operating Profit (Loss) 2.14
Depreciation 99.04
Financial Indicator
Outstanding Debt £m 130.00
Return On Assets % -3.19
Current Ratio 0.53
Gross Margin % 20.23
Quick Ratio 0.53
Post Tax Profit / Sales % -0.82
Liquidity Ratio 0.00
Profit / Employee £ -5988.42
Return on Shareholders’ Funds % -3.92
9

Cash Flow
Opening Bank Balance -87.48
Revenue 2640.45
Corporate Subsidy
Government Subsidy
Insurance Claim
Factory Sale Income
Bank Interest
Extraordinary Events
Material Costs 2028.83
Wage Costs 64.33
Total Overheads 445.74
Factory Cost
Redundancy Costs
Automation Expenditure 200.00
Loan Repayments
Tax Payments 24.54
Bank Interest 24.30
New Model Production Costs 92.00
Balance Before Loan -326.77
New Loan 80.00
Closing Bank Balance -246.77
Balance Sheet
Fixed Assets
Cost 1,068.00
10
⊘ This is a preview!⊘
Do you want full access?
Subscribe today to unlock all pages.

Trusted by 1+ million students worldwide
1 out of 30