Finance Management Report: Geodes Retail Business Venture Analysis
VerifiedAdded on 2021/03/25
|23
|5855
|124
Report
AI Summary
This finance management report presents a financial analysis of a new retail venture focused on selling geodes and decorative stones. The report includes a detailed executive summary, project description, and assumptions, followed by a break-even analysis to determine the point of profitability. It also provides profit and loss statements, balance sheets, and both monthly and annual cash flow statements to project the financial performance of the business. Sensitivity analysis is conducted to assess the impact of various factors on the financial outcomes. The report concludes with recommendations based on the financial projections and analysis, providing insights into the venture's feasibility and financial viability. The analysis covers key financial aspects like sales, costs, expenses, and profitability, offering a comprehensive overview of the business's financial health and future prospects.
Running head: FINANCE MANAGEMENT
Finance management
Name of the student
Name of the university
Student ID
Author note
Finance management
Name of the student
Name of the university
Student ID
Author note
Paraphrase This Document
Need a fresh take? Get an instant paraphrase of this document with our AI Paraphraser
1
FINANCE MANAGEMENT
Table of Contents
Executive Summary.........................................................................................................................2
Description of the project................................................................................................................2
Breakeven analysis..........................................................................................................................2
Profit and loss statement and balance Sheet Statement...................................................................4
Monthly Cash flow Statement.........................................................................................................7
Annual Cash Flow Statement..........................................................................................................8
Sensitivity analysis..........................................................................................................................9
Conclusion and recommendation..................................................................................................12
Bibliography..................................................................................................................................17
2
FINANCE MANAGEMENT
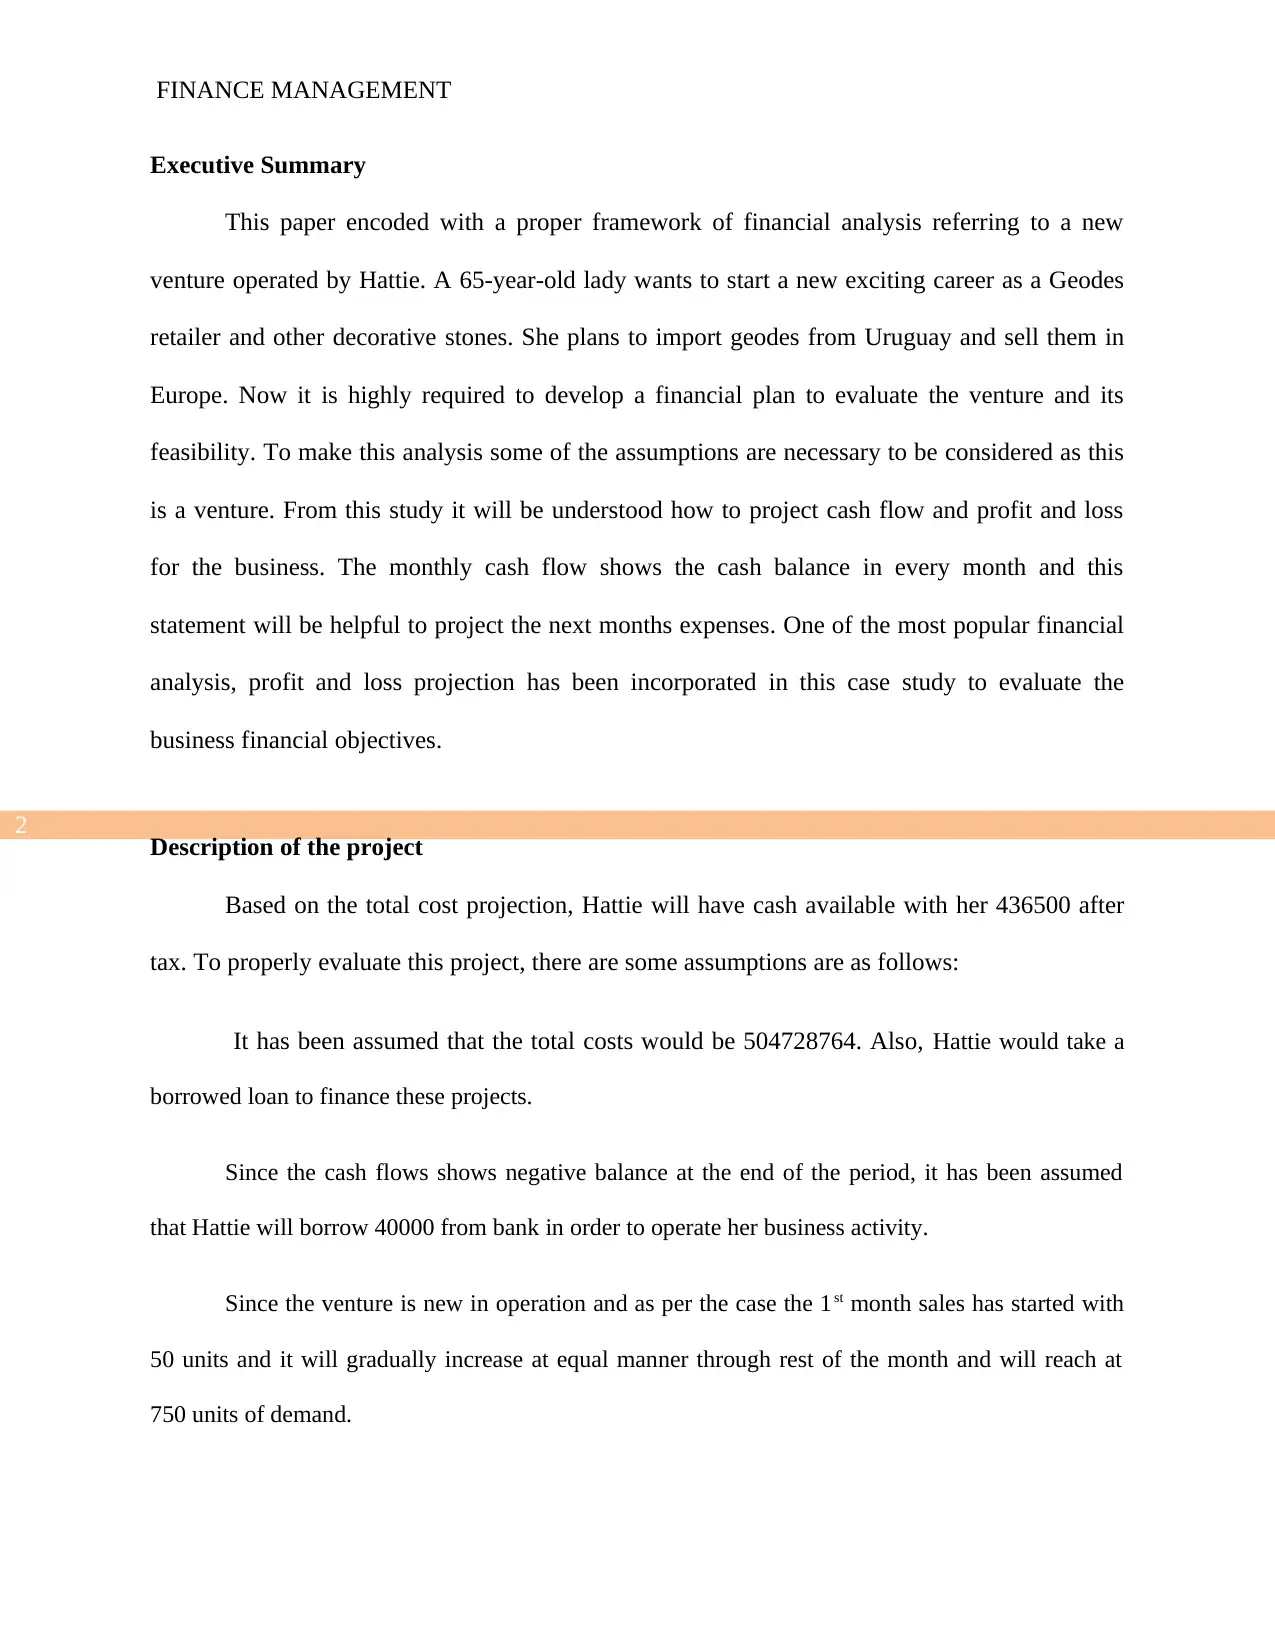
Executive Summary
This paper encoded with a proper framework of financial analysis referring to a new
venture operated by Hattie. A 65-year-old lady wants to start a new exciting career as a Geodes
retailer and other decorative stones. She plans to import geodes from Uruguay and sell them in
Europe. Now it is highly required to develop a financial plan to evaluate the venture and its
feasibility. To make this analysis some of the assumptions are necessary to be considered as this
is a venture. From this study it will be understood how to project cash flow and profit and loss
for the business. The monthly cash flow shows the cash balance in every month and this
statement will be helpful to project the next months expenses. One of the most popular financial
analysis, profit and loss projection has been incorporated in this case study to evaluate the
business financial objectives.
Description of the project
Based on the total cost projection, Hattie will have cash available with her 436500 after
tax. To properly evaluate this project, there are some assumptions are as follows:
It has been assumed that the total costs would be 504728764. Also, Hattie would take a
borrowed loan to finance these projects.
Since the cash flows shows negative balance at the end of the period, it has been assumed
that Hattie will borrow 40000 from bank in order to operate her business activity.
Since the venture is new in operation and as per the case the 1st month sales has started with
50 units and it will gradually increase at equal manner through rest of the month and will reach at
750 units of demand.
FINANCE MANAGEMENT
Executive Summary
This paper encoded with a proper framework of financial analysis referring to a new
venture operated by Hattie. A 65-year-old lady wants to start a new exciting career as a Geodes
retailer and other decorative stones. She plans to import geodes from Uruguay and sell them in
Europe. Now it is highly required to develop a financial plan to evaluate the venture and its
feasibility. To make this analysis some of the assumptions are necessary to be considered as this
is a venture. From this study it will be understood how to project cash flow and profit and loss
for the business. The monthly cash flow shows the cash balance in every month and this
statement will be helpful to project the next months expenses. One of the most popular financial
analysis, profit and loss projection has been incorporated in this case study to evaluate the
business financial objectives.
Description of the project
Based on the total cost projection, Hattie will have cash available with her 436500 after
tax. To properly evaluate this project, there are some assumptions are as follows:
It has been assumed that the total costs would be 504728764. Also, Hattie would take a
borrowed loan to finance these projects.
Since the cash flows shows negative balance at the end of the period, it has been assumed
that Hattie will borrow 40000 from bank in order to operate her business activity.
Since the venture is new in operation and as per the case the 1st month sales has started with
50 units and it will gradually increase at equal manner through rest of the month and will reach at
750 units of demand.
⊘ This is a preview!⊘
Do you want full access?
Subscribe today to unlock all pages.
Trusted by 1+ million students worldwide
3
FINANCE MANAGEMENT
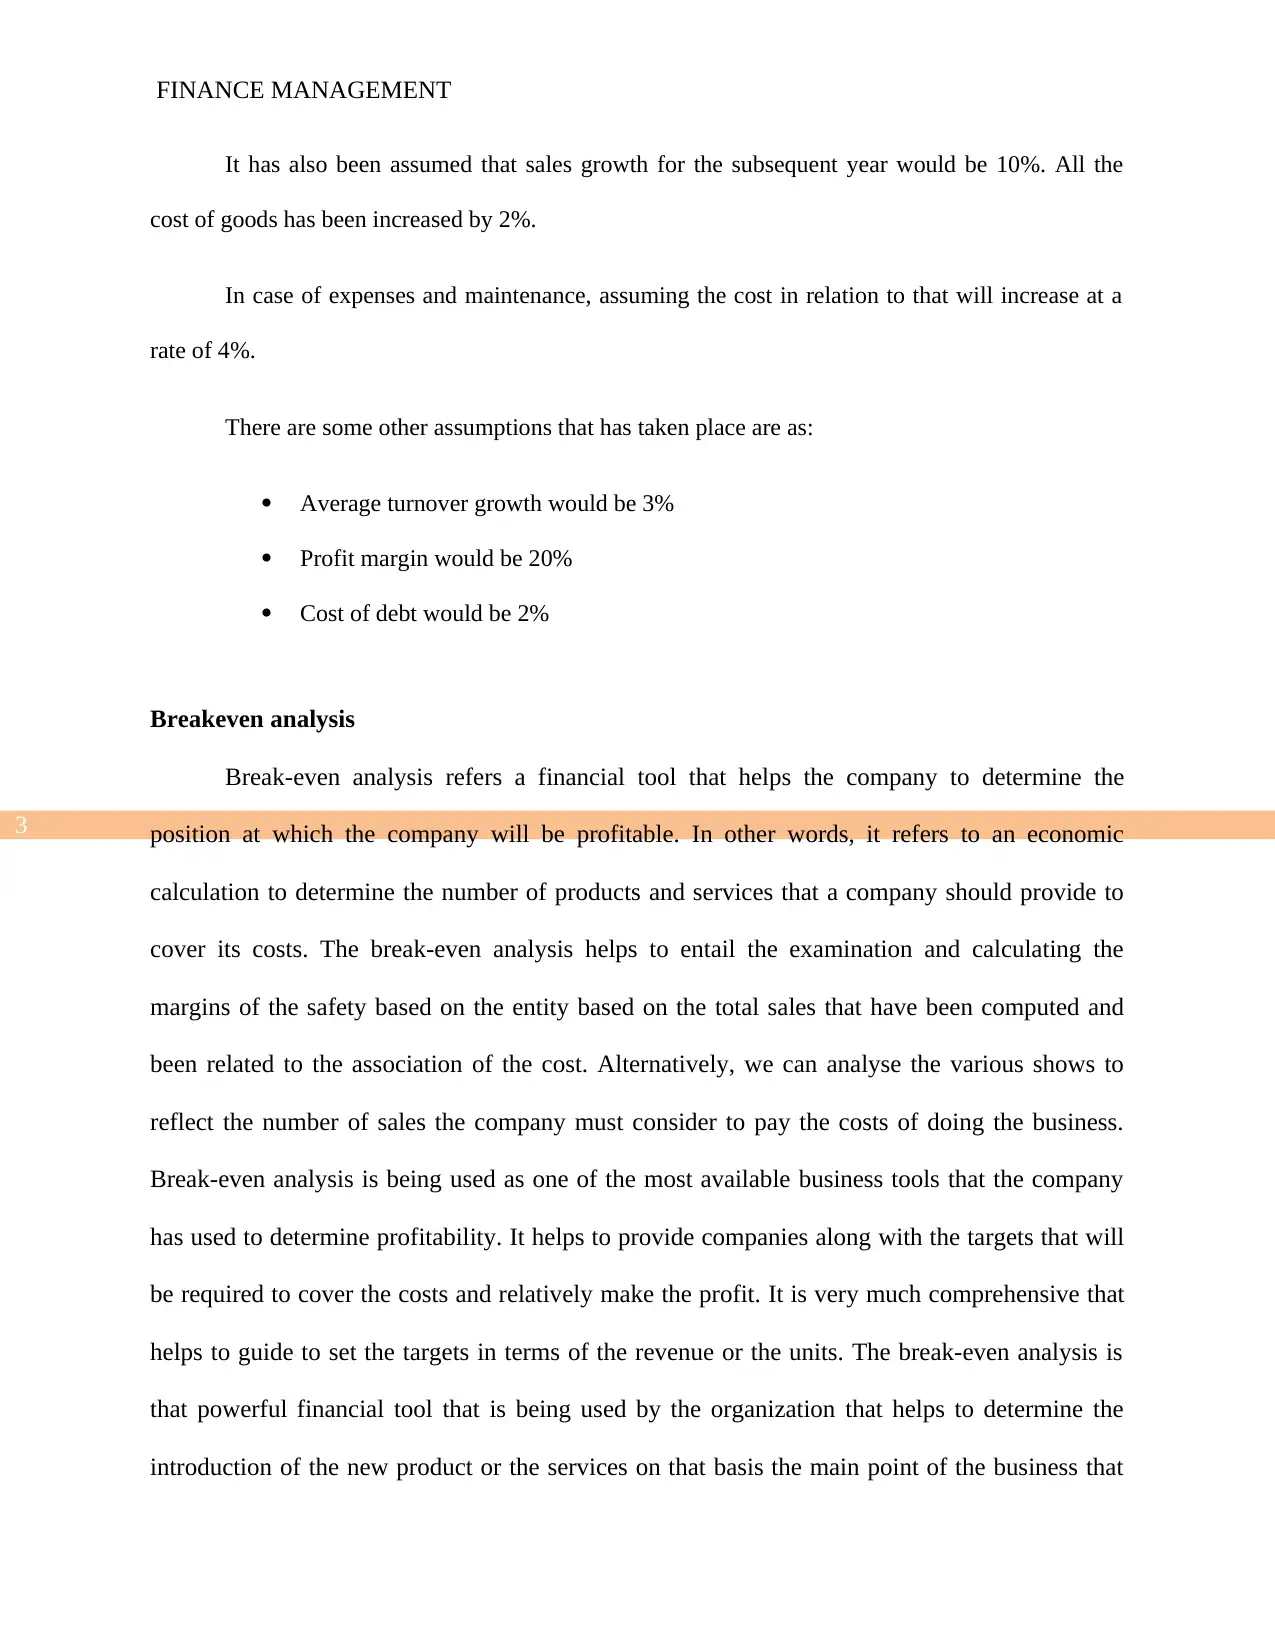
It has also been assumed that sales growth for the subsequent year would be 10%. All the
cost of goods has been increased by 2%.
In case of expenses and maintenance, assuming the cost in relation to that will increase at a
rate of 4%.
There are some other assumptions that has taken place are as:
Average turnover growth would be 3%
Profit margin would be 20%
Cost of debt would be 2%
Breakeven analysis
Break-even analysis refers a financial tool that helps the company to determine the
position at which the company will be profitable. In other words, it refers to an economic
calculation to determine the number of products and services that a company should provide to
cover its costs. The break-even analysis helps to entail the examination and calculating the
margins of the safety based on the entity based on the total sales that have been computed and
been related to the association of the cost. Alternatively, we can analyse the various shows to
reflect the number of sales the company must consider to pay the costs of doing the business.
Break-even analysis is being used as one of the most available business tools that the company
has used to determine profitability. It helps to provide companies along with the targets that will
be required to cover the costs and relatively make the profit. It is very much comprehensive that
helps to guide to set the targets in terms of the revenue or the units. The break-even analysis is
that powerful financial tool that is being used by the organization that helps to determine the
introduction of the new product or the services on that basis the main point of the business that
FINANCE MANAGEMENT
It has also been assumed that sales growth for the subsequent year would be 10%. All the
cost of goods has been increased by 2%.
In case of expenses and maintenance, assuming the cost in relation to that will increase at a
rate of 4%.
There are some other assumptions that has taken place are as:
Average turnover growth would be 3%
Profit margin would be 20%
Cost of debt would be 2%
Breakeven analysis
Break-even analysis refers a financial tool that helps the company to determine the
position at which the company will be profitable. In other words, it refers to an economic
calculation to determine the number of products and services that a company should provide to
cover its costs. The break-even analysis helps to entail the examination and calculating the
margins of the safety based on the entity based on the total sales that have been computed and
been related to the association of the cost. Alternatively, we can analyse the various shows to
reflect the number of sales the company must consider to pay the costs of doing the business.
Break-even analysis is being used as one of the most available business tools that the company
has used to determine profitability. It helps to provide companies along with the targets that will
be required to cover the costs and relatively make the profit. It is very much comprehensive that
helps to guide to set the targets in terms of the revenue or the units. The break-even analysis is
that powerful financial tool that is being used by the organization that helps to determine the
introduction of the new product or the services on that basis the main point of the business that
Paraphrase This Document
Need a fresh take? Get an instant paraphrase of this document with our AI Paraphraser
4
FINANCE MANAGEMENT
may turn out to be very much profitable. Alternatively, the financial calculation that has been
used in order to determine the number of the products or the services that will be required to sell
out the least that helps to cover the costs of the business. The break-even analysis helps to make
sure that the business organizations helps to make sure that the losses and the profits have been
correctly measured based on the different level of the sales and the production, it further helps to
understand and the predict the various effect on the changes within the process of the revenues. It
helps to analyse the relationship between variable costs and the fixed costs. It further helps to
predict the effects of the price and the efficiency of the various changes based on profitability.
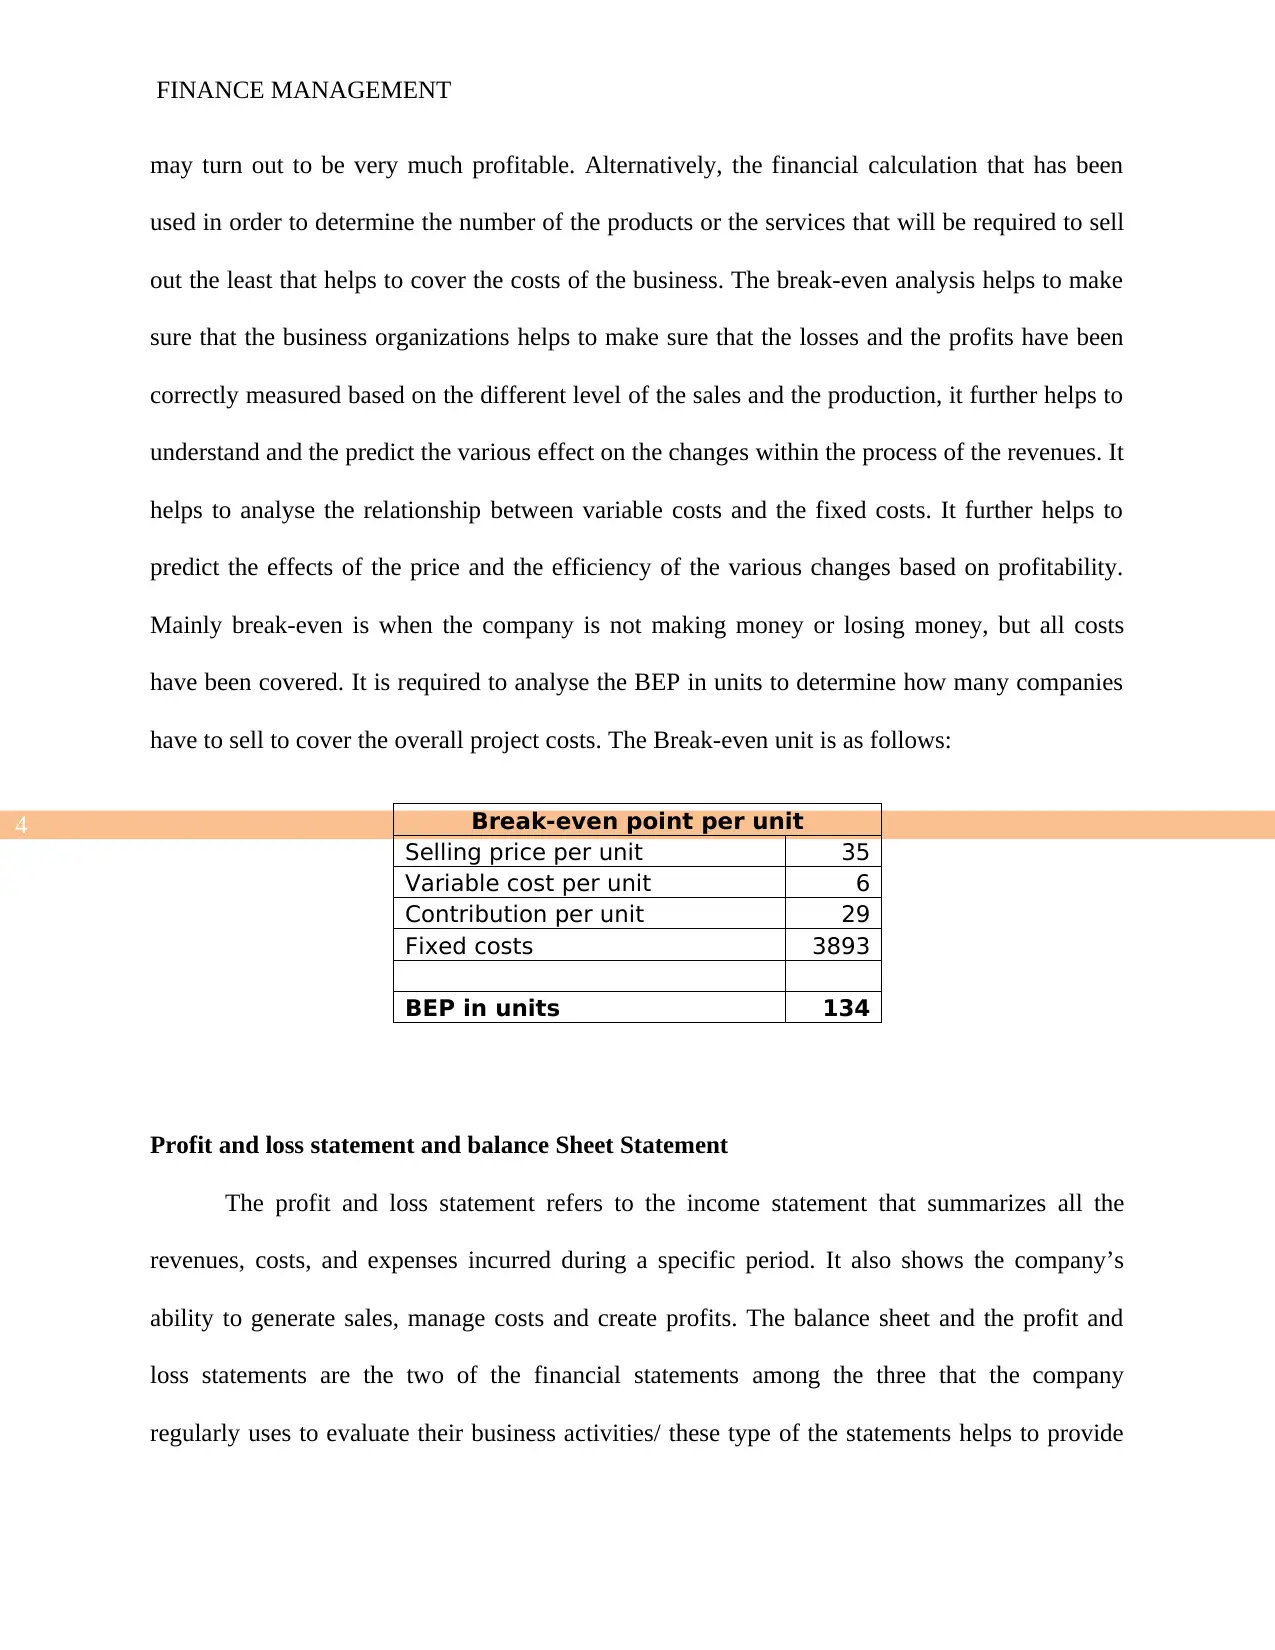
Mainly break-even is when the company is not making money or losing money, but all costs
have been covered. It is required to analyse the BEP in units to determine how many companies
have to sell to cover the overall project costs. The Break-even unit is as follows:
Break-even point per unit
Selling price per unit 35
Variable cost per unit 6
Contribution per unit 29
Fixed costs 3893
BEP in units 134
Profit and loss statement and balance Sheet Statement
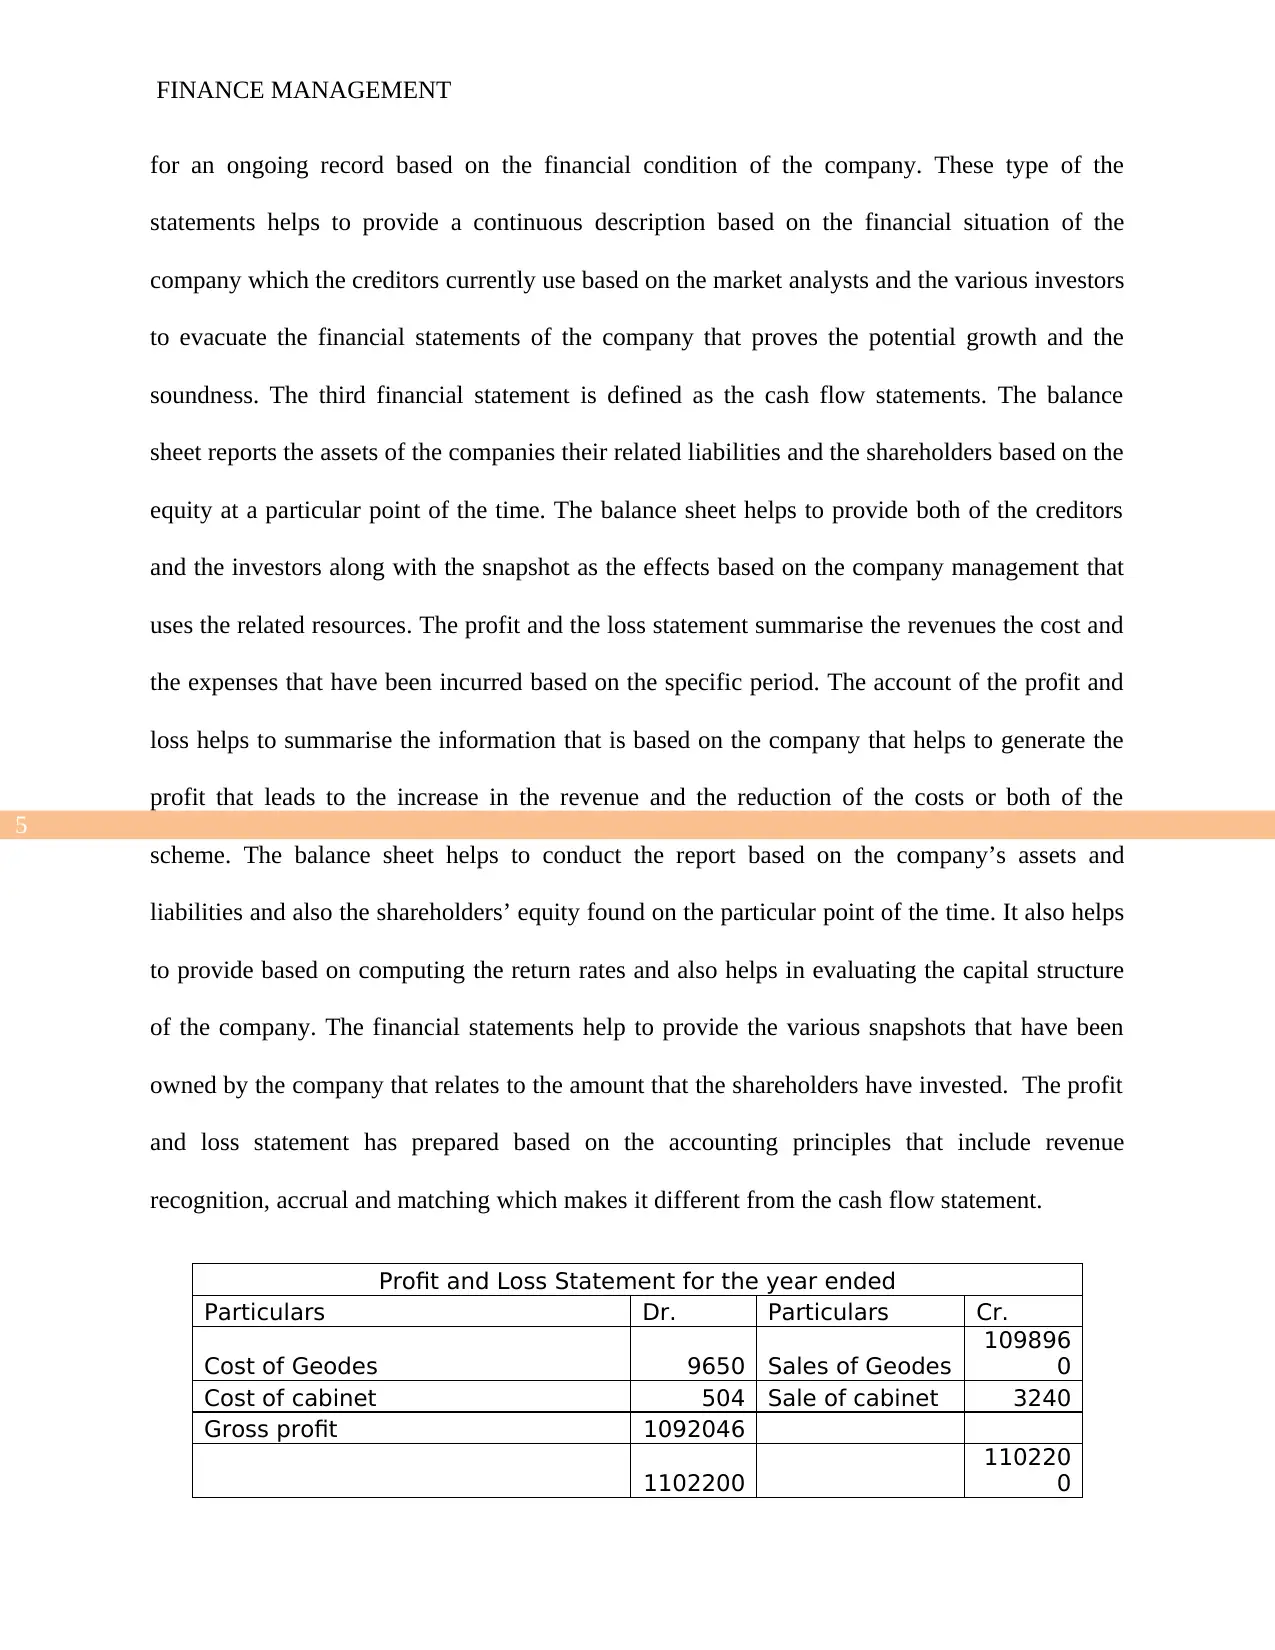
The profit and loss statement refers to the income statement that summarizes all the
revenues, costs, and expenses incurred during a specific period. It also shows the company’s
ability to generate sales, manage costs and create profits. The balance sheet and the profit and
loss statements are the two of the financial statements among the three that the company
regularly uses to evaluate their business activities/ these type of the statements helps to provide
FINANCE MANAGEMENT
may turn out to be very much profitable. Alternatively, the financial calculation that has been
used in order to determine the number of the products or the services that will be required to sell
out the least that helps to cover the costs of the business. The break-even analysis helps to make
sure that the business organizations helps to make sure that the losses and the profits have been
correctly measured based on the different level of the sales and the production, it further helps to
understand and the predict the various effect on the changes within the process of the revenues. It
helps to analyse the relationship between variable costs and the fixed costs. It further helps to
predict the effects of the price and the efficiency of the various changes based on profitability.
Mainly break-even is when the company is not making money or losing money, but all costs
have been covered. It is required to analyse the BEP in units to determine how many companies
have to sell to cover the overall project costs. The Break-even unit is as follows:
Break-even point per unit
Selling price per unit 35
Variable cost per unit 6
Contribution per unit 29
Fixed costs 3893
BEP in units 134
Profit and loss statement and balance Sheet Statement
The profit and loss statement refers to the income statement that summarizes all the
revenues, costs, and expenses incurred during a specific period. It also shows the company’s
ability to generate sales, manage costs and create profits. The balance sheet and the profit and
loss statements are the two of the financial statements among the three that the company
regularly uses to evaluate their business activities/ these type of the statements helps to provide
5
FINANCE MANAGEMENT
for an ongoing record based on the financial condition of the company. These type of the
statements helps to provide a continuous description based on the financial situation of the
company which the creditors currently use based on the market analysts and the various investors
to evacuate the financial statements of the company that proves the potential growth and the
soundness. The third financial statement is defined as the cash flow statements. The balance
sheet reports the assets of the companies their related liabilities and the shareholders based on the
equity at a particular point of the time. The balance sheet helps to provide both of the creditors
and the investors along with the snapshot as the effects based on the company management that
uses the related resources. The profit and the loss statement summarise the revenues the cost and
the expenses that have been incurred based on the specific period. The account of the profit and
loss helps to summarise the information that is based on the company that helps to generate the
profit that leads to the increase in the revenue and the reduction of the costs or both of the
scheme. The balance sheet helps to conduct the report based on the company’s assets and
liabilities and also the shareholders’ equity found on the particular point of the time. It also helps
to provide based on computing the return rates and also helps in evaluating the capital structure
of the company. The financial statements help to provide the various snapshots that have been
owned by the company that relates to the amount that the shareholders have invested. The profit
and loss statement has prepared based on the accounting principles that include revenue
recognition, accrual and matching which makes it different from the cash flow statement.
Profit and Loss Statement for the year ended
Particulars Dr. Particulars Cr.
Cost of Geodes 9650 Sales of Geodes
109896
0
Cost of cabinet 504 Sale of cabinet 3240
Gross profit 1092046
1102200
110220
0
⊘ This is a preview!⊘
Do you want full access?
Subscribe today to unlock all pages.
Trusted by 1+ million students worldwide
6
FINANCE MANAGEMENT
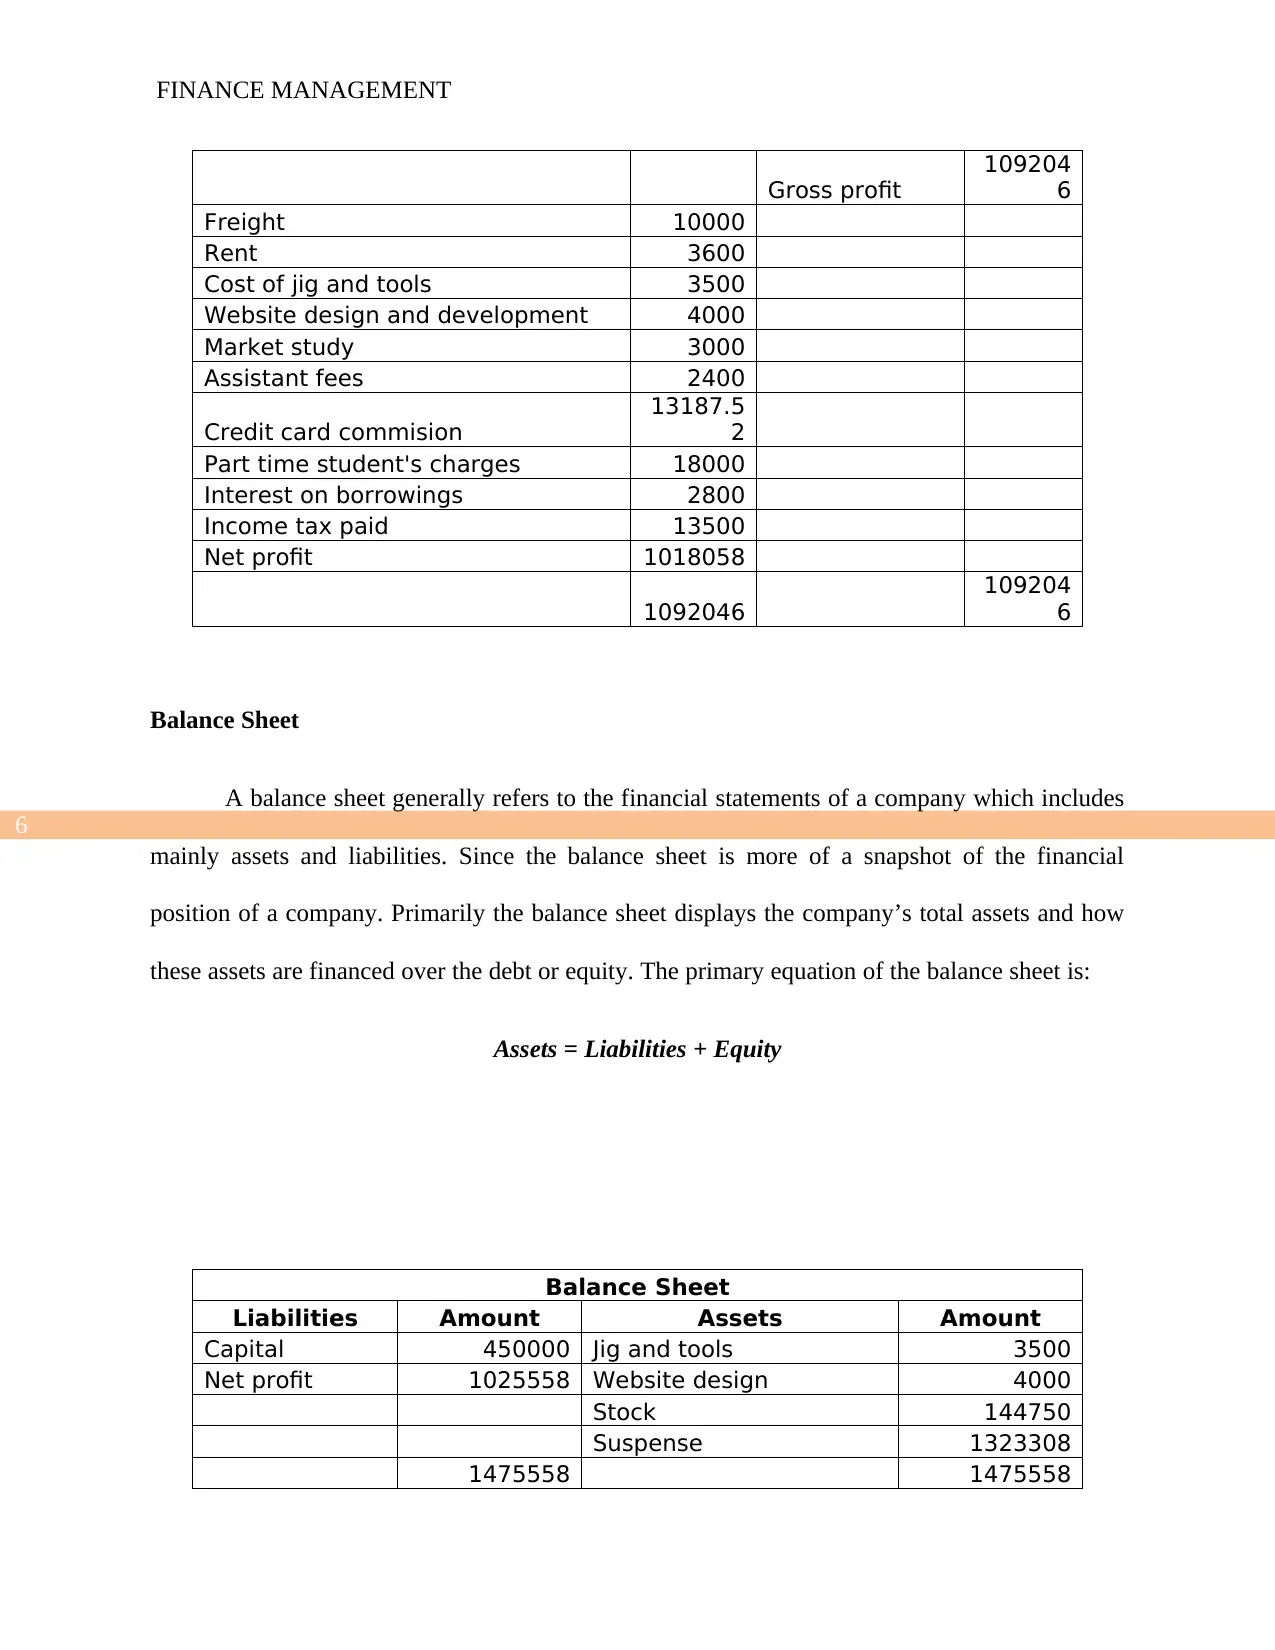
Gross profit
109204
6
Freight 10000
Rent 3600
Cost of jig and tools 3500
Website design and development 4000
Market study 3000
Assistant fees 2400
Credit card commision
13187.5
2
Part time student's charges 18000
Interest on borrowings 2800
Income tax paid 13500
Net profit 1018058
1092046
109204
6
Balance Sheet
A balance sheet generally refers to the financial statements of a company which includes
mainly assets and liabilities. Since the balance sheet is more of a snapshot of the financial
position of a company. Primarily the balance sheet displays the company’s total assets and how
these assets are financed over the debt or equity. The primary equation of the balance sheet is:
Assets = Liabilities + Equity
Balance Sheet
Liabilities Amount Assets Amount
Capital 450000 Jig and tools 3500
Net profit 1025558 Website design 4000
Stock 144750
Suspense 1323308
1475558 1475558
FINANCE MANAGEMENT
Gross profit
109204
6
Freight 10000
Rent 3600
Cost of jig and tools 3500
Website design and development 4000
Market study 3000
Assistant fees 2400
Credit card commision
13187.5
2
Part time student's charges 18000
Interest on borrowings 2800
Income tax paid 13500
Net profit 1018058
1092046
109204
6
Balance Sheet
A balance sheet generally refers to the financial statements of a company which includes
mainly assets and liabilities. Since the balance sheet is more of a snapshot of the financial
position of a company. Primarily the balance sheet displays the company’s total assets and how
these assets are financed over the debt or equity. The primary equation of the balance sheet is:
Assets = Liabilities + Equity
Balance Sheet
Liabilities Amount Assets Amount
Capital 450000 Jig and tools 3500
Net profit 1025558 Website design 4000
Stock 144750
Suspense 1323308
1475558 1475558
Paraphrase This Document
Need a fresh take? Get an instant paraphrase of this document with our AI Paraphraser
7
FINANCE MANAGEMENT
Cash flow statement
The cash flow statement is a statement that summarizes the amount of the cash and cash
equivalents. By the cash flow statement, it envisages that how well the company generates
money in order to pay the debt obligations. And will fund its operating expenses. The company
helps to produce the three primary financial statement that reflects upon the various activities of
the business and the different profitability on the basis of each of the accounting periods. These
types of statements are the income statement, balance sheet and cash flow statements. The
related cash flow statements help to show how the company that had been chosen in the
following assignment in order to perform and how well equipped the company so that it manages
the cash in order to provide funding the various operations and helps in the expansion of the
efforts. The article explains the balance sheet and the income statements and considers their
related differences. The balance sheet helps to show the resources that have been available to the
company based on the assets and it helps to show the assets that need to be financed. The debt
through which it helps to determine whether the debt under the liabilities have been used by
issuing the various equities that have been portrayed within the shareholder's equity. The balance
sheet helps to provide both the investors and the creditors that have the relaxant snapshot based
on how effectively the management of the company uses the related and provided resources.
There have been various financial statements that have the balance sheet that has been used in
order to conduct the financial analysis on the basis of the calculation based on the financial
ratios. There are certain items on the typical types of balance sheet. The income statements that
have been often termed as the profit or the loss statements that need to predict the cost, expenses
8
FINANCE MANAGEMENT
and the revenues over the period that might typically record the fiscal amounts of the company
the income statements help to tell the investors about the company that helps in generating the
profit or the loss. The income statements provide valuable information.
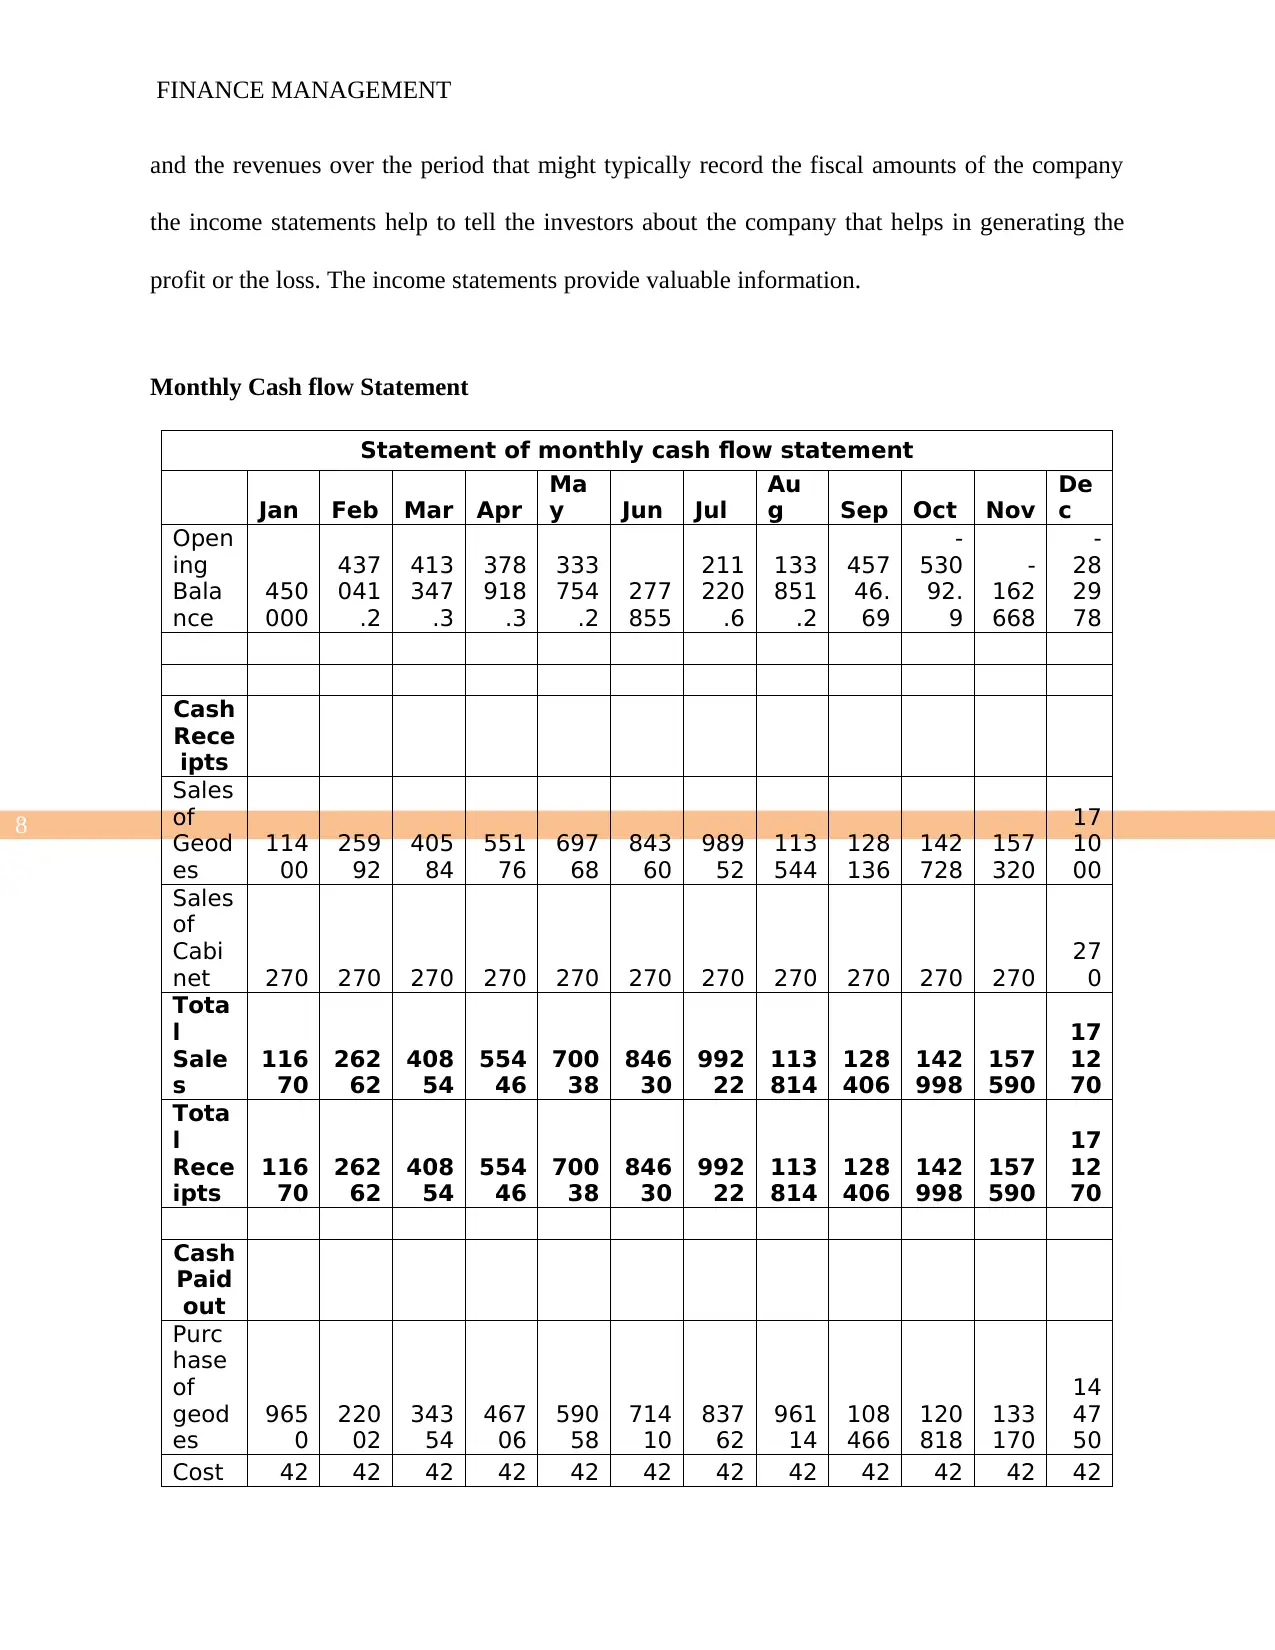
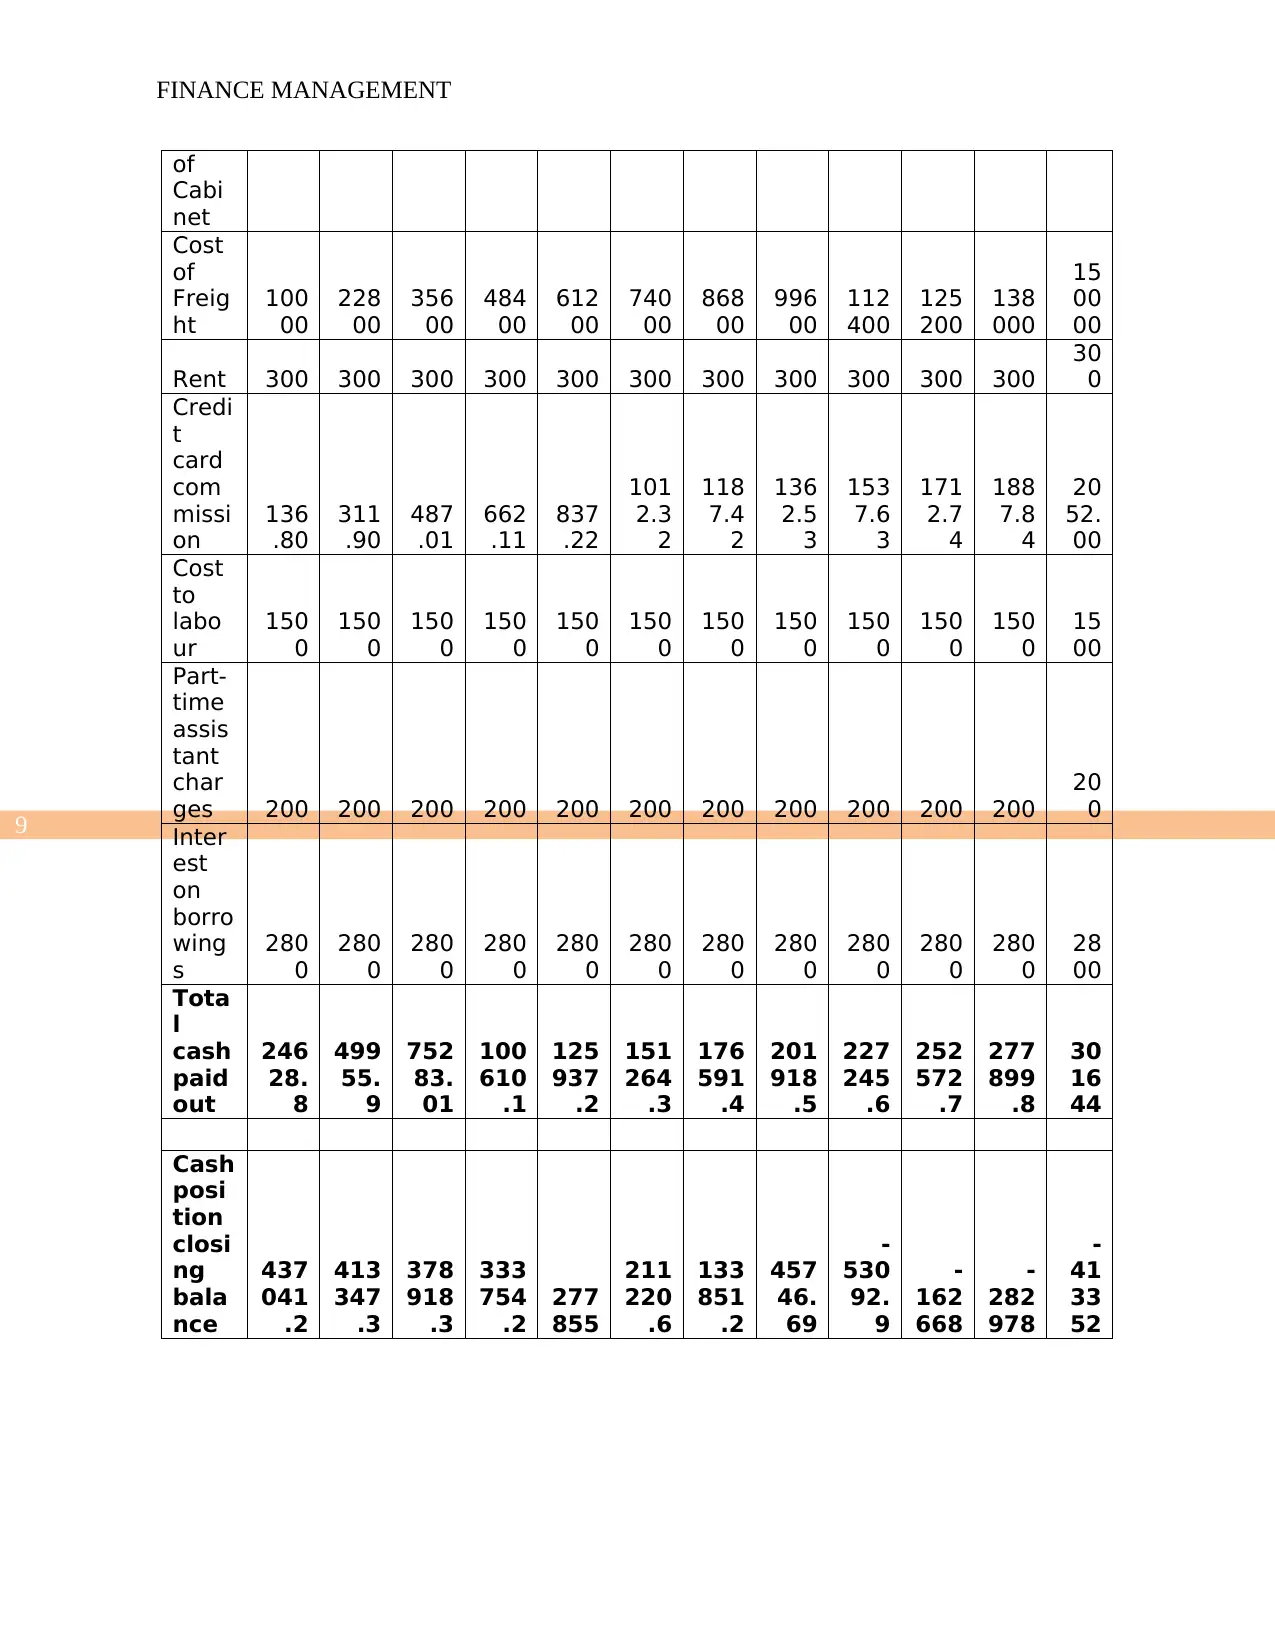
Monthly Cash flow Statement
Statement of monthly cash flow statement
Jan Feb Mar Apr
Ma
y Jun Jul
Au
g Sep Oct Nov
De
c
Open
ing
Bala
nce
450
000
437
041
.2
413
347
.3
378
918
.3
333
754
.2
277
855
211
220
.6
133
851
.2
457
46.
69
-
530
92.
9
-
162
668
-
28
29
78
Cash
Rece
ipts
Sales
of
Geod
es
114
00
259
92
405
84
551
76
697
68
843
60
989
52
113
544
128
136
142
728
157
320
17
10
00
Sales
of
Cabi
net 270 270 270 270 270 270 270 270 270 270 270
27
0
Tota
l
Sale
s
116
70
262
62
408
54
554
46
700
38
846
30
992
22
113
814
128
406
142
998
157
590
17
12
70
Tota
l
Rece
ipts
116
70
262
62
408
54
554
46
700
38
846
30
992
22
113
814
128
406
142
998
157
590
17
12
70
Cash
Paid
out
Purc
hase
of
geod
es
965
0
220
02
343
54
467
06
590
58
714
10
837
62
961
14
108
466
120
818
133
170
14
47
50
Cost 42 42 42 42 42 42 42 42 42 42 42 42
FINANCE MANAGEMENT
and the revenues over the period that might typically record the fiscal amounts of the company
the income statements help to tell the investors about the company that helps in generating the
profit or the loss. The income statements provide valuable information.
Monthly Cash flow Statement
Statement of monthly cash flow statement
Jan Feb Mar Apr
Ma
y Jun Jul
Au
g Sep Oct Nov
De
c
Open
ing
Bala
nce
450
000
437
041
.2
413
347
.3
378
918
.3
333
754
.2
277
855
211
220
.6
133
851
.2
457
46.
69
-
530
92.
9
-
162
668
-
28
29
78
Cash
Rece
ipts
Sales
of
Geod
es
114
00
259
92
405
84
551
76
697
68
843
60
989
52
113
544
128
136
142
728
157
320
17
10
00
Sales
of
Cabi
net 270 270 270 270 270 270 270 270 270 270 270
27
0
Tota
l
Sale
s
116
70
262
62
408
54
554
46
700
38
846
30
992
22
113
814
128
406
142
998
157
590
17
12
70
Tota
l
Rece
ipts
116
70
262
62
408
54
554
46
700
38
846
30
992
22
113
814
128
406
142
998
157
590
17
12
70
Cash
Paid
out
Purc
hase
of
geod
es
965
0
220
02
343
54
467
06
590
58
714
10
837
62
961
14
108
466
120
818
133
170
14
47
50
Cost 42 42 42 42 42 42 42 42 42 42 42 42
⊘ This is a preview!⊘
Do you want full access?
Subscribe today to unlock all pages.
Trusted by 1+ million students worldwide
9
FINANCE MANAGEMENT
of
Cabi
net
Cost
of
Freig
ht
100
00
228
00
356
00
484
00
612
00
740
00
868
00
996
00
112
400
125
200
138
000
15
00
00
Rent 300 300 300 300 300 300 300 300 300 300 300
30
0
Credi
t
card
com
missi
on
136
.80
311
.90
487
.01
662
.11
837
.22
101
2.3
2
118
7.4
2
136
2.5
3
153
7.6
3
171
2.7
4
188
7.8
4
20
52.
00
Cost
to
labo
ur
150
0
150
0
150
0
150
0
150
0
150
0
150
0
150
0
150
0
150
0
150
0
15
00
Part-
time
assis
tant
char
ges 200 200 200 200 200 200 200 200 200 200 200
20
0
Inter
est
on
borro
wing
s
280
0
280
0
280
0
280
0
280
0
280
0
280
0
280
0
280
0
280
0
280
0
28
00
Tota
l
cash
paid
out
246
28.
8
499
55.
9
752
83.
01
100
610
.1
125
937
.2
151
264
.3
176
591
.4
201
918
.5
227
245
.6
252
572
.7
277
899
.8
30
16
44
Cash
posi
tion
closi
ng
bala
nce
437
041
.2
413
347
.3
378
918
.3
333
754
.2
277
855
211
220
.6
133
851
.2
457
46.
69
-
530
92.
9
-
162
668
-
282
978
-
41
33
52
Paraphrase This Document
Need a fresh take? Get an instant paraphrase of this document with our AI Paraphraser
10
FINANCE MANAGEMENT
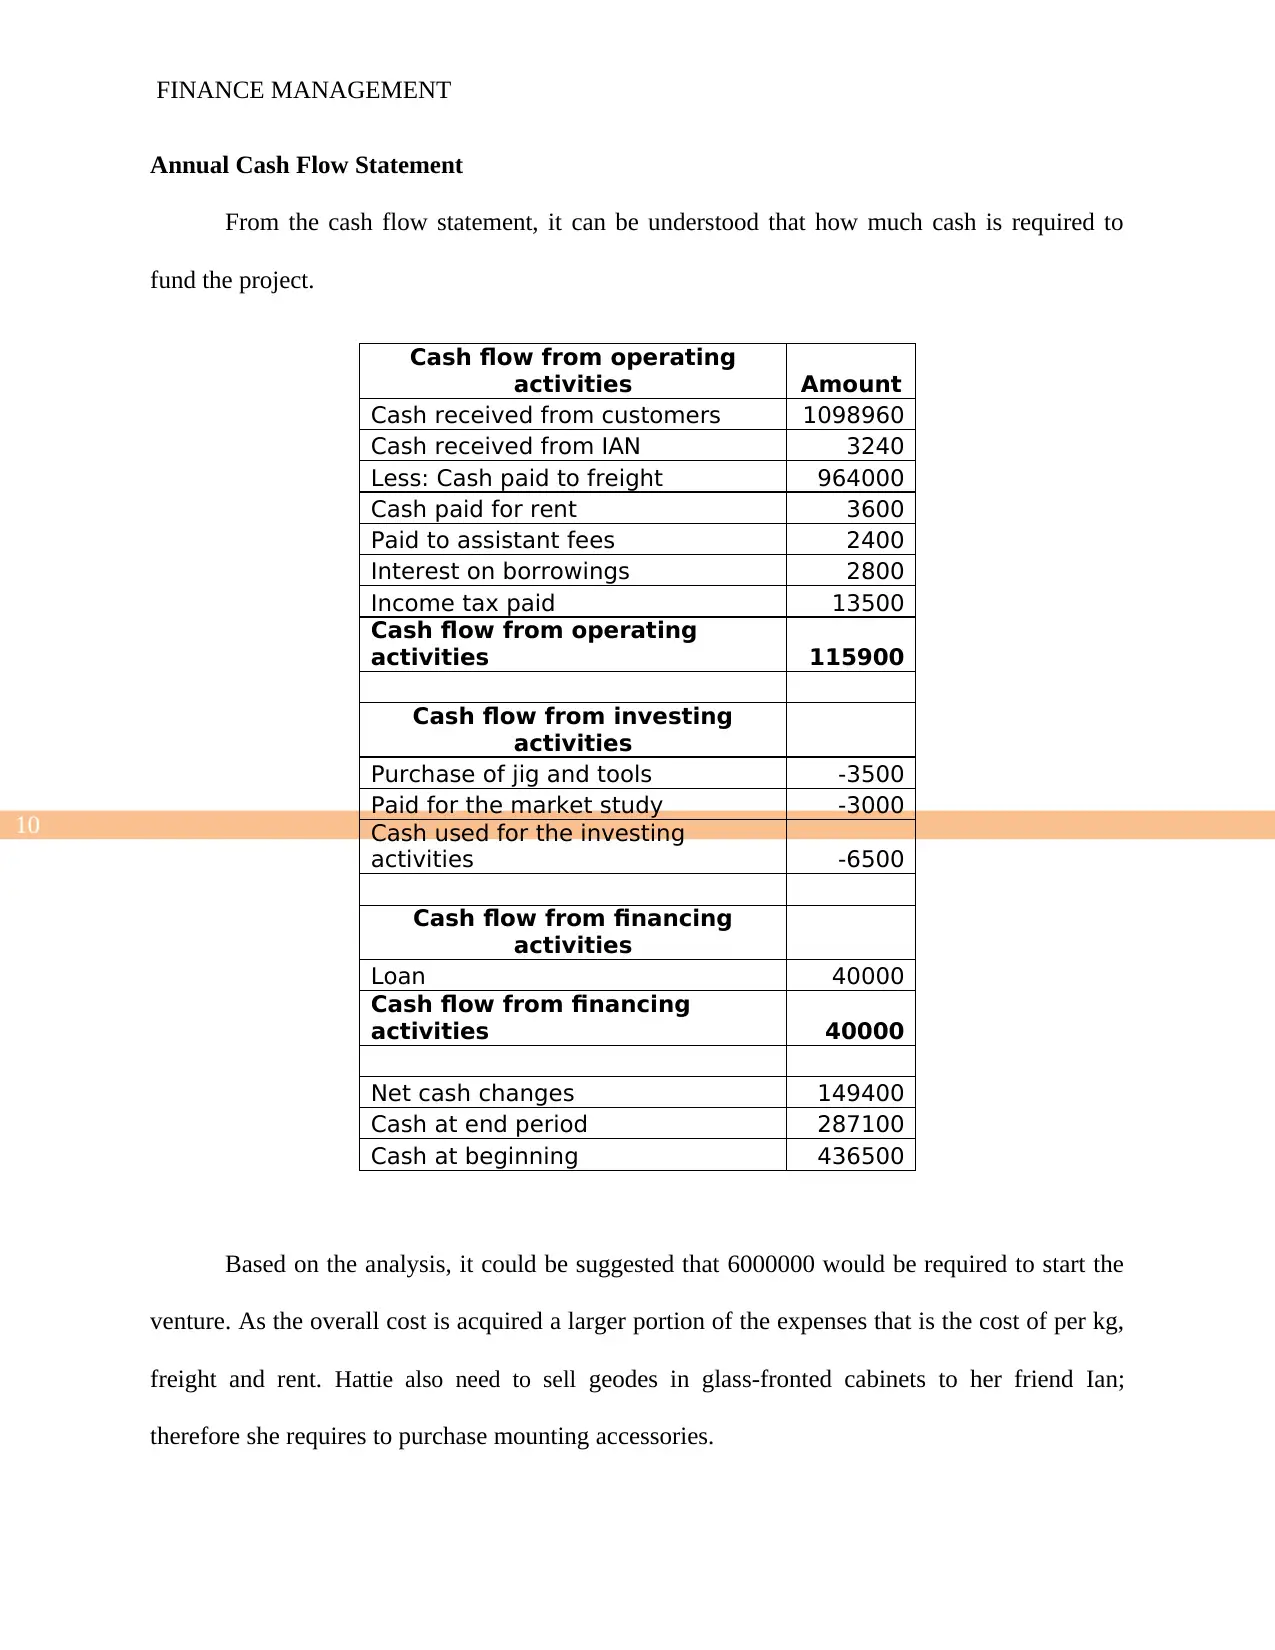
Annual Cash Flow Statement
From the cash flow statement, it can be understood that how much cash is required to
fund the project.
Cash flow from operating
activities Amount
Cash received from customers 1098960
Cash received from IAN 3240
Less: Cash paid to freight 964000
Cash paid for rent 3600
Paid to assistant fees 2400
Interest on borrowings 2800
Income tax paid 13500
Cash flow from operating
activities 115900
Cash flow from investing
activities
Purchase of jig and tools -3500
Paid for the market study -3000
Cash used for the investing
activities -6500
Cash flow from financing
activities
Loan 40000
Cash flow from financing
activities 40000
Net cash changes 149400
Cash at end period 287100
Cash at beginning 436500
Based on the analysis, it could be suggested that 6000000 would be required to start the
venture. As the overall cost is acquired a larger portion of the expenses that is the cost of per kg,
freight and rent. Hattie also need to sell geodes in glass-fronted cabinets to her friend Ian;
therefore she requires to purchase mounting accessories.
FINANCE MANAGEMENT
Annual Cash Flow Statement
From the cash flow statement, it can be understood that how much cash is required to
fund the project.
Cash flow from operating
activities Amount
Cash received from customers 1098960
Cash received from IAN 3240
Less: Cash paid to freight 964000
Cash paid for rent 3600
Paid to assistant fees 2400
Interest on borrowings 2800
Income tax paid 13500
Cash flow from operating
activities 115900
Cash flow from investing
activities
Purchase of jig and tools -3500
Paid for the market study -3000
Cash used for the investing
activities -6500
Cash flow from financing
activities
Loan 40000
Cash flow from financing
activities 40000
Net cash changes 149400
Cash at end period 287100
Cash at beginning 436500
Based on the analysis, it could be suggested that 6000000 would be required to start the
venture. As the overall cost is acquired a larger portion of the expenses that is the cost of per kg,
freight and rent. Hattie also need to sell geodes in glass-fronted cabinets to her friend Ian;
therefore she requires to purchase mounting accessories.
11
FINANCE MANAGEMENT
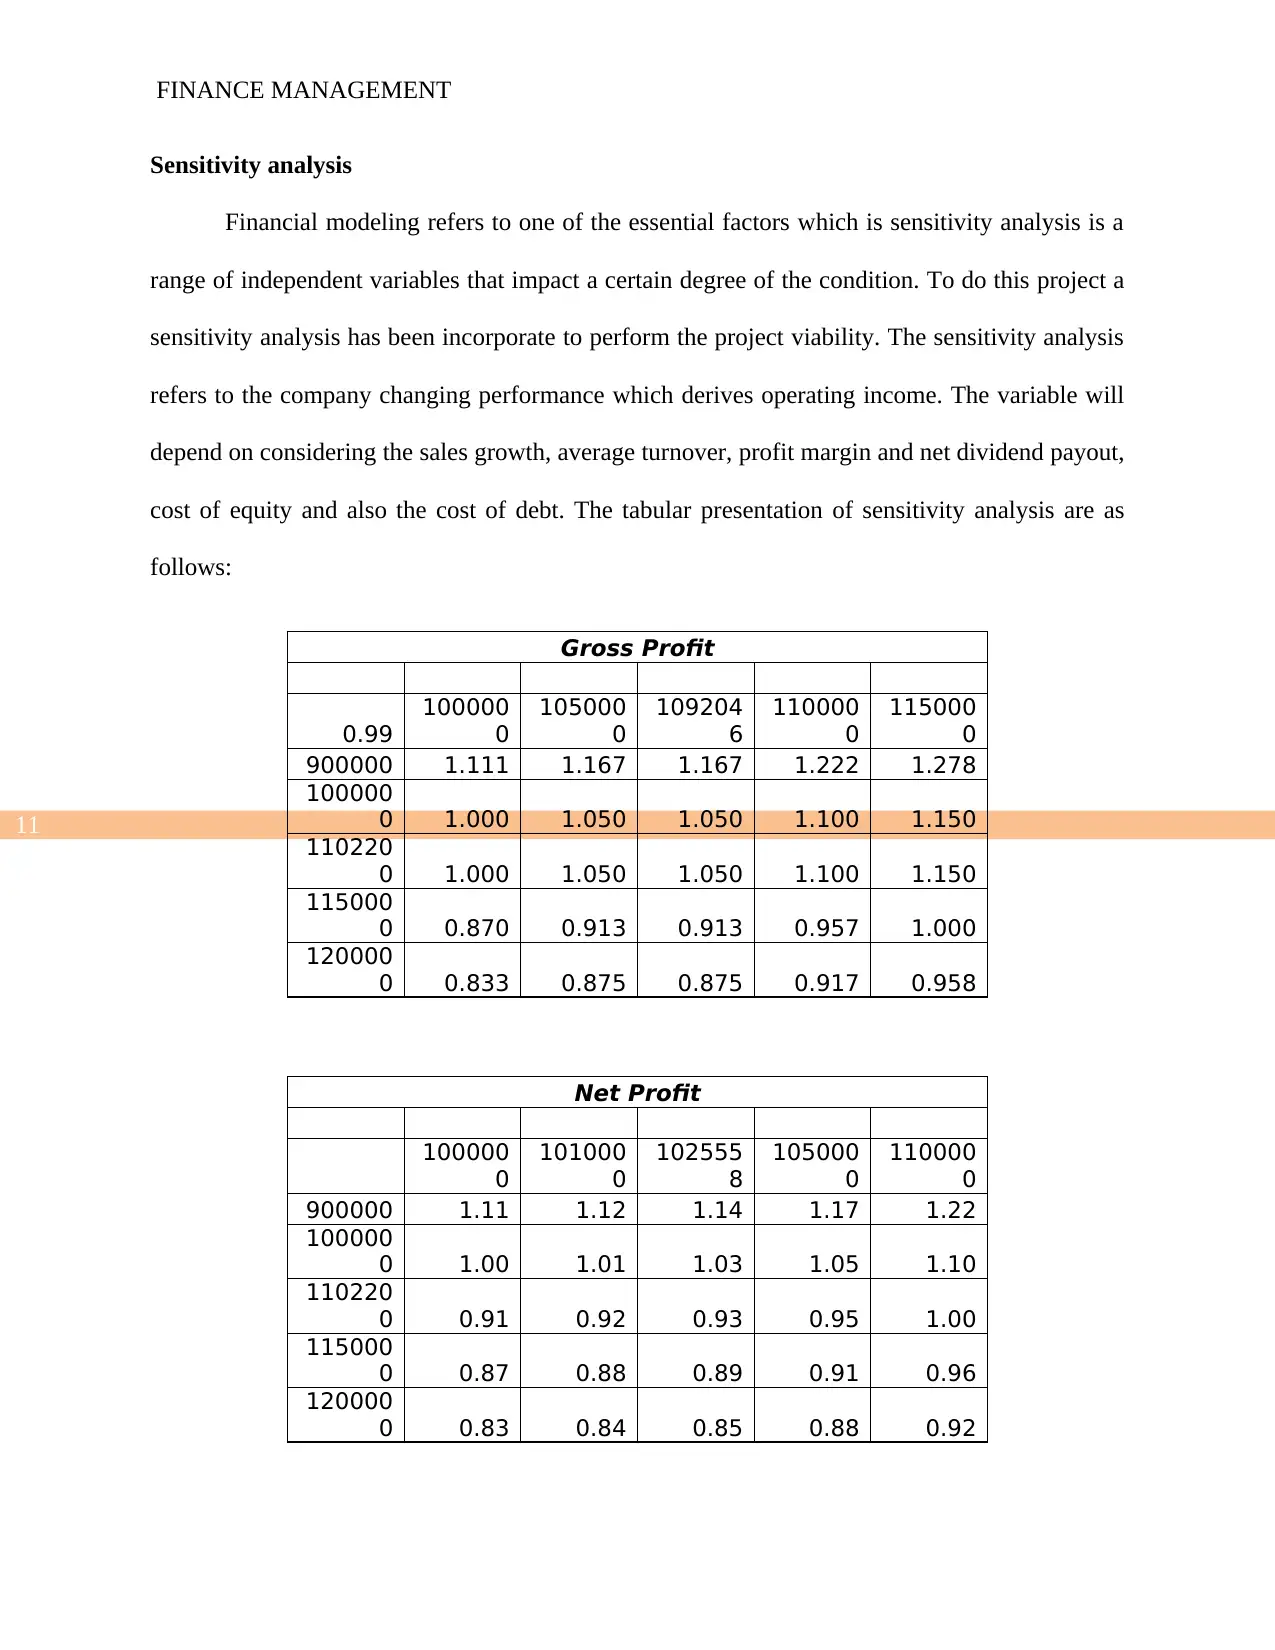
Sensitivity analysis
Financial modeling refers to one of the essential factors which is sensitivity analysis is a
range of independent variables that impact a certain degree of the condition. To do this project a
sensitivity analysis has been incorporate to perform the project viability. The sensitivity analysis
refers to the company changing performance which derives operating income. The variable will
depend on considering the sales growth, average turnover, profit margin and net dividend payout,
cost of equity and also the cost of debt. The tabular presentation of sensitivity analysis are as
follows:
Gross Profit
0.99
100000
0
105000
0
109204
6
110000
0
115000
0
900000 1.111 1.167 1.167 1.222 1.278
100000
0 1.000 1.050 1.050 1.100 1.150
110220
0 1.000 1.050 1.050 1.100 1.150
115000
0 0.870 0.913 0.913 0.957 1.000
120000
0 0.833 0.875 0.875 0.917 0.958
Net Profit
0.9
100000
0
101000
0
102555
8
105000
0
110000
0
900000 1.11 1.12 1.14 1.17 1.22
100000
0 1.00 1.01 1.03 1.05 1.10
110220
0 0.91 0.92 0.93 0.95 1.00
115000
0 0.87 0.88 0.89 0.91 0.96
120000
0 0.83 0.84 0.85 0.88 0.92
FINANCE MANAGEMENT
Sensitivity analysis
Financial modeling refers to one of the essential factors which is sensitivity analysis is a
range of independent variables that impact a certain degree of the condition. To do this project a
sensitivity analysis has been incorporate to perform the project viability. The sensitivity analysis
refers to the company changing performance which derives operating income. The variable will
depend on considering the sales growth, average turnover, profit margin and net dividend payout,
cost of equity and also the cost of debt. The tabular presentation of sensitivity analysis are as
follows:
Gross Profit
0.99
100000
0
105000
0
109204
6
110000
0
115000
0
900000 1.111 1.167 1.167 1.222 1.278
100000
0 1.000 1.050 1.050 1.100 1.150
110220
0 1.000 1.050 1.050 1.100 1.150
115000
0 0.870 0.913 0.913 0.957 1.000
120000
0 0.833 0.875 0.875 0.917 0.958
Net Profit
0.9
100000
0
101000
0
102555
8
105000
0
110000
0
900000 1.11 1.12 1.14 1.17 1.22
100000
0 1.00 1.01 1.03 1.05 1.10
110220
0 0.91 0.92 0.93 0.95 1.00
115000
0 0.87 0.88 0.89 0.91 0.96
120000
0 0.83 0.84 0.85 0.88 0.92
⊘ This is a preview!⊘
Do you want full access?
Subscribe today to unlock all pages.
Trusted by 1+ million students worldwide
1 out of 23
Related Documents


Your All-in-One AI-Powered Toolkit for Academic Success.
+13062052269
info@desklib.com
Available 24*7 on WhatsApp / Email
![[object Object]](/_next/static/media/star-bottom.7253800d.svg)
Unlock your academic potential
Copyright © 2020–2026 A2Z Services. All Rights Reserved. Developed and managed by ZUCOL.