Real World Analytics Project: Analyzing GSK Share Prices with GBM

Verified

Added on  2023/05/31

|7
|1036
|218
Project
AI Summary
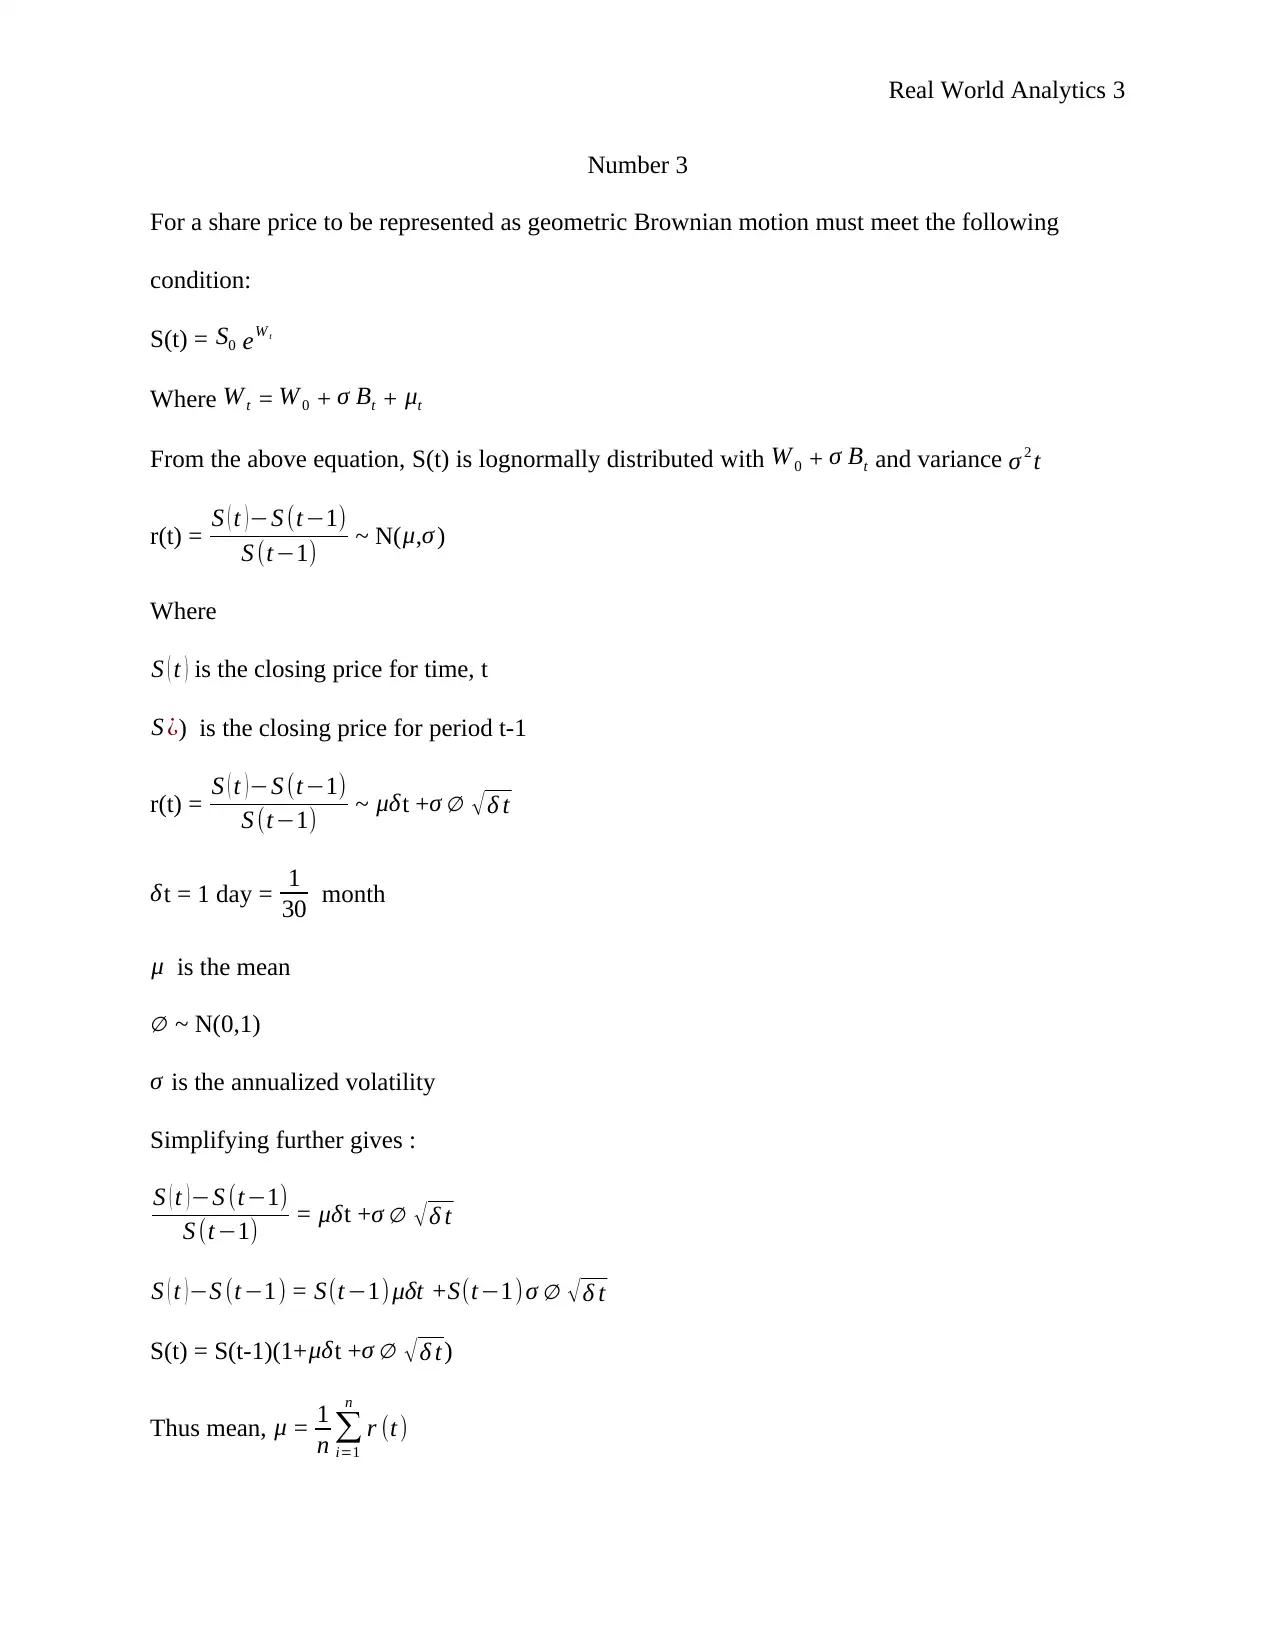
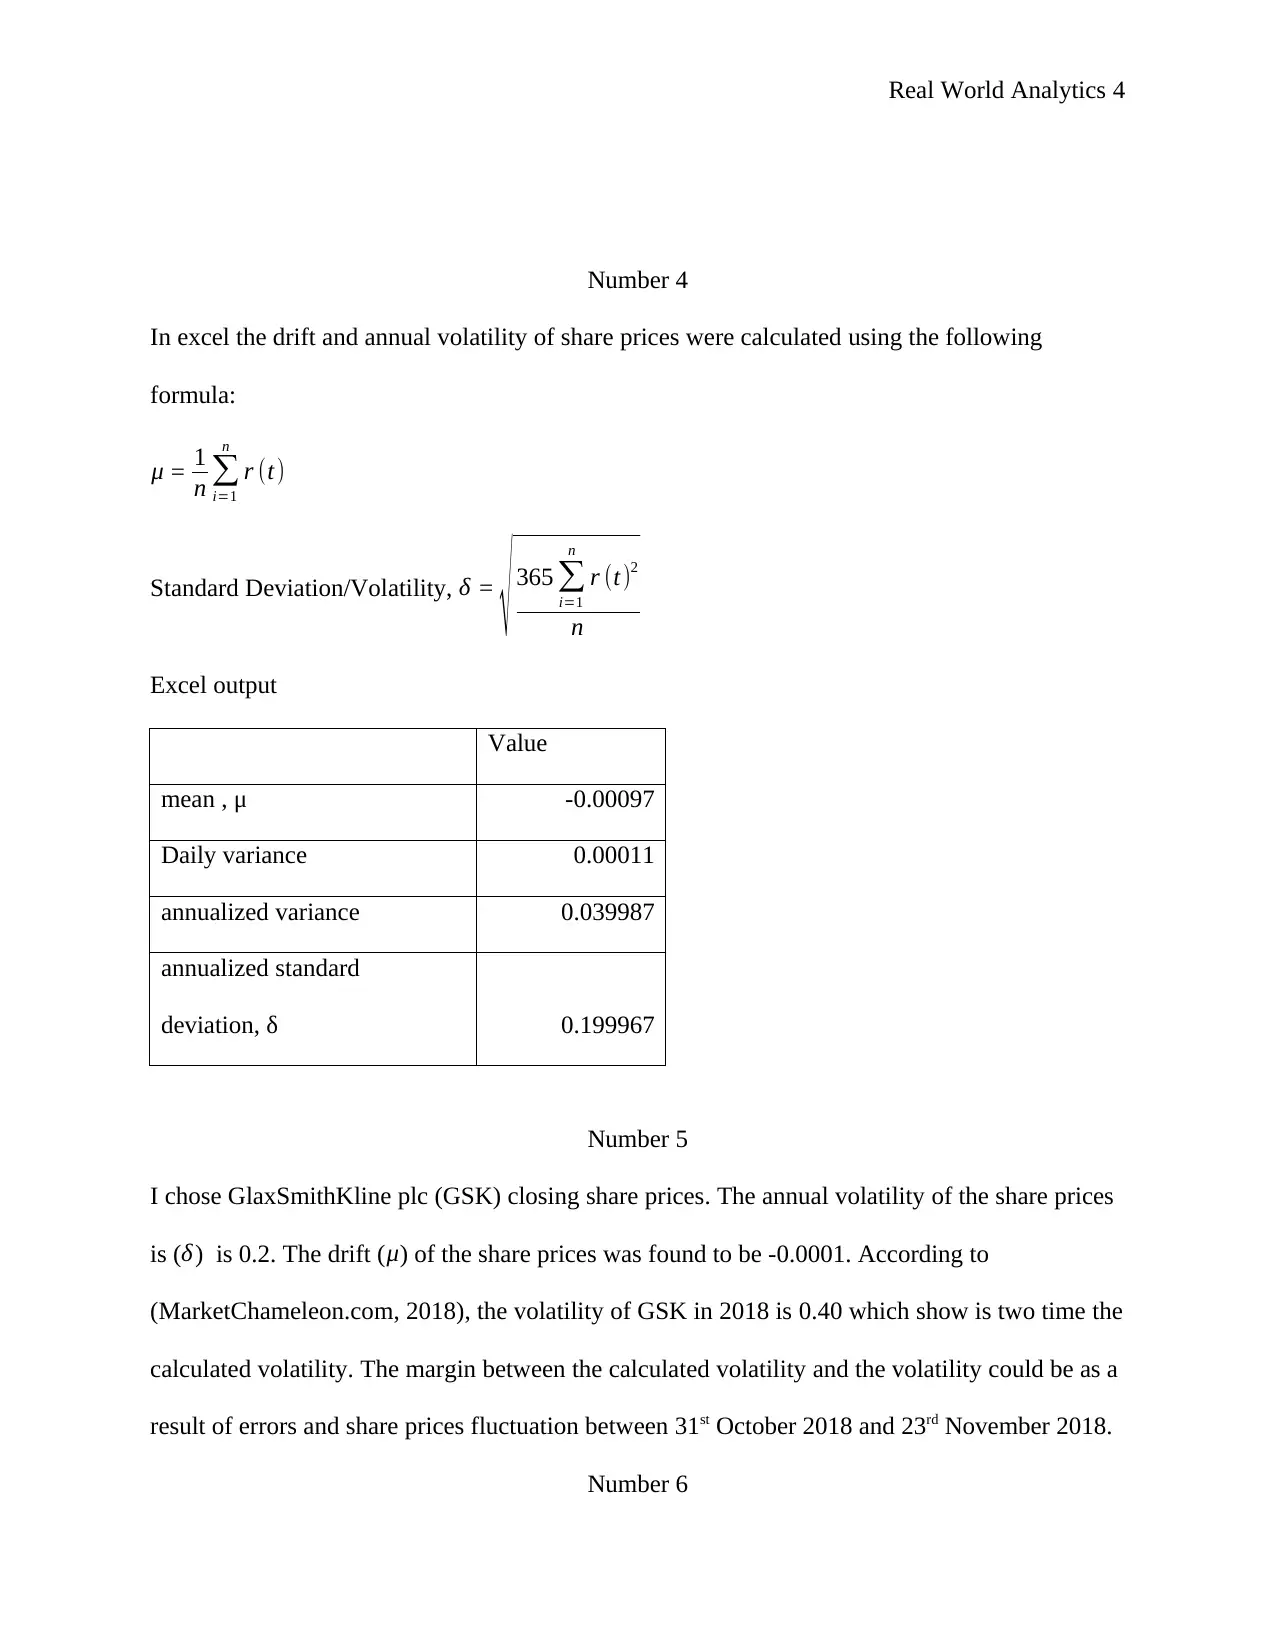
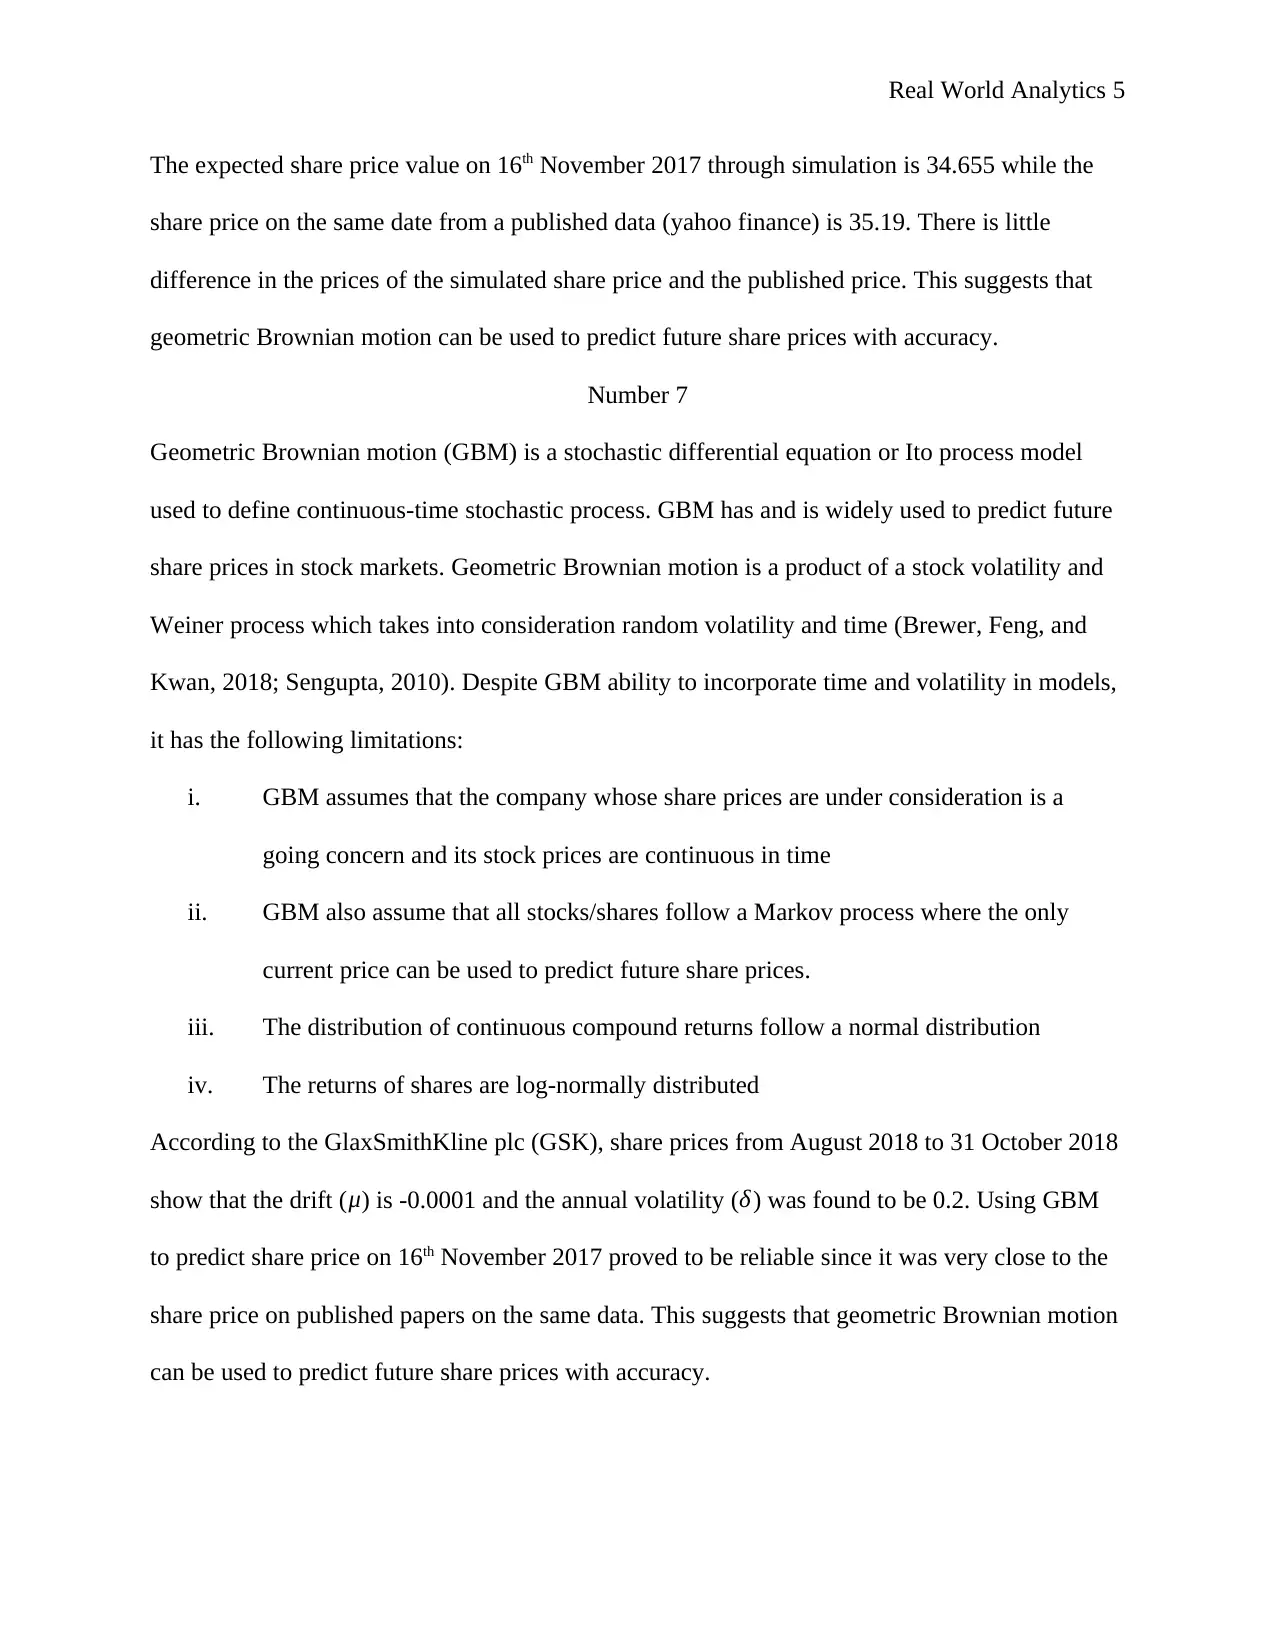
This project analyzes the share price of GlaxoSmithKline (GSK) using real-world analytics and the Geometric Brownian Motion (GBM) model. The student begins by outlining the assumptions of GBM and then presents a time series plot of GSK's closing share prices. The core of the project involves applying the GBM formula to model and predict share price movements. The student calculates the drift and annual volatility of the share prices, compares them to external data, and discusses potential discrepancies. The analysis includes a simulation to predict a specific share price, comparing the result to published data, and assessing the accuracy of the GBM model. The project concludes with a discussion of the limitations of GBM, such as the assumption of continuous stock prices and normal distribution of returns. The student used data from August 2018 to October 2018 and found a drift of -0.0001 and an annual volatility of 0.2. The project demonstrates the practical application of GBM in financial modeling and highlights the importance of understanding its limitations.
Document Page
Real World Analytics 1
REAL WORLD ANALYTICS
By Student’s Name
Course
Professor
University Name
City, State
Date
tabler-icon-diamond-filled.svg

Secure Best Marks with AI Grader

Need help grading? Try our AI Grader for instant feedback on your assignments.
Document Page
Real World Analytics 2
Number 1
σ t is the variance per unit time which gives more information on the order of random noise
μt is the expected return per unit time therefore it controls drift
σ t and μt are not constant. They vary with time.
Assumptions
i) The stock price follows ds= μSdt +σ SdW
ii) It is assumed that there are no dividends
iii) No short selling and that trading is continuous
iv) It is assumed that no taxes or costs of transaction paid
v) All securities are infinitely divisible
vi) No risk associated risks for lending or borrowing unlimited times.
Number 2
(Attached in excel file)
7/19/2018 8/8/2018 8/28/2018 9/17/2018 10/7/2018 10/27/2018 11/16/2018
36
37
38
39
40
41
42
A time series plot for Closing price,S(t) for GSK share price
Date
share price
Document Page
Real World Analytics 3
Number 3
For a share price to be represented as geometric Brownian motion must meet the following
condition:
S(t) = S0 eW t
Where W t = W0 + σ Bt + μt
From the above equation, S(t) is lognormally distributed with W 0 + σ Bt and variance σ 2 t
r(t) = S ( t )S (t1)
S (t1) ~ N( μ,σ )
Where
S ( t ) is the closing price for time, t
S ¿) is the closing price for period t-1
r(t) = S ( t )S (t1)
S (t1) ~ μδt +σ δ t
δt = 1 day = 1
30 month
μ is the mean
~ N(0,1)
σ is the annualized volatility
Simplifying further gives :
S ( t )S (t1)
S (t1) = μδt +σ δ t
S ( t ) S (t1) = S(t1) μδt +S(t1)σ δ t
S(t) = S(t-1)(1+ μδt +σ δ t)
Thus mean, μ = 1
n
i=1
n
r (t)
Document Page
Real World Analytics 4
Number 4
In excel the drift and annual volatility of share prices were calculated using the following
formula:
μ = 1
n
i=1
n
r (t)
Standard Deviation/Volatility, δ =
365
i=1
n
r (t)2
n
Excel output
Value
mean , μ -0.00097
Daily variance 0.00011
annualized variance 0.039987
annualized standard
deviation, δ 0.199967
Number 5
I chose GlaxSmithKline plc (GSK) closing share prices. The annual volatility of the share prices
is (δ) is 0.2. The drift (μ) of the share prices was found to be -0.0001. According to
(MarketChameleon.com, 2018), the volatility of GSK in 2018 is 0.40 which show is two time the
calculated volatility. The margin between the calculated volatility and the volatility could be as a
result of errors and share prices fluctuation between 31st October 2018 and 23rd November 2018.
Number 6
tabler-icon-diamond-filled.svg

Secure Best Marks with AI Grader

Need help grading? Try our AI Grader for instant feedback on your assignments.
Document Page
Real World Analytics 5
The expected share price value on 16th November 2017 through simulation is 34.655 while the
share price on the same date from a published data (yahoo finance) is 35.19. There is little
difference in the prices of the simulated share price and the published price. This suggests that
geometric Brownian motion can be used to predict future share prices with accuracy.
Number 7
Geometric Brownian motion (GBM) is a stochastic differential equation or Ito process model
used to define continuous-time stochastic process. GBM has and is widely used to predict future
share prices in stock markets. Geometric Brownian motion is a product of a stock volatility and
Weiner process which takes into consideration random volatility and time (Brewer, Feng, and
Kwan, 2018; Sengupta, 2010). Despite GBM ability to incorporate time and volatility in models,
it has the following limitations:
i. GBM assumes that the company whose share prices are under consideration is a
going concern and its stock prices are continuous in time
ii. GBM also assume that all stocks/shares follow a Markov process where the only
current price can be used to predict future share prices.
iii. The distribution of continuous compound returns follow a normal distribution
iv. The returns of shares are log-normally distributed
According to the GlaxSmithKline plc (GSK), share prices from August 2018 to 31 October 2018
show that the drift ( μ) is -0.0001 and the annual volatility (δ) was found to be 0.2. Using GBM
to predict share price on 16th November 2017 proved to be reliable since it was very close to the
share price on published papers on the same data. This suggests that geometric Brownian motion
can be used to predict future share prices with accuracy.
Document Page
Real World Analytics 6
Reference
Brewer, K., Feng, Y. and Kwan, C. (2018). Geometric Brownian motion, option pricing, and
simulation: some spreadsheet-based exercises in financial modeling. [online]
Epublications.bond.edu.au. Available at: http://epublications.bond.edu.au/cgi/viewcontent.cgi?
article=1131&context=ejsie [Accessed 24 Nov. 2018].
MarketChameleon.com. (2018). Glaxosmithkline PLC (GSK) Stock Quote | Price Chart | Volume
Chart. [online] Available at: https://marketchameleon.com/Overview/GSK/ [Accessed 24 Nov.
2018].
Sengupta, C. (2010). Financial analysis and modeling using Excel and VBA. Hoboken, N.J.:
Wiley.
Document Page
Real World Analytics 7
Appendix
Share price on 16th November 2017
Source: Yahoo finance
chevron_up_icon
1 out of 7
circle_padding
hide_on_mobile
zoom_out_icon
[object Object]