SIT718: Real World Analytics Assessment Task 2 - Problem Solving

Verified

Added on  2023/01/13

|12
|1047
|35
Project
AI Summary
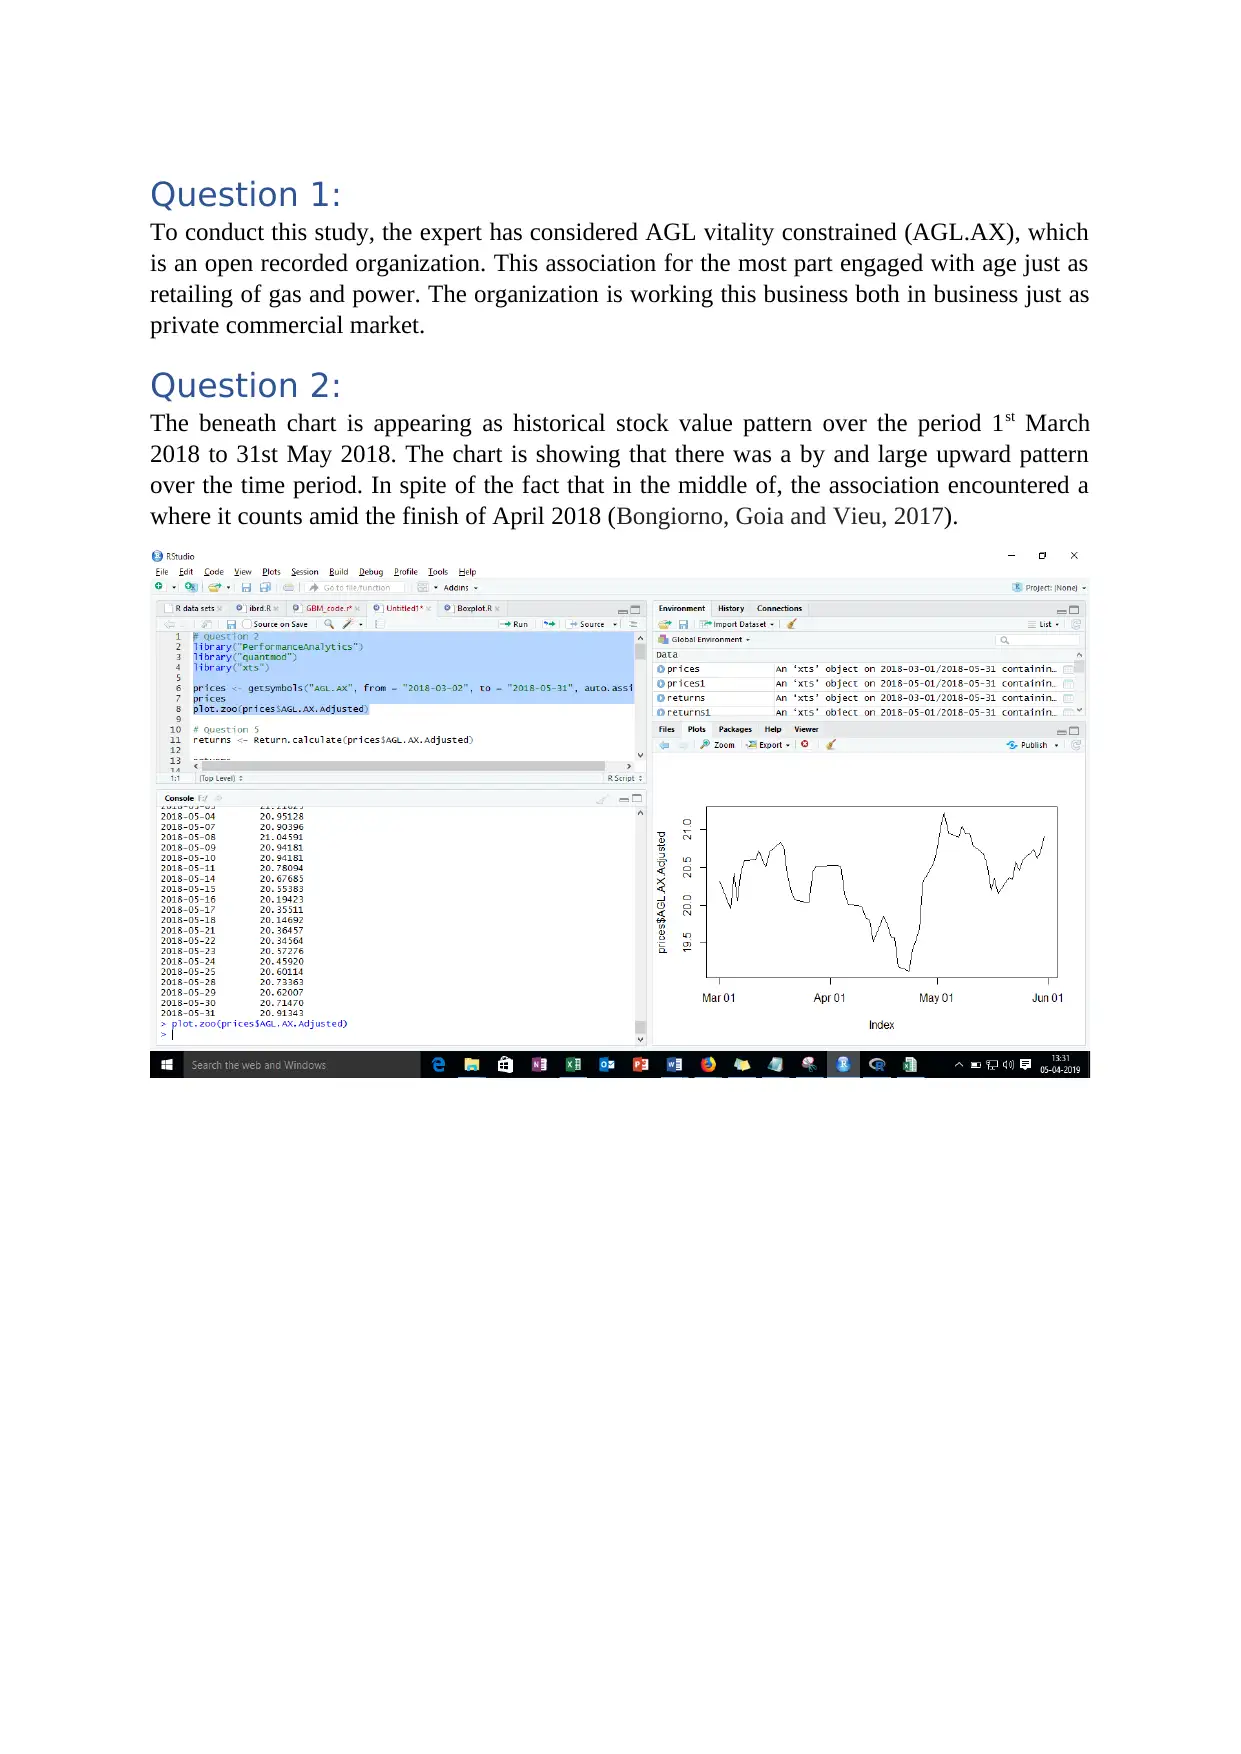
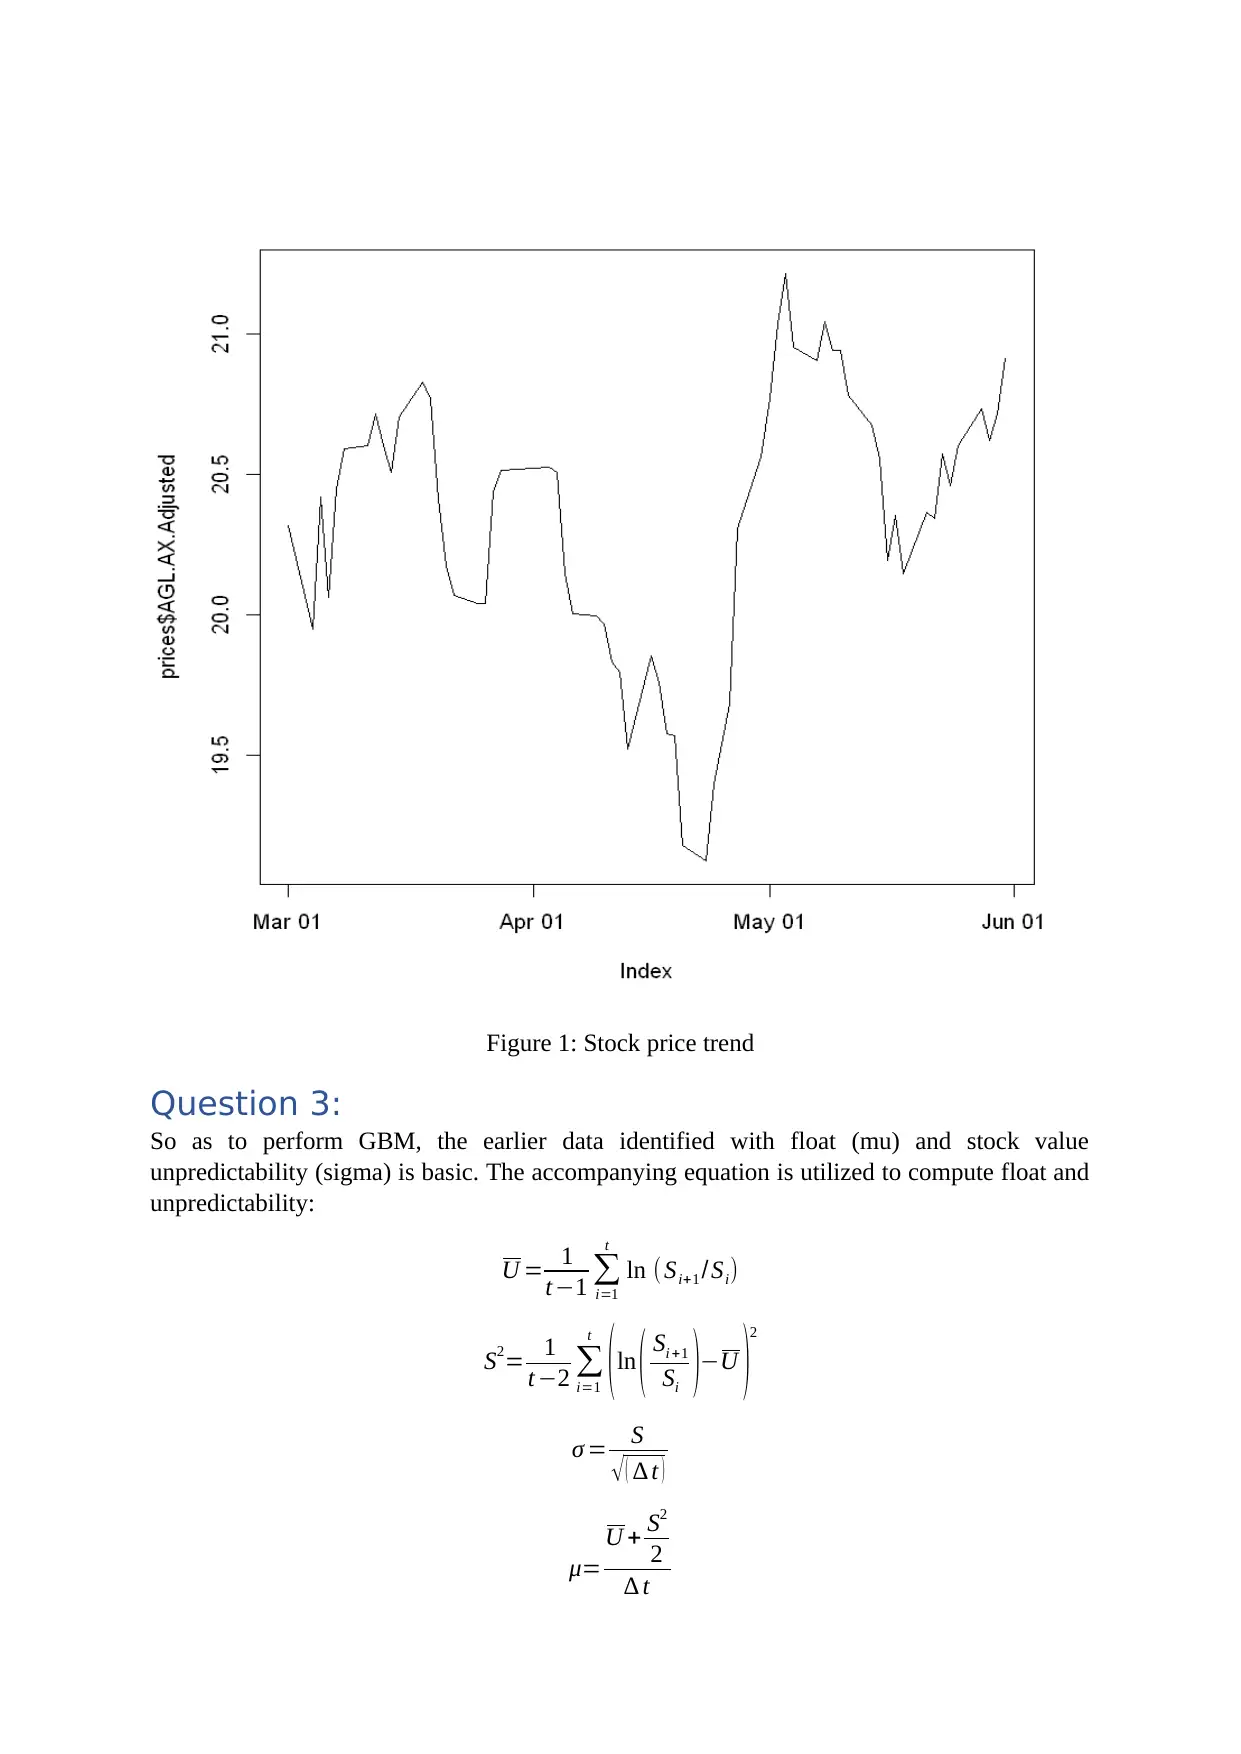
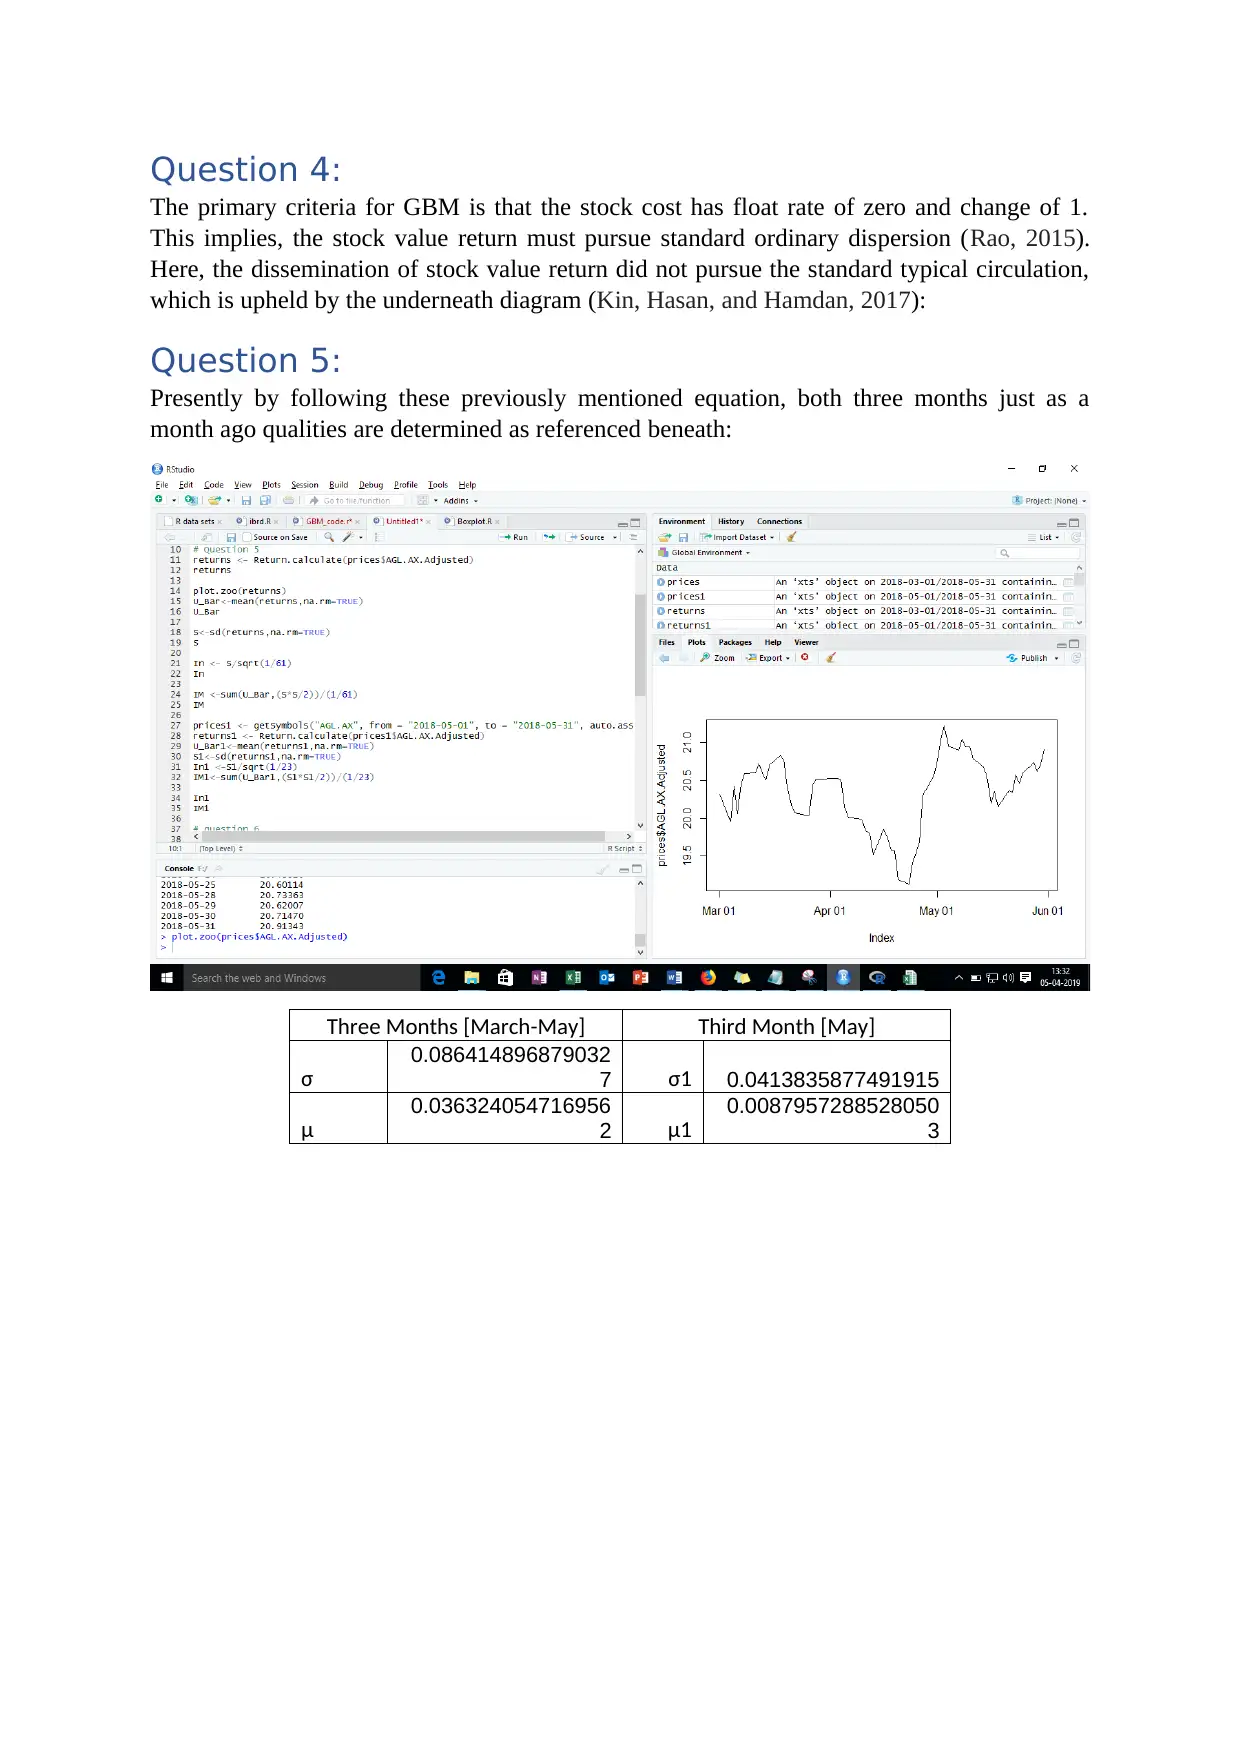
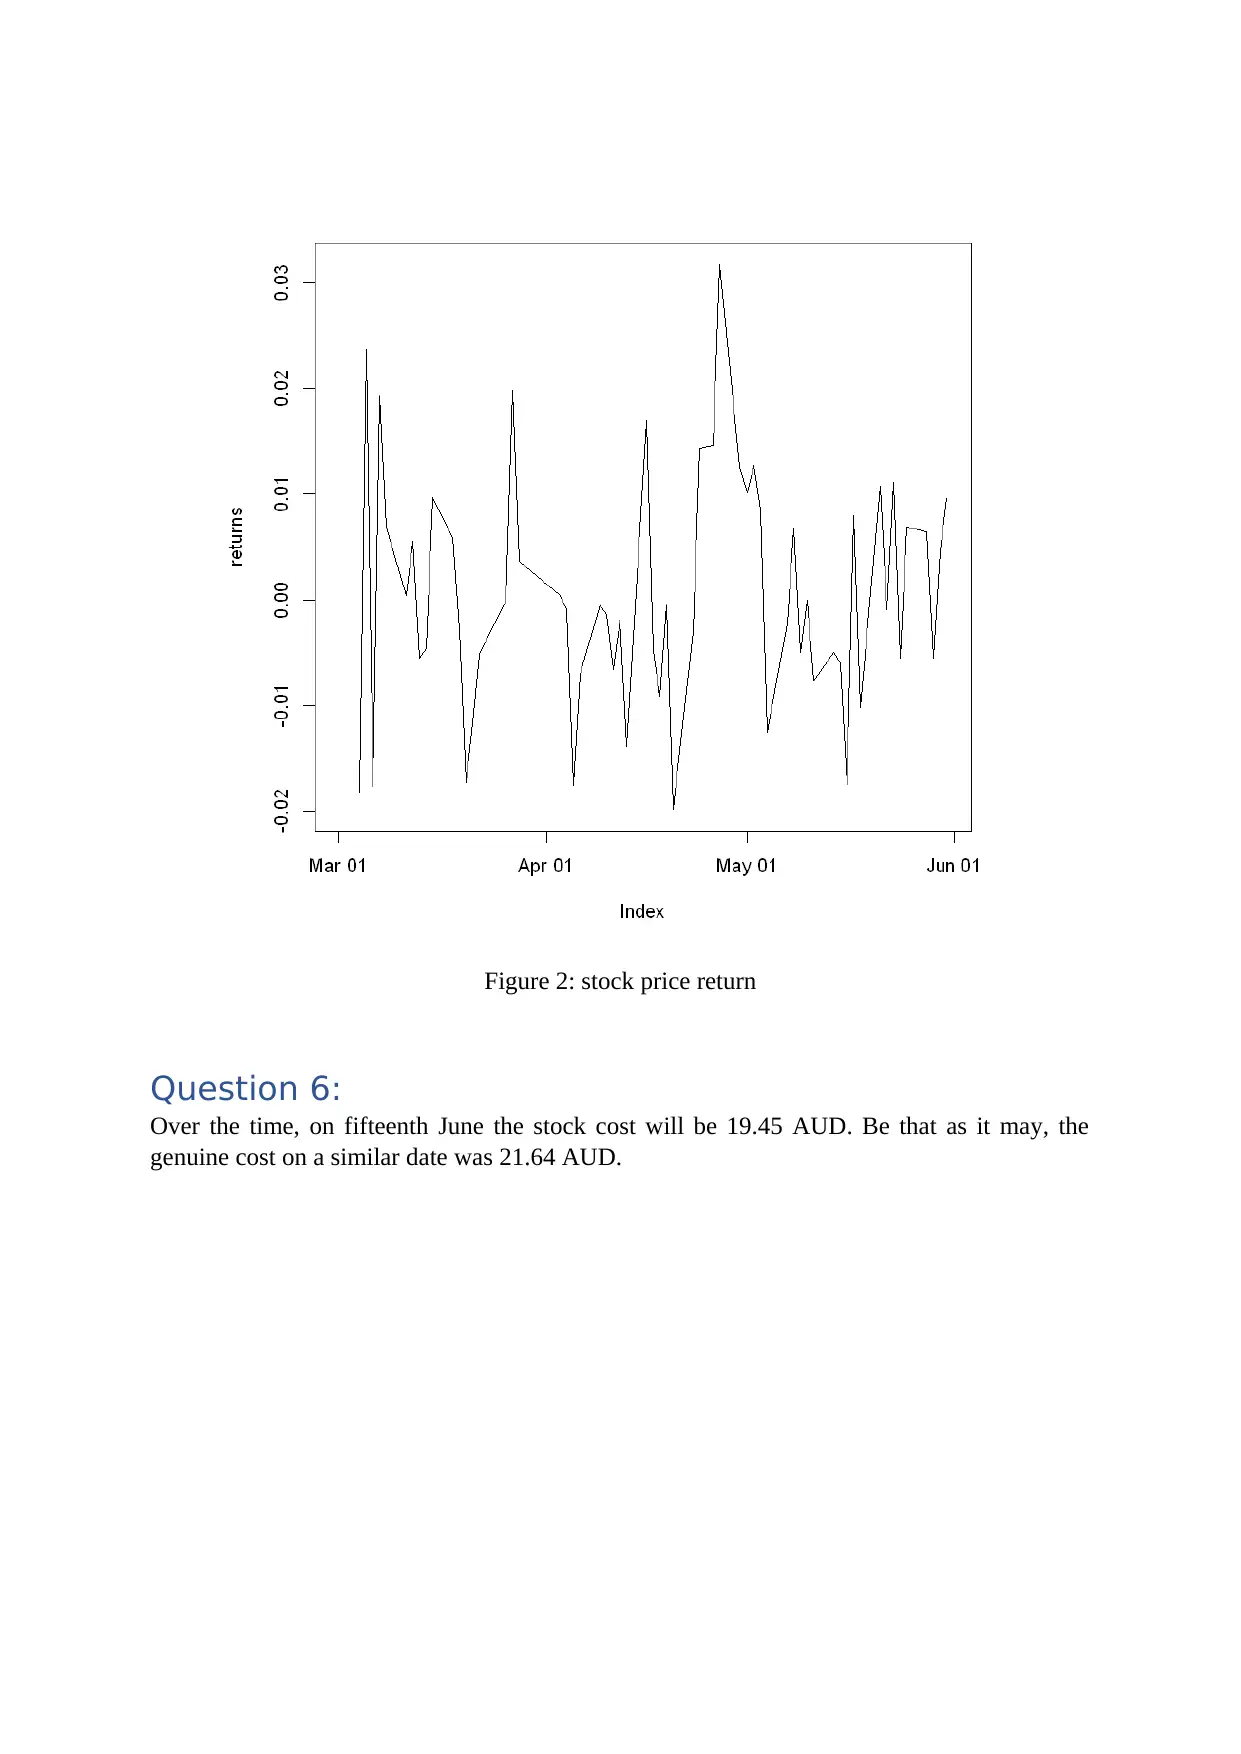
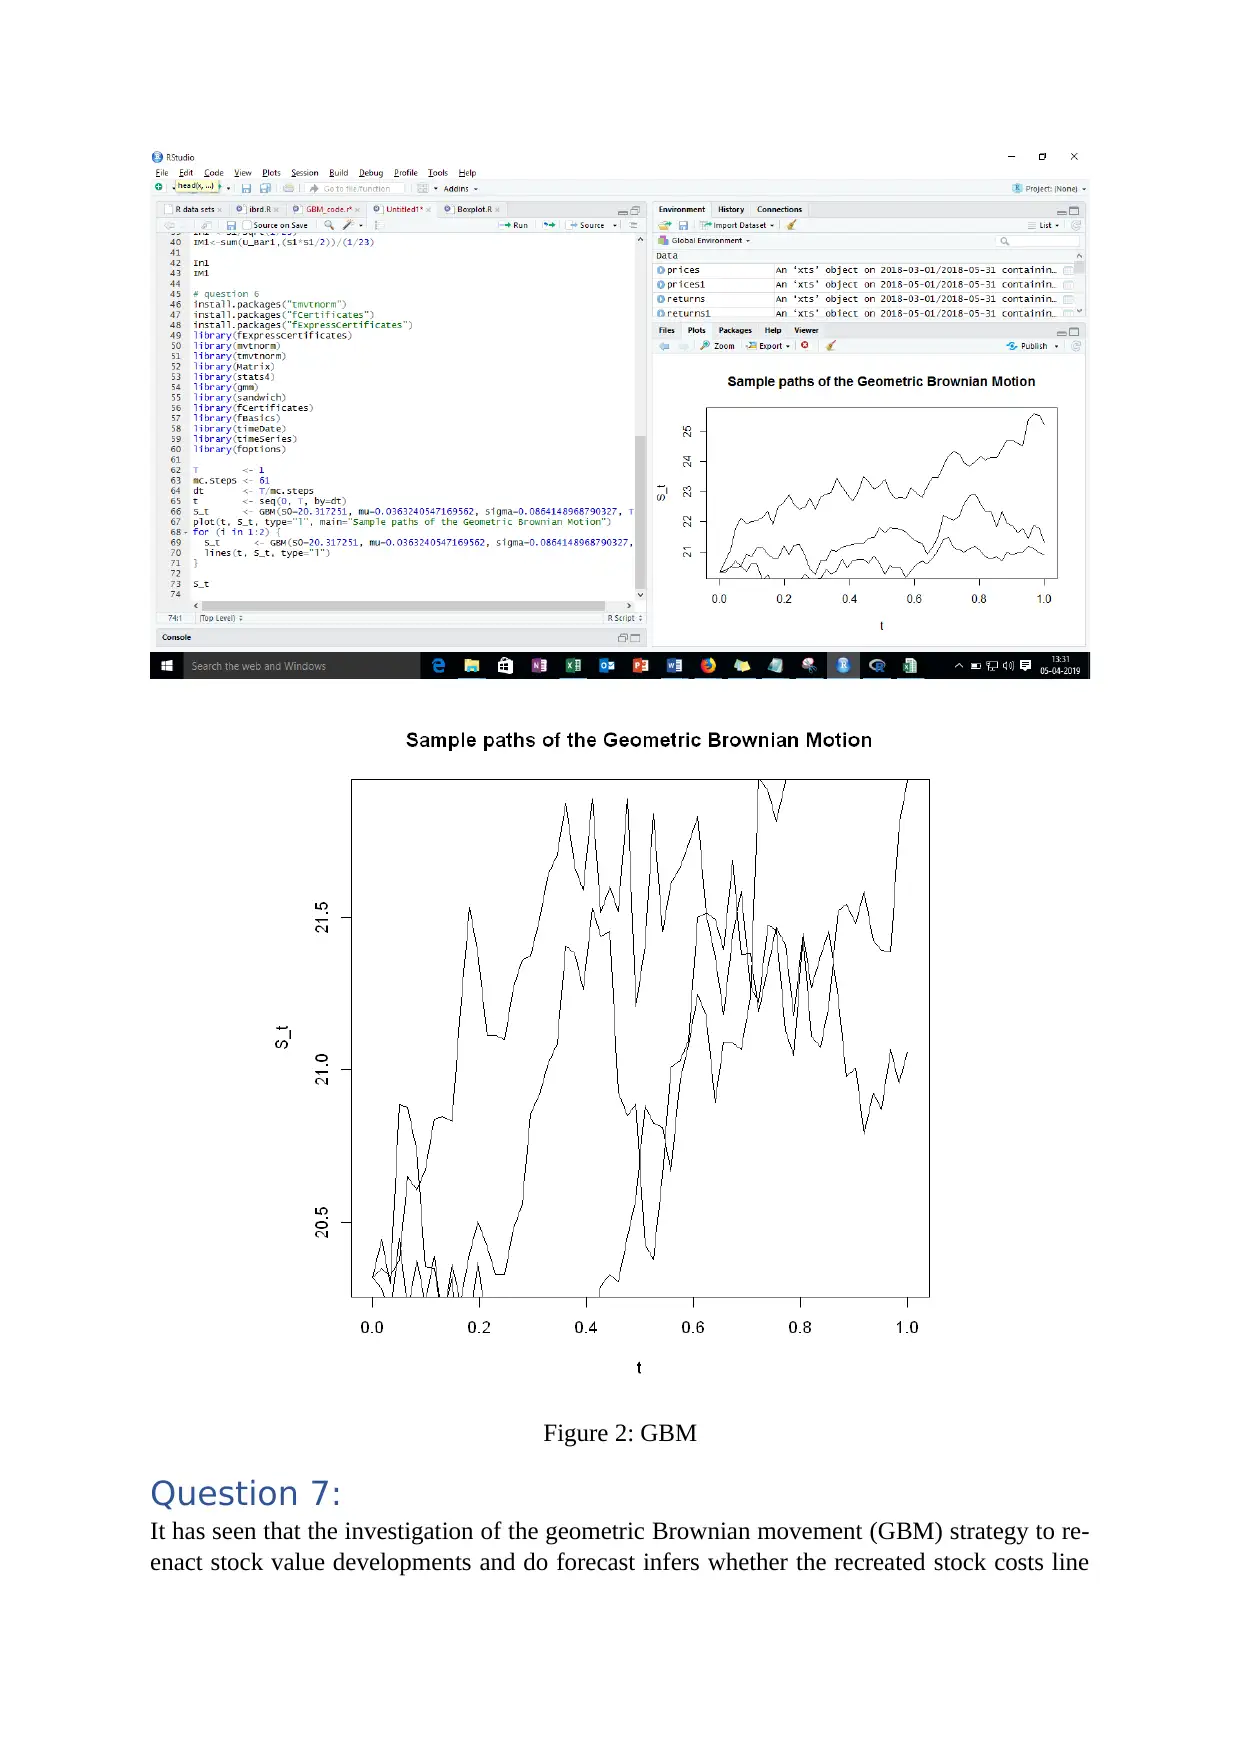
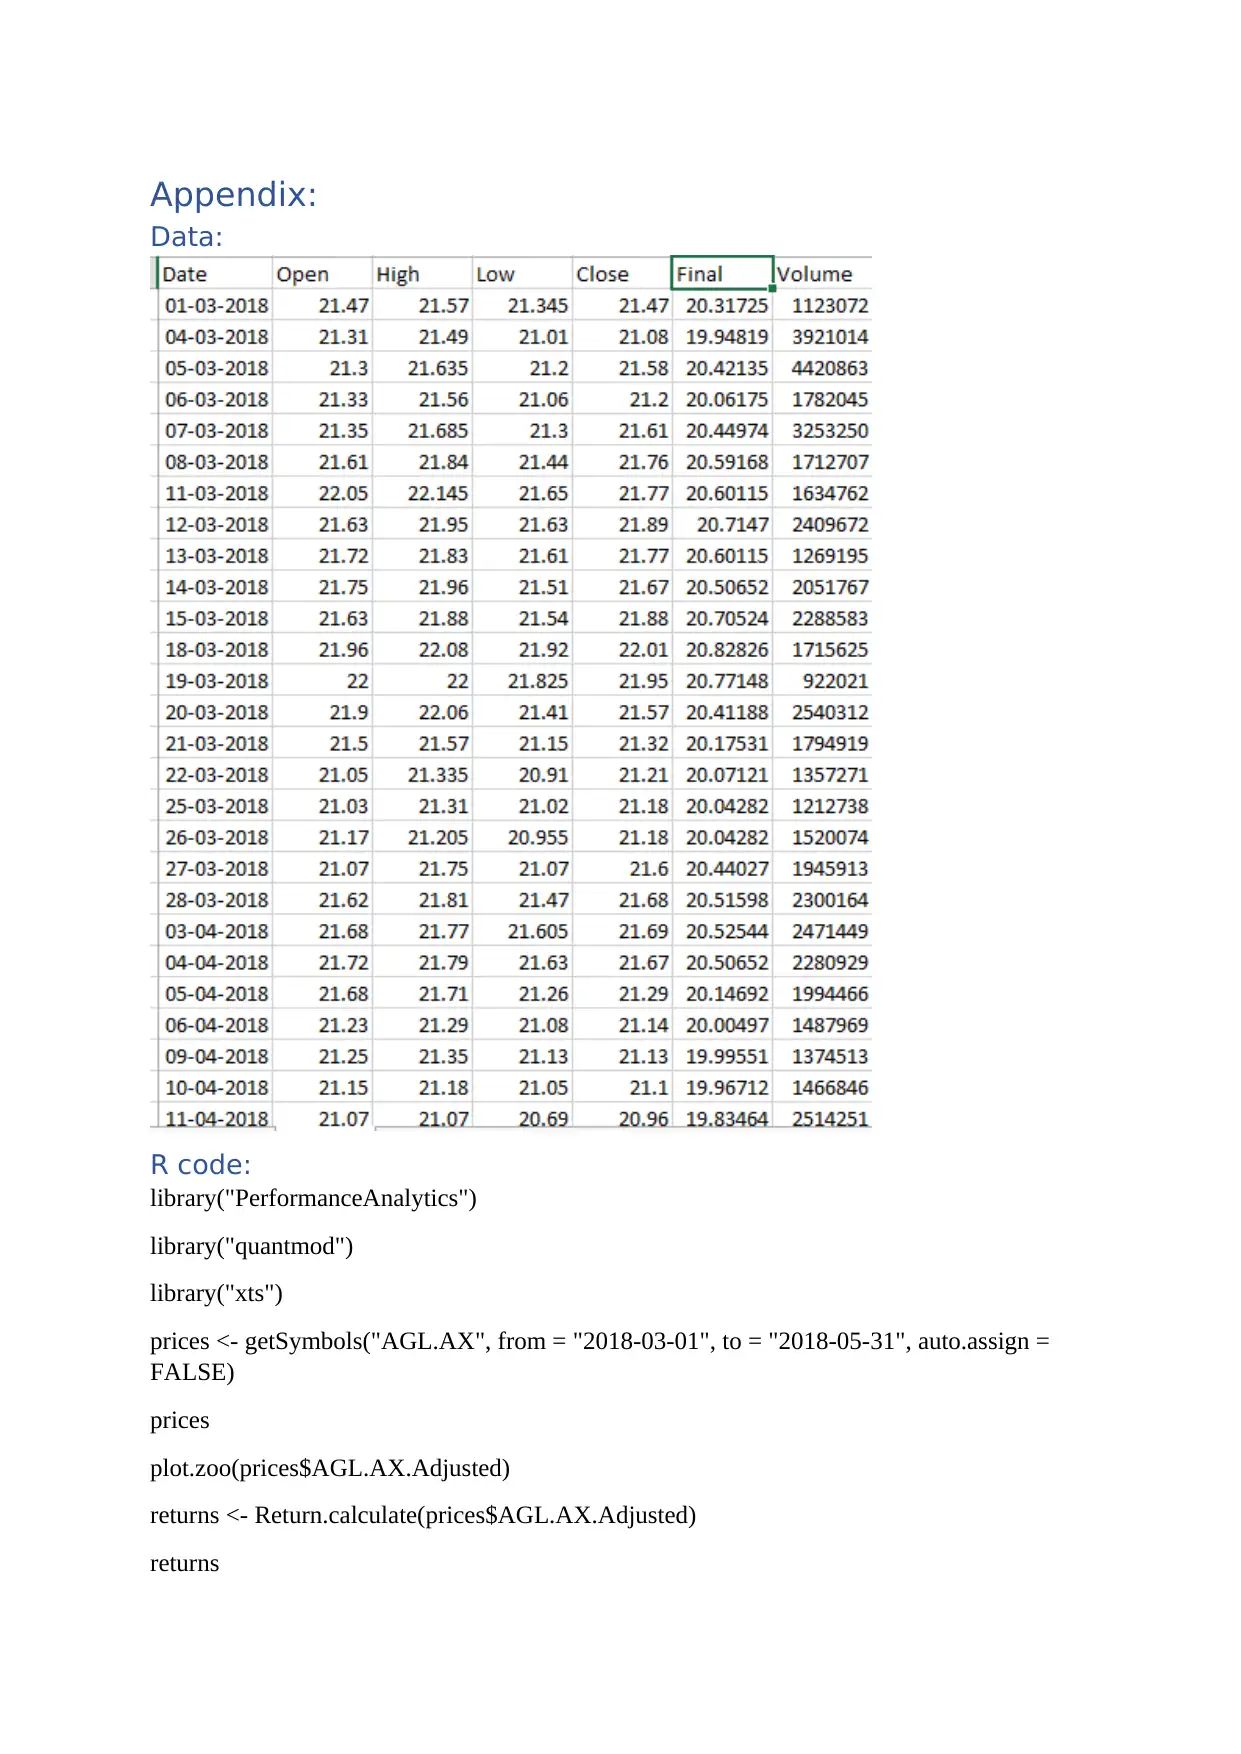
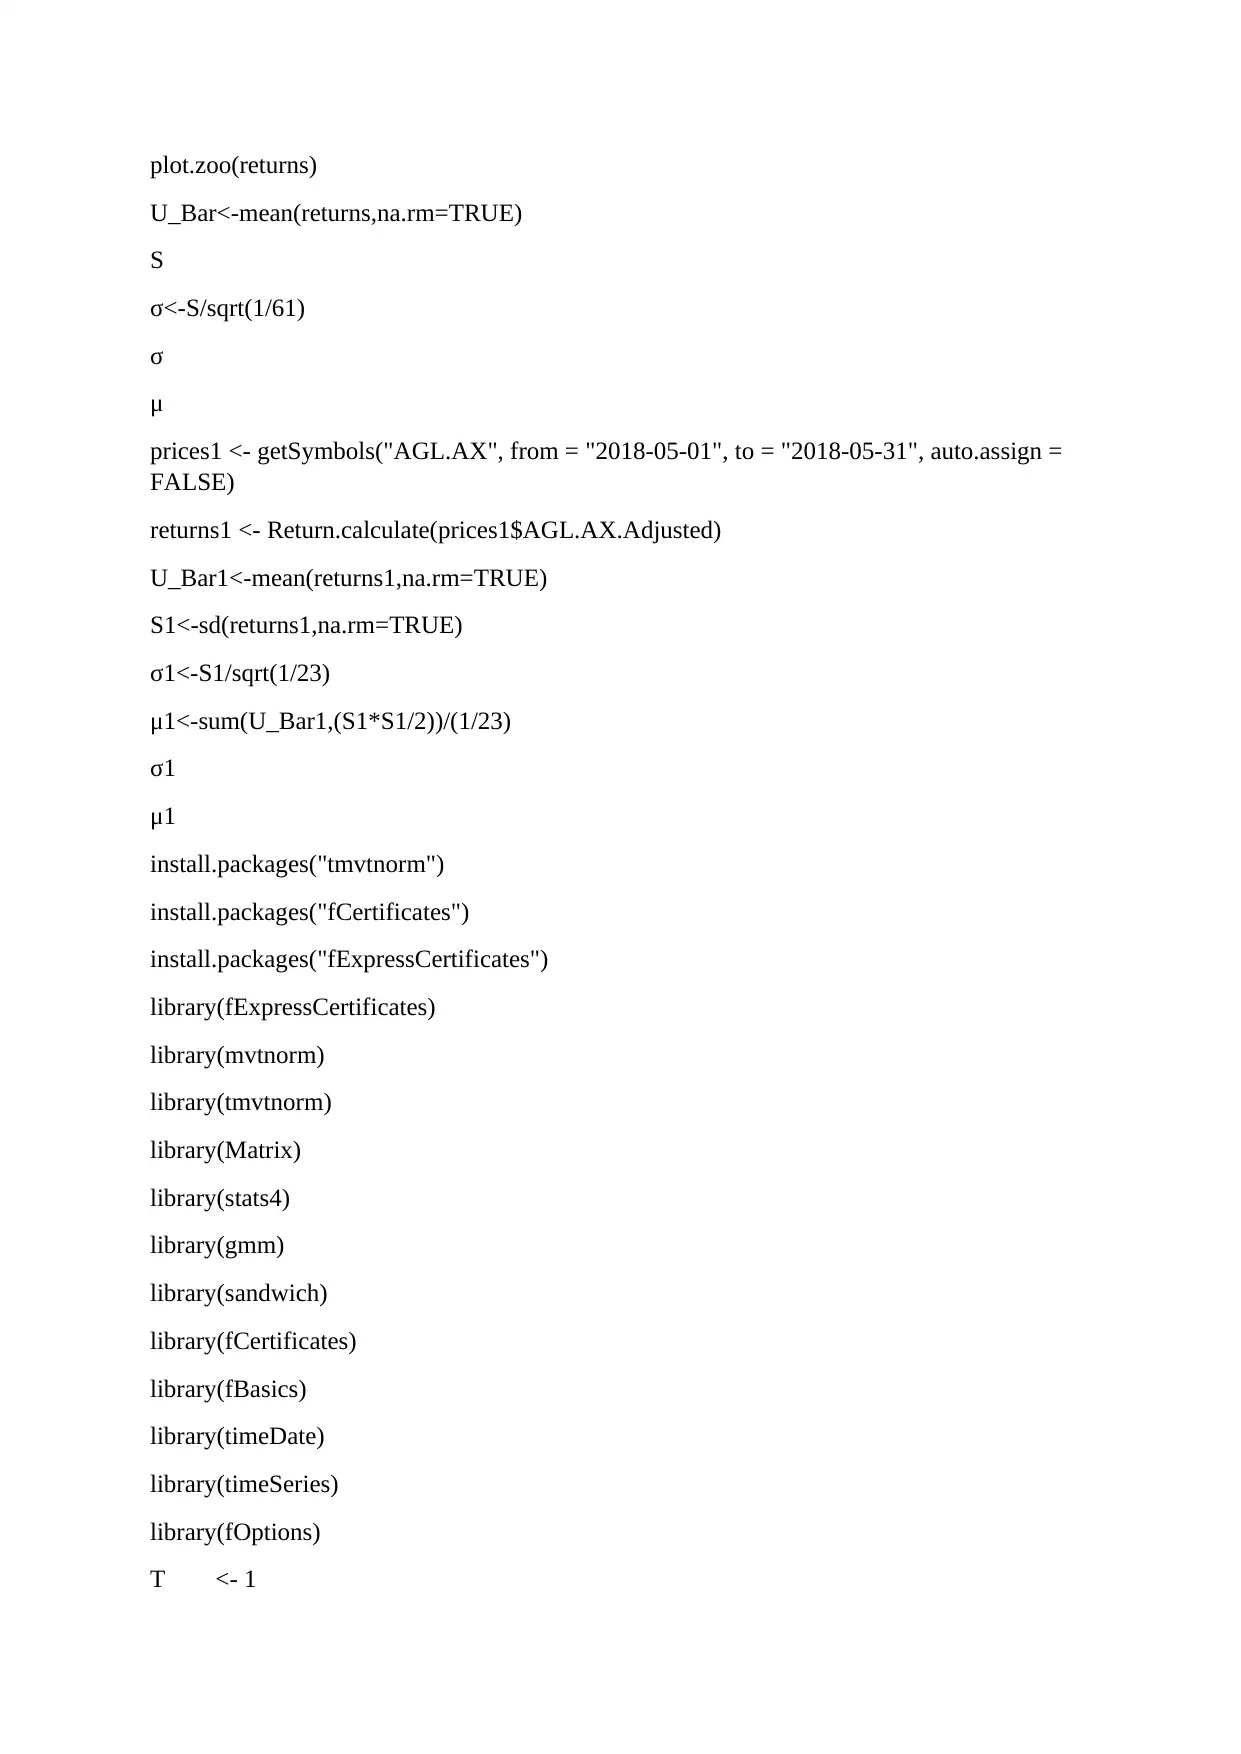
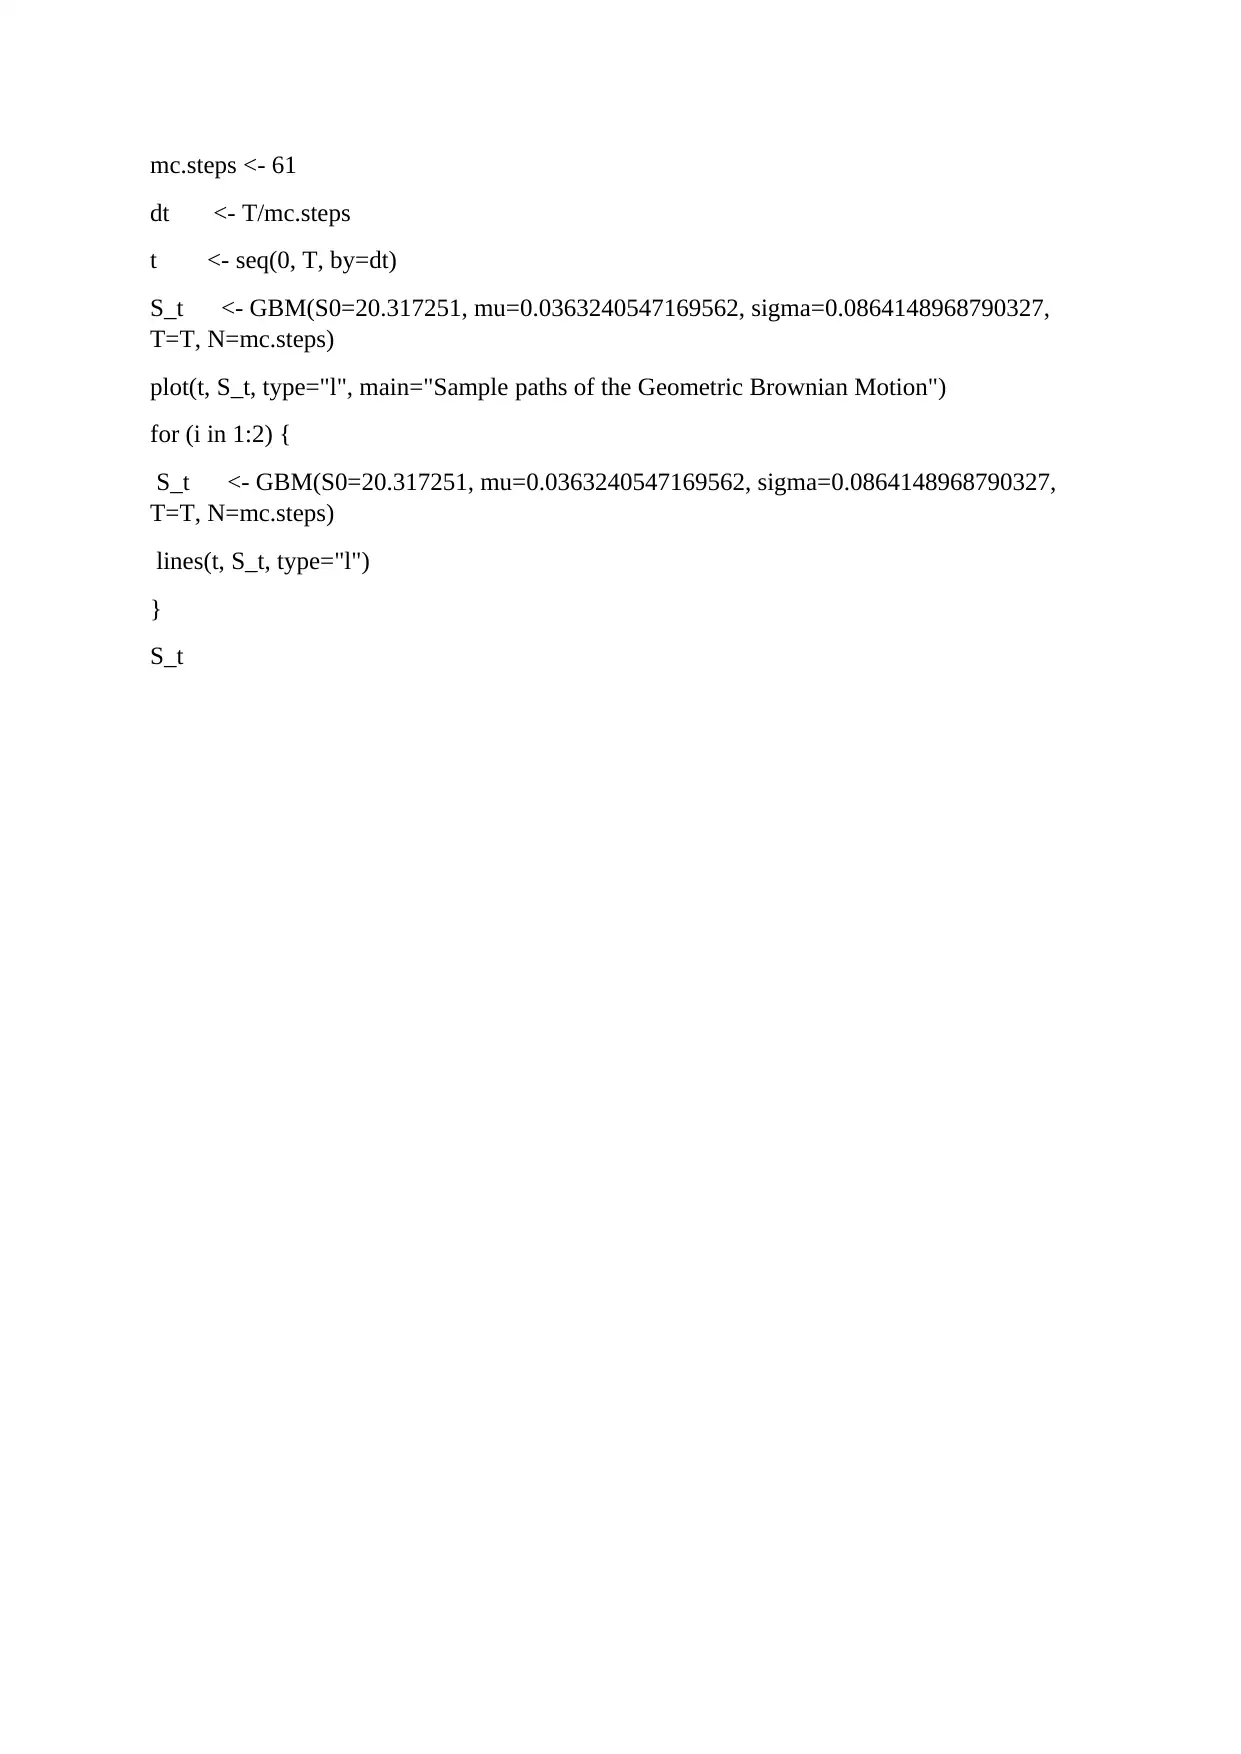
This assignment analyzes the behavior and performance of AGL.AX, an Australian publicly listed company, using historical stock data from March to May 2018. The analysis focuses on applying the Geometric Brownian Motion (GBM) model to simulate stock price movements and forecast future values. The student calculates drift and volatility, examines the distribution of stock returns, and compares predicted stock prices with actual values. The project includes R code for data manipulation, visualization, and GBM implementation. The student finds that the GBM model's parameters are not consistent over different time periods, and the predicted stock price on June 15th differs from the actual price. The assignment highlights the challenges and limitations of using GBM for stock price prediction. The solution also contains references and an appendix with data and R code.
Document Page
SIT718 Real World Analytics Assessment
Task 2: Problem Solving
Name of the Student
Name of the University
tabler-icon-diamond-filled.svg

Paraphrase This Document

Need a fresh take? Get an instant paraphrase of this document with our AI Paraphraser
Document Page
Table of Contents
Question 1:............................................................................................................................................3
Question 2:............................................................................................................................................3
Question 3:............................................................................................................................................3
Question 4:............................................................................................................................................4
Question 5:............................................................................................................................................5
Question 6:............................................................................................................................................5
Question 7:............................................................................................................................................5
Reference:.............................................................................................................................................6
Appendix:..............................................................................................................................................7
Data:..................................................................................................................................................7
R code:...............................................................................................................................................7
Document Page
Question 1:
To conduct this study, the expert has considered AGL vitality constrained (AGL.AX), which
is an open recorded organization. This association for the most part engaged with age just as
retailing of gas and power. The organization is working this business both in business just as
private commercial market.
Question 2:
The beneath chart is appearing as historical stock value pattern over the period 1st March
2018 to 31st May 2018. The chart is showing that there was a by and large upward pattern
over the time period. In spite of the fact that in the middle of, the association encountered a
where it counts amid the finish of April 2018 (Bongiorno, Goia and Vieu, 2017).
Document Page
Figure 1: Stock price trend
Question 3:
So as to perform GBM, the earlier data identified with float (mu) and stock value
unpredictability (sigma) is basic. The accompanying equation is utilized to compute float and
unpredictability:
U = 1
t1
i=1
t
ln ( Si+1 /Si)
S2= 1
t 2
i=1
t
( ln ( Si +1
Si )U )
2
σ = S
( t )
μ=
U + S2
2
t
tabler-icon-diamond-filled.svg

Paraphrase This Document

Need a fresh take? Get an instant paraphrase of this document with our AI Paraphraser
Document Page
Question 4:
The primary criteria for GBM is that the stock cost has float rate of zero and change of 1.
This implies, the stock value return must pursue standard ordinary dispersion (Rao, 2015).
Here, the dissemination of stock value return did not pursue the standard typical circulation,
which is upheld by the underneath diagram (Kin, Hasan, and Hamdan, 2017):
Question 5:
Presently by following these previously mentioned equation, both three months just as a
month ago qualities are determined as referenced beneath:
Three Months [March-May] Third Month [May]
σ
0.086414896879032
7 σ1 0.0413835877491915
μ
0.036324054716956
2 μ1
0.0087957288528050
3
Document Page
Figure 2: stock price return
Question 6:
Over the time, on fifteenth June the stock cost will be 19.45 AUD. Be that as it may, the
genuine cost on a similar date was 21.64 AUD.
Document Page
Figure 2: GBM
Question 7:
It has seen that the investigation of the geometric Brownian movement (GBM) strategy to re-
enact stock value developments and do forecast infers whether the recreated stock costs line
tabler-icon-diamond-filled.svg

Paraphrase This Document

Need a fresh take? Get an instant paraphrase of this document with our AI Paraphraser
Document Page
up with real stock returns (Ramos et al. 2019). There was a decrease of unpredictability of
stock just as float esteem when the time span diminished to one moth from three months.
Notwithstanding, it has seen that the parameter was not steady after some time.
Document Page
Reference:
Bongiorno, E.G., Goia, A. and Vieu, P., 2017. On the Geometric Brownian Motion
assumption for financial time series. In Functional Statistics and Related Fields (pp. 59-65).
Springer, Cham.
Kin, T.Y., Hasan, S.A. and Hamdan, N., 2017. Article 7 Forecasting the Financial Times
Stock Exchange Bursa Malaysia Kuala Lumpur Composite Index Using Geometric Brownian
Motion. Computing Research & Innovation (CRINN) Vol 2, October 2017, p.67.
Ramos, A.L., Mazzinghy, D.B., Barbosa, V.D.S.B., Oliveira, M.M. and Silva, G.R.D., 2019.
Evaluation of an iron ore price forecast using a geometric Brownian motion model. REM-
International Engineering Journal, 72(1), pp.9-15.
Rao, B.P., 2015. Option pricing for processes driven by mixed fractional Brownian motion
with superimposed jumps. Probability in the Engineering and Informational Sciences, 29(4),
pp.589-596.
Document Page
Appendix:
Data:
R code:
library("PerformanceAnalytics")
library("quantmod")
library("xts")
prices <- getSymbols("AGL.AX", from = "2018-03-01", to = "2018-05-31", auto.assign =
FALSE)
prices
plot.zoo(prices$AGL.AX.Adjusted)
returns <- Return.calculate(prices$AGL.AX.Adjusted)
returns
tabler-icon-diamond-filled.svg

Paraphrase This Document

Need a fresh take? Get an instant paraphrase of this document with our AI Paraphraser
Document Page
plot.zoo(returns)
U_Bar<-mean(returns,na.rm=TRUE)
S
σ<-S/sqrt(1/61)
σ
μ
prices1 <- getSymbols("AGL.AX", from = "2018-05-01", to = "2018-05-31", auto.assign =
FALSE)
returns1 <- Return.calculate(prices1$AGL.AX.Adjusted)
U_Bar1<-mean(returns1,na.rm=TRUE)
S1<-sd(returns1,na.rm=TRUE)
σ1<-S1/sqrt(1/23)
μ1<-sum(U_Bar1,(S1*S1/2))/(1/23)
σ1
μ1
install.packages("tmvtnorm")
install.packages("fCertificates")
install.packages("fExpressCertificates")
library(fExpressCertificates)
library(mvtnorm)
library(tmvtnorm)
library(Matrix)
library(stats4)
library(gmm)
library(sandwich)
library(fCertificates)
library(fBasics)
library(timeDate)
library(timeSeries)
library(fOptions)
T <- 1
Document Page
mc.steps <- 61
dt <- T/mc.steps
t <- seq(0, T, by=dt)
S_t <- GBM(S0=20.317251, mu=0.0363240547169562, sigma=0.0864148968790327,
T=T, N=mc.steps)
plot(t, S_t, type="l", main="Sample paths of the Geometric Brownian Motion")
for (i in 1:2) {
S_t <- GBM(S0=20.317251, mu=0.0363240547169562, sigma=0.0864148968790327,
T=T, N=mc.steps)
lines(t, S_t, type="l")
}
S_t
chevron_up_icon
1 out of 12
circle_padding
hide_on_mobile
zoom_out_icon
[object Object]