Southern Cross University GIS Project Proposal: Disaster Assessment

Verified

Added on  2019/09/30

|6
|1346
|310
Project
AI Summary
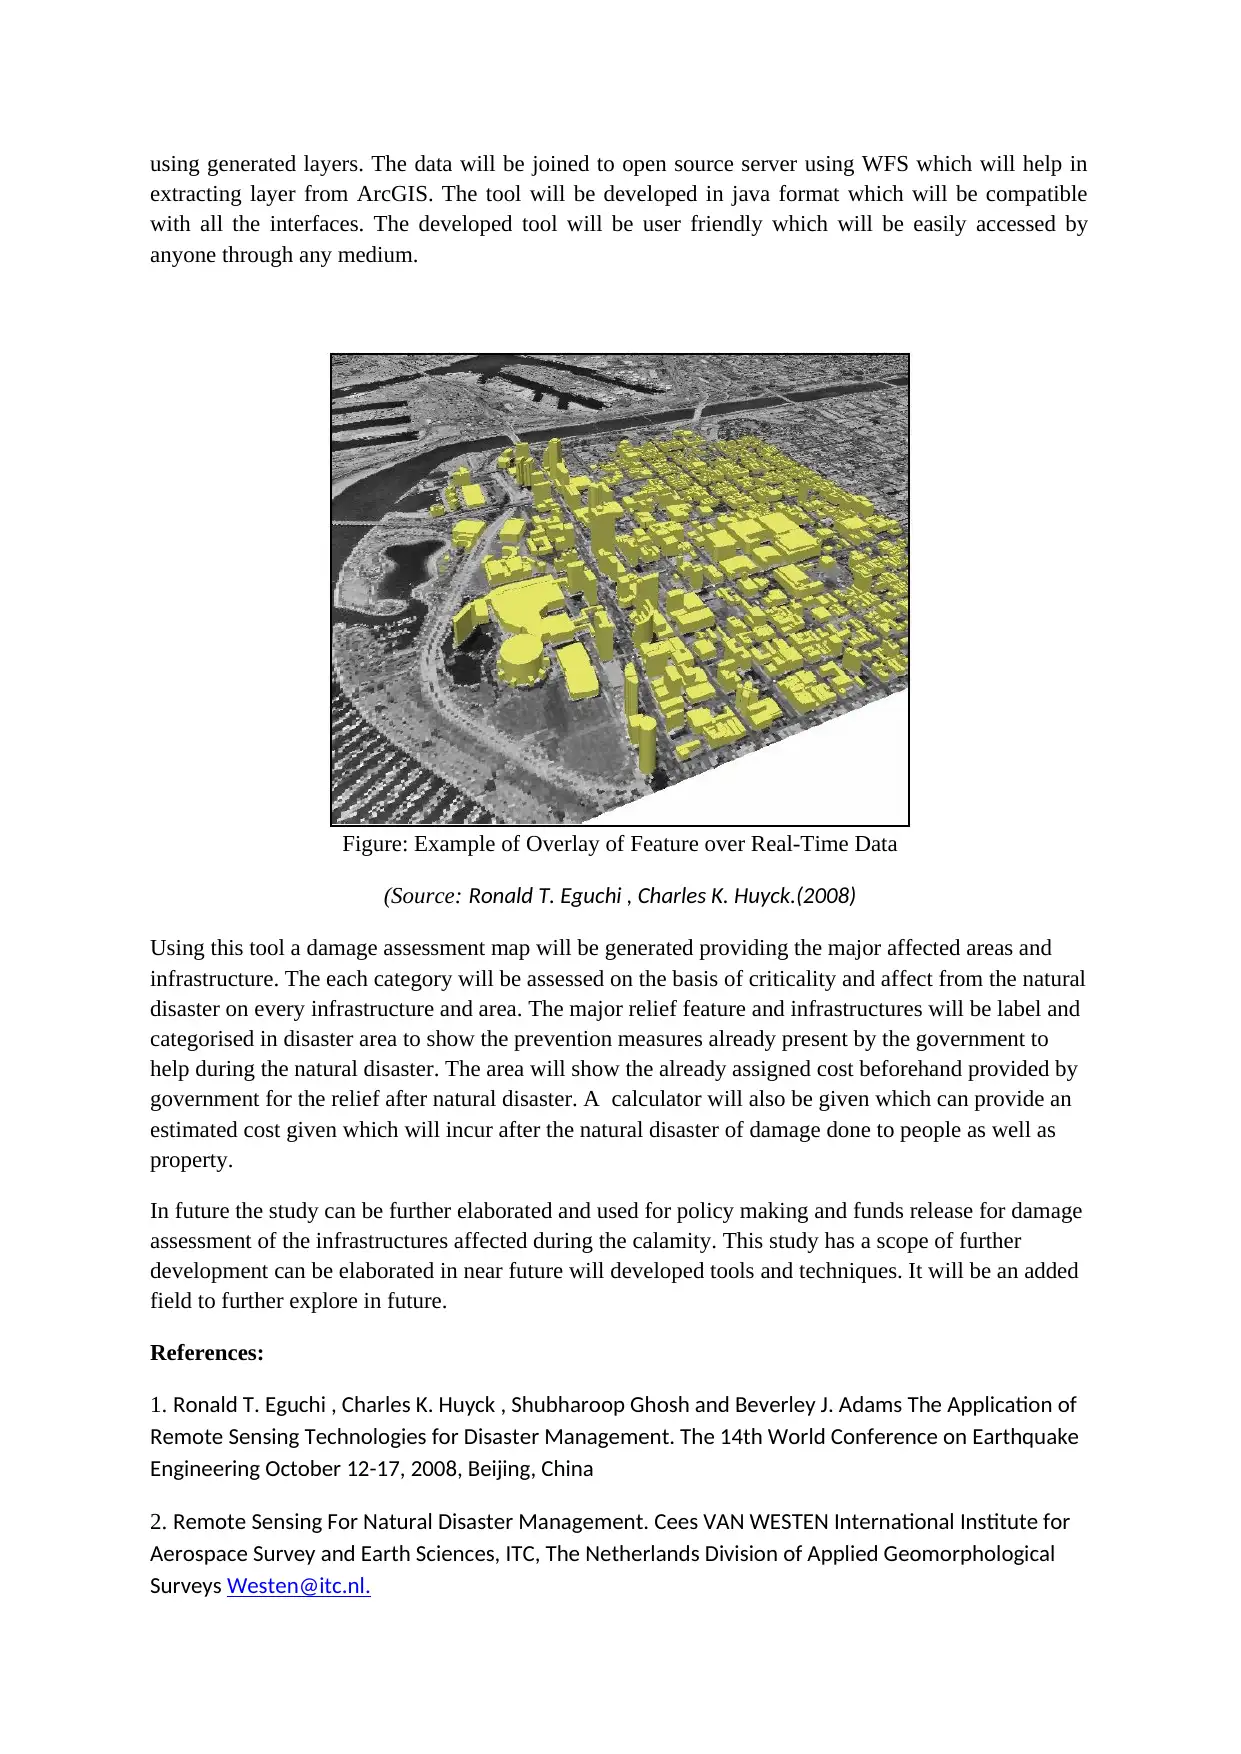
This project proposal outlines a GIS-based approach to natural disaster management, focusing on forecasting and real-time damage assessment. The study aims to leverage remote sensing and geospatial technologies to understand the built environment's vulnerability to natural hazards and assess the impact of disasters on urban areas. The project involves developing an inventory of existing critical infrastructure, analyzing historical disaster data to forecast future trends using geostatistical techniques, and creating a real-time damage detection tool. This tool, developed using ArcGIS API and open-source GeoEvent Server, will prioritize relief efforts, direct first responders, compute loss estimates, and determine the need for external aid. Data sources include topographic and cadastral maps, historical disaster data, satellite imagery (Sentinel 2, Landsat), and real-time imagery from Google Earth. The methodology includes defining a study area, developing an inventory, employing interpolation techniques, performing change detection using satellite data, and overlaying data layers for damage evaluation. The final product will be a user-friendly tool providing damage assessment maps, infrastructure categorization, and estimated costs. The project's future scope includes policy-making and fund allocation for disaster relief.
Document Page
SOUTHERN CROSS UNIVERSITY
ASSIGNMENT COVER SHEET
Student Name:
Student ID No.:
Unit Name:
Unit Code:
Tutor’s name:
Assignment Title: GIS Proposal
Due date:
Date submitted:
Declaration:
I have read and understand the Rules Relating to Awards (Rule 3 Section 18 – Academic Misconduct
Including Plagiarism) as contained in the SCU Policy Library. I understand the penalties that apply
for plagiarism and agree to be bound by these rules. The work I am submitting electronically is
entirely my own work.
Signed:
Date:
tabler-icon-diamond-filled.svg

Paraphrase This Document

Need a fresh take? Get an instant paraphrase of this document with our AI Paraphraser
Document Page
(Introduction to Geographic
Information System)
(Project Proposal)
(Forecast and Real-time damage assessment for natural disaster using
geospatial techniques)
Document Page
Problem Definition: This study will provide an overview of how remote sensing and geospatial
technologies can be used in the management of natural disasters. The focus is on approaches to
improve our understanding to the built environment and its vulnerability to natural hazards, and on
methods to better assess the impact of large natural disasters on urban areas. The study will
accumulate the trend of natural disasters for past 50 years to forecast future trends of disaster that
might occur and calculating the impact over the study area . Furthermore a real time damage
assessment tool will be developed to calculate the affect over infrastructure and livelihood where
relief can be provided. This study will help in providing forewarning for the major affected people
and will help in damage assessment caused by natural disaster which can further help government for
policy formation and taking up measures beforehand.
Objectives:
To develop an inventory for calamities occurred in the study area and already existing critical
infrastructure which act as rescue spots for people.
To develop a trend on the basis of last 50 years disaster data in region which can help in
forecasting for future assessment using geostatisical techniques.
To develop a tool for Real-time damage detection tool for natural disaster which initiates the
response process, providing the information needed to:
a) Prioritize relief efforts
b) Direct first responders to critical locations, thereby optimizing response times
c) Compute initial loss estimates
d) Determine whether the situation warrants national or international aid.
Data requirements:
Topographic Map- 1:50,000 scale
Cadastral Map
Natural Disaster occurrence data for Past 50 years
Past Satellite Data- Sentinal 2 , Landsat
Real Time Imagery – Google Earth
ArcMap Software Package
ArcGIS API Package with Open Source GeoEvent Server
Sources:
1. Australian Government Website – data,gov.au
2. Google Earth
3. Disaster Assist , Australian Government Initiative
https://www.disasterassist.gov.au/Pages/australian-disasters.aspx
4. Earth Explorer USGS
Process:
Defining Study Area: A basic layout map of the study area will be defined and constructed using
ArcMap with the help of topographic map. The topographic map will be imposed and main features
will be digitized to make a map. The Important infrastructures and area will be digitized out of
cadastral maps to make base layer of all the map and analysis.
Document Page
Figure: Base Map of Study Area
(Source: ArcMap 10.4)
Inventory Development: Accumulating an inclusive and accurate database of existing critical
infrastructure will be initially done for emergency management assessment. It provides a basis for
pertaining possible effects through forecasting, while setting up a baseline for determining the actual
extent of damage and associated losses once an event has occurred. It will be than attached to spatial
layers using join tool in ArcGIS.
Interpolation Techniques: On the basis of previous data points and information, interpolation tools
like Inverse-distance weightage, kriging, density etc. will be used to generate a categorical area on the
basis of impact. It will help in generation of spatial impact area affected by the disaster and which are
likely to be affected again in near future. The generated interpolated surface will help in dividing
areas into favourability of occurrence percentages which will help in forecasting the possible affected
areas by the natural disaster.
Change Detection: Temporal satellite data of Landsat and Sentinal will be downloaded from
government website or USGS portal. The study area will be extracted using ERDAS Imagine Subset
tool with help of AOI. By overlaying of the satellite data from different years the affected areas will
be demarcated and extracted by digitizing the area. Then it will be compared with the real time data
available to assess the damage.
Overlay: The layers are overlaid to demarcate the damaged areas and to evaluate them on the basis of
real time data according to the percentage damage. This will help in evaluating each area priority wise
according to old and real time data. Each area will be digitized percentage wise according colour
coding and correlation will be generated on the basis on the overlay results. The correlation will be
calculated using geostatistical tool like Moran’I etc. from spatial toolbox in ArcGIS.
Real- Time Damage Assessment Tool: The layers will be displayed over the real time satellite data
which will initiates the response process, providing the information needed for prioritizing relief
efforts and guiding responders to critical locations, thus enhancing response times. It will compute
initial loss estimates. The tool will be developed using ArcGIS API tool with open source GeoServer
tabler-icon-diamond-filled.svg

Paraphrase This Document

Need a fresh take? Get an instant paraphrase of this document with our AI Paraphraser
Document Page
using generated layers. The data will be joined to open source server using WFS which will help in
extracting layer from ArcGIS. The tool will be developed in java format which will be compatible
with all the interfaces. The developed tool will be user friendly which will be easily accessed by
anyone through any medium.
Figure: Example of Overlay of Feature over Real-Time Data
(Source: Ronald T. Eguchi , Charles K. Huyck.(2008)
Using this tool a damage assessment map will be generated providing the major affected areas and
infrastructure. The each category will be assessed on the basis of criticality and affect from the natural
disaster on every infrastructure and area. The major relief feature and infrastructures will be label and
categorised in disaster area to show the prevention measures already present by the government to
help during the natural disaster. The area will show the already assigned cost beforehand provided by
government for the relief after natural disaster. A calculator will also be given which can provide an
estimated cost given which will incur after the natural disaster of damage done to people as well as
property.
In future the study can be further elaborated and used for policy making and funds release for damage
assessment of the infrastructures affected during the calamity. This study has a scope of further
development can be elaborated in near future will developed tools and techniques. It will be an added
field to further explore in future.
References:
1. Ronald T. Eguchi , Charles K. Huyck , Shubharoop Ghosh and Beverley J. Adams The Application of
Remote Sensing Technologies for Disaster Management. The 14th World Conference on Earthquake
Engineering October 12-17, 2008, Beijing, China
2. Remote Sensing For Natural Disaster Management. Cees VAN WESTEN International Institute for
Aerospace Survey and Earth Sciences, ITC, The Netherlands Division of Applied Geomorphological
Surveys Westen@itc.nl.
Document Page
3. Aggarwal, Shiv & Thakur, Praveen & Dadhwal, Vinay. (2009). Remote sensing and GIS
Applications in Flood Management . Journal of Hydrological Research and Development, Theme
Flood Management. 24. 145-158.
4. CEOS, (2001), The Use of Earth Observing Satellites for Hazard Support: Assessments & Scenarios.
Final Report of the CEOS Disaster Management Support Group,
http://www.oosa.unvienna.org/SAP/stdm/CEOS_DMSG_Final_Report.pdf
chevron_up_icon
1 out of 6
circle_padding
hide_on_mobile
zoom_out_icon
[object Object]