GIS Report: Survey Site Selection, Feature Data, and Analysis
VerifiedAdded on 2020/02/24
|9
|1904
|171
Report
AI Summary
This report provides an introduction to Geographic Information Systems (GIS), focusing on survey site selection, feature data collection, and analysis. The report details the creation of a field reconnaissance data entry list, outlining feature types, attributes, and menu lists for various site elements. It also explores field satellite optimization, including compass directions and changes in northing/easting. The discussion section delves into methods for plotting obstructions in sky window diagrams during satellite optimization, the significance of Position Dilution of Precision (PDOP) values, and the importance of satellite geometry for accurate data collection. It explains the differences between GPS heights and local council height datums, detailing how orthometric heights and reduced levels are obtained. The report also discusses survey control marks, suitable attribute names, and methods for evaluating the accuracy of topographical data. Finally, the report provides references to support the information presented.

INTRODUCTION TO GIS 1
Introduction to GIS
Name
Institution
Introduction to GIS
Name
Institution
Paraphrase This Document
Need a fresh take? Get an instant paraphrase of this document with our AI Paraphraser
INTRODUCTION TO GIS 2
Introduction to GIS
Survey Site Selection
Feature Data Collection
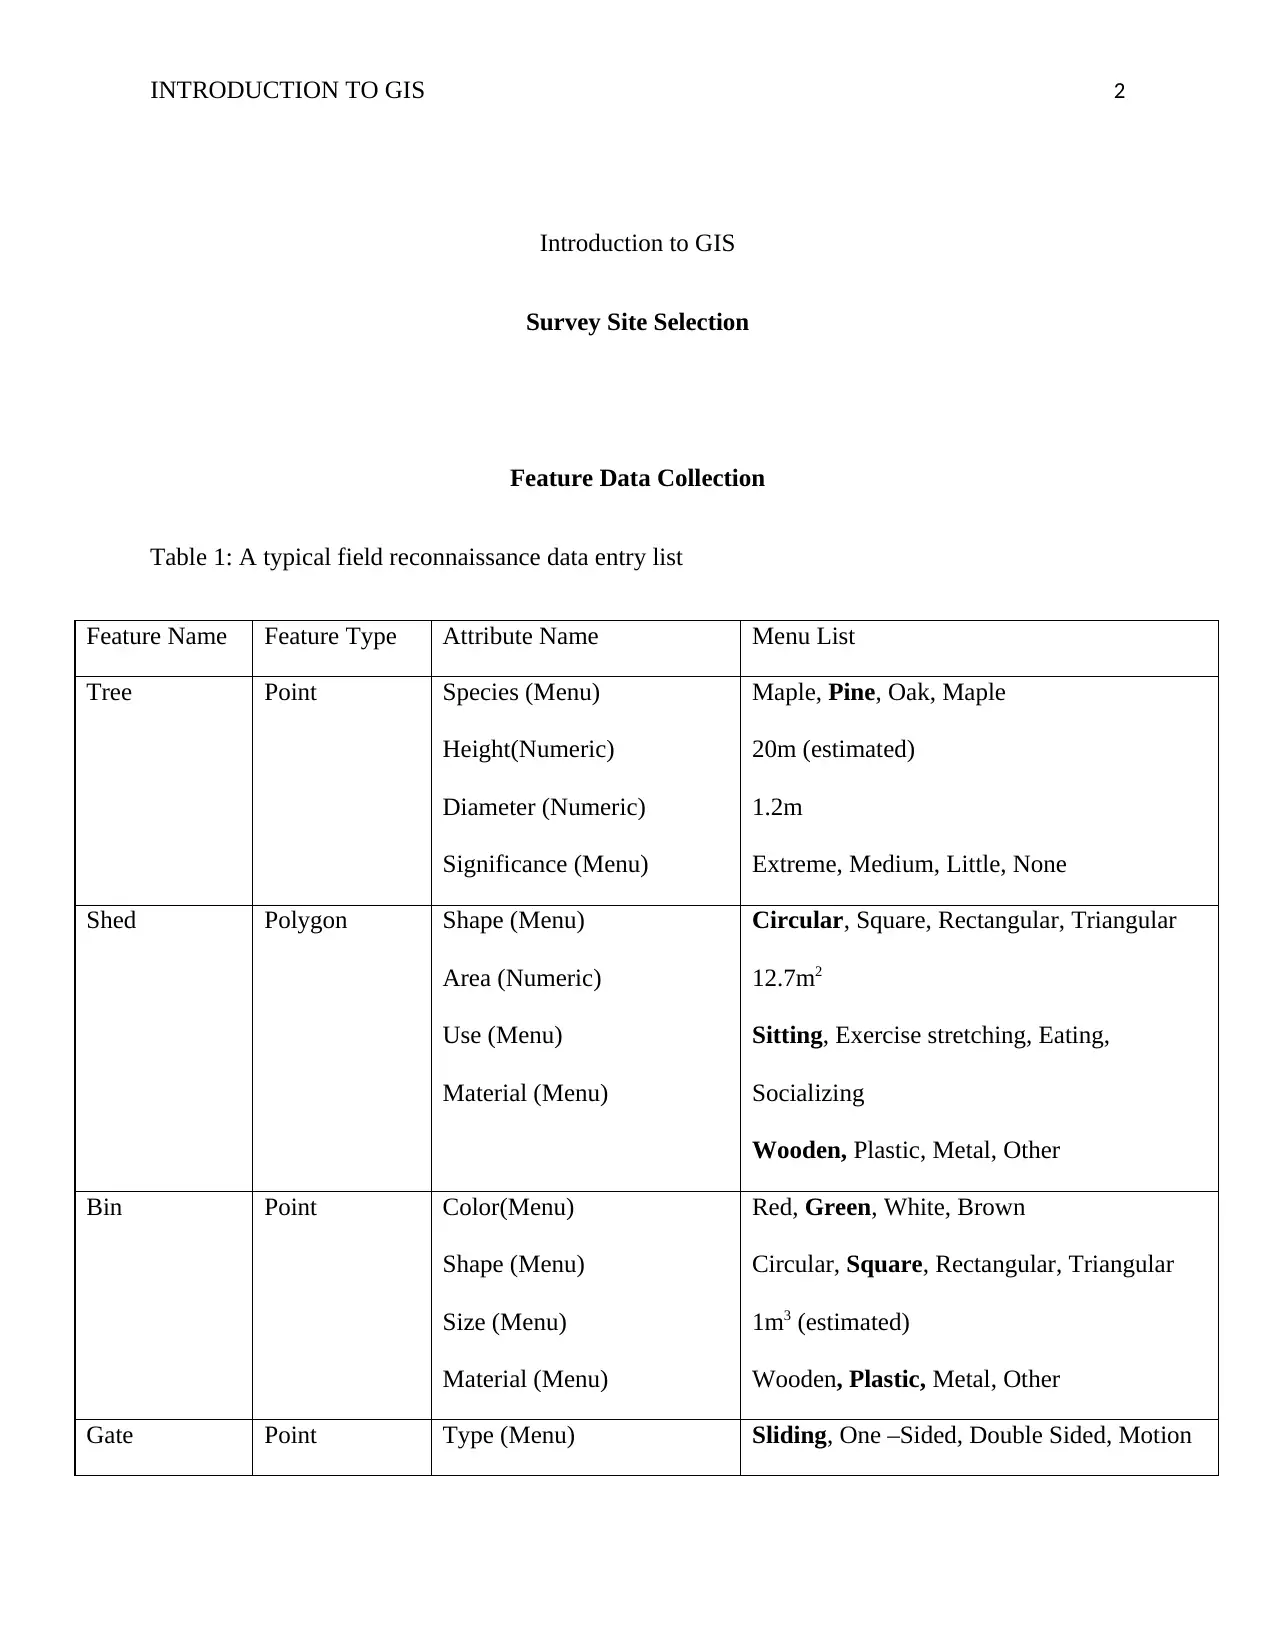
Table 1: A typical field reconnaissance data entry list
Feature Name Feature Type Attribute Name Menu List
Tree Point Species (Menu)
Height(Numeric)
Diameter (Numeric)
Significance (Menu)
Maple, Pine, Oak, Maple
20m (estimated)
1.2m
Extreme, Medium, Little, None
Shed Polygon Shape (Menu)
Area (Numeric)
Use (Menu)
Material (Menu)
Circular, Square, Rectangular, Triangular
12.7m2
Sitting, Exercise stretching, Eating,
Socializing
Wooden, Plastic, Metal, Other
Bin Point Color(Menu)
Shape (Menu)
Size (Menu)
Material (Menu)
Red, Green, White, Brown
Circular, Square, Rectangular, Triangular
1m3 (estimated)
Wooden, Plastic, Metal, Other
Gate Point Type (Menu) Sliding, One –Sided, Double Sided, Motion
Introduction to GIS
Survey Site Selection
Feature Data Collection
Table 1: A typical field reconnaissance data entry list
Feature Name Feature Type Attribute Name Menu List
Tree Point Species (Menu)
Height(Numeric)
Diameter (Numeric)
Significance (Menu)
Maple, Pine, Oak, Maple
20m (estimated)
1.2m
Extreme, Medium, Little, None
Shed Polygon Shape (Menu)
Area (Numeric)
Use (Menu)
Material (Menu)
Circular, Square, Rectangular, Triangular
12.7m2
Sitting, Exercise stretching, Eating,
Socializing
Wooden, Plastic, Metal, Other
Bin Point Color(Menu)
Shape (Menu)
Size (Menu)
Material (Menu)
Red, Green, White, Brown
Circular, Square, Rectangular, Triangular
1m3 (estimated)
Wooden, Plastic, Metal, Other
Gate Point Type (Menu) Sliding, One –Sided, Double Sided, Motion
INTRODUCTION TO GIS 3
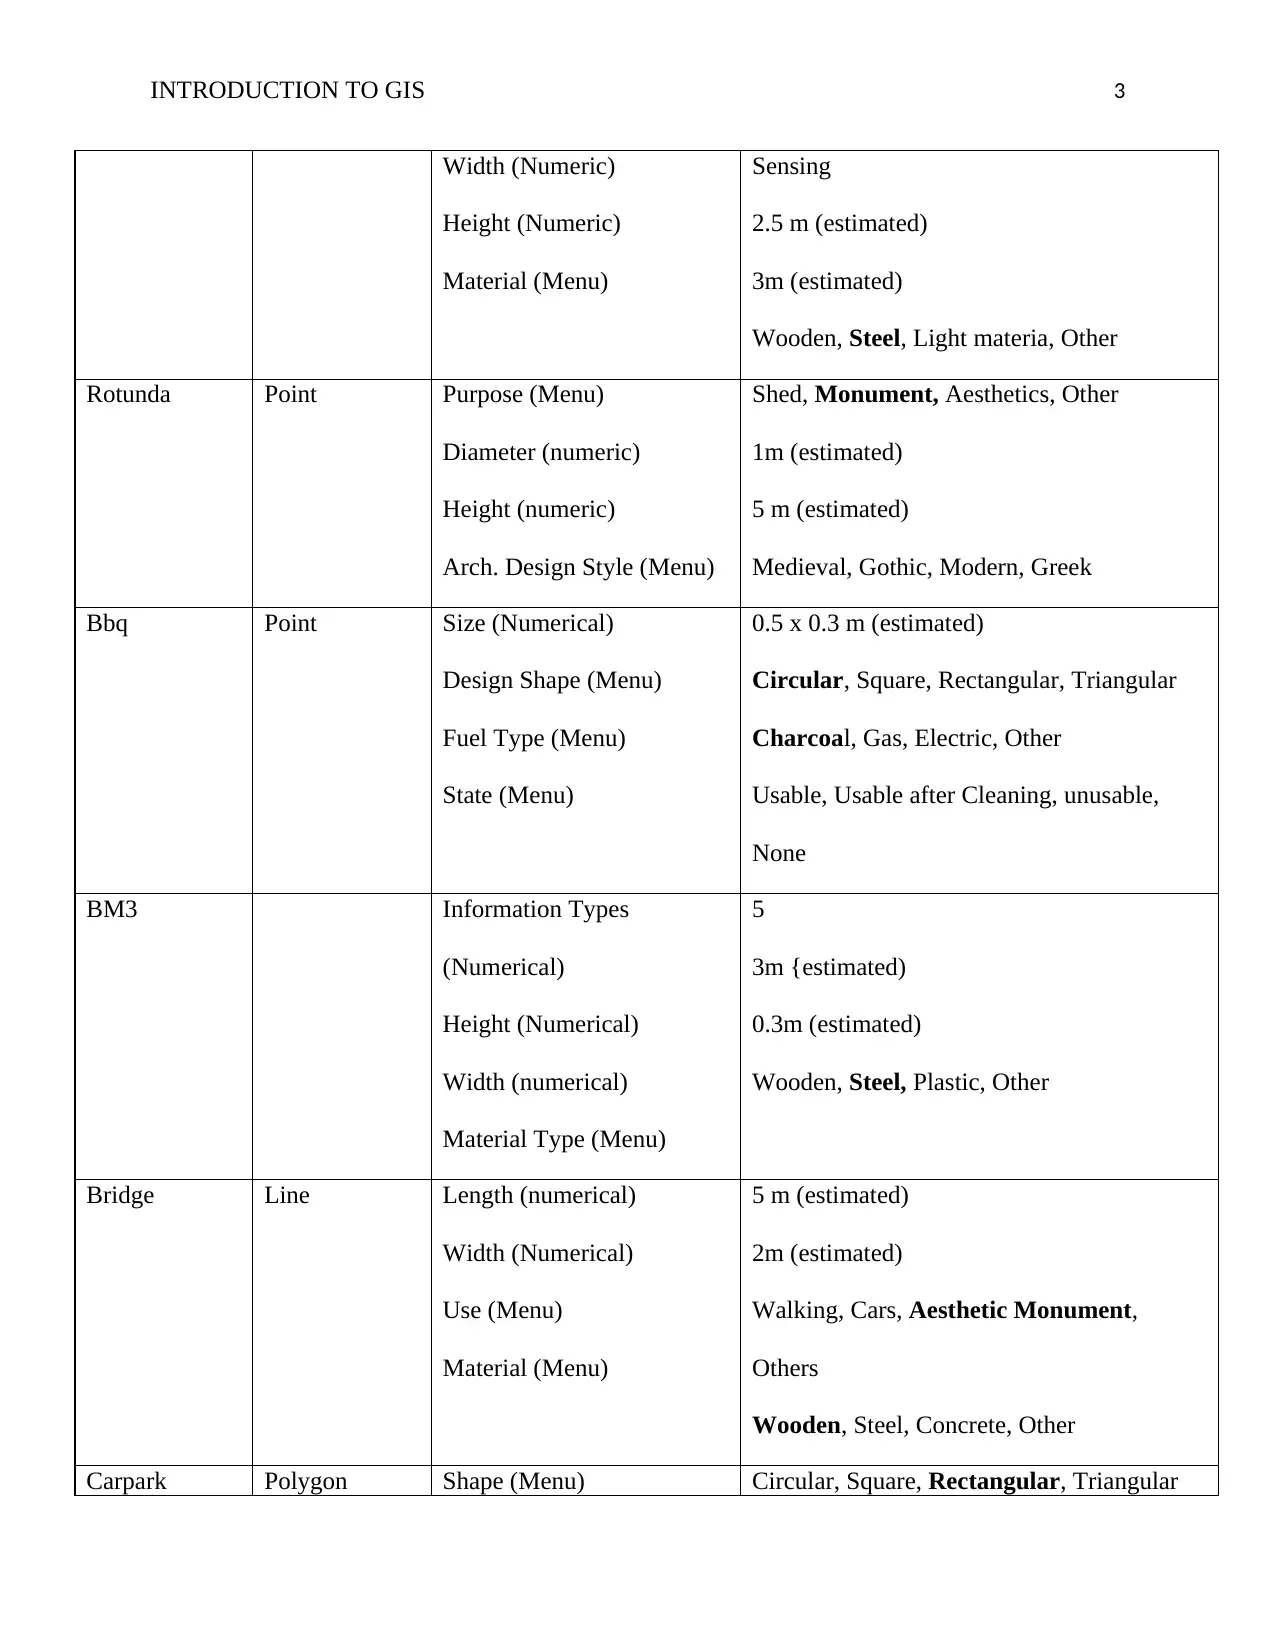
Width (Numeric)
Height (Numeric)
Material (Menu)
Sensing
2.5 m (estimated)
3m (estimated)
Wooden, Steel, Light materia, Other
Rotunda Point Purpose (Menu)
Diameter (numeric)
Height (numeric)
Arch. Design Style (Menu)
Shed, Monument, Aesthetics, Other
1m (estimated)
5 m (estimated)
Medieval, Gothic, Modern, Greek
Bbq Point Size (Numerical)
Design Shape (Menu)
Fuel Type (Menu)
State (Menu)
0.5 x 0.3 m (estimated)
Circular, Square, Rectangular, Triangular
Charcoal, Gas, Electric, Other
Usable, Usable after Cleaning, unusable,
None
BM3 Information Types
(Numerical)
Height (Numerical)
Width (numerical)
Material Type (Menu)
5
3m {estimated)
0.3m (estimated)
Wooden, Steel, Plastic, Other
Bridge Line Length (numerical)
Width (Numerical)
Use (Menu)
Material (Menu)
5 m (estimated)
2m (estimated)
Walking, Cars, Aesthetic Monument,
Others
Wooden, Steel, Concrete, Other
Carpark Polygon Shape (Menu) Circular, Square, Rectangular, Triangular
⊘ This is a preview!⊘
Do you want full access?
Subscribe today to unlock all pages.
Trusted by 1+ million students worldwide
INTRODUCTION TO GIS 4
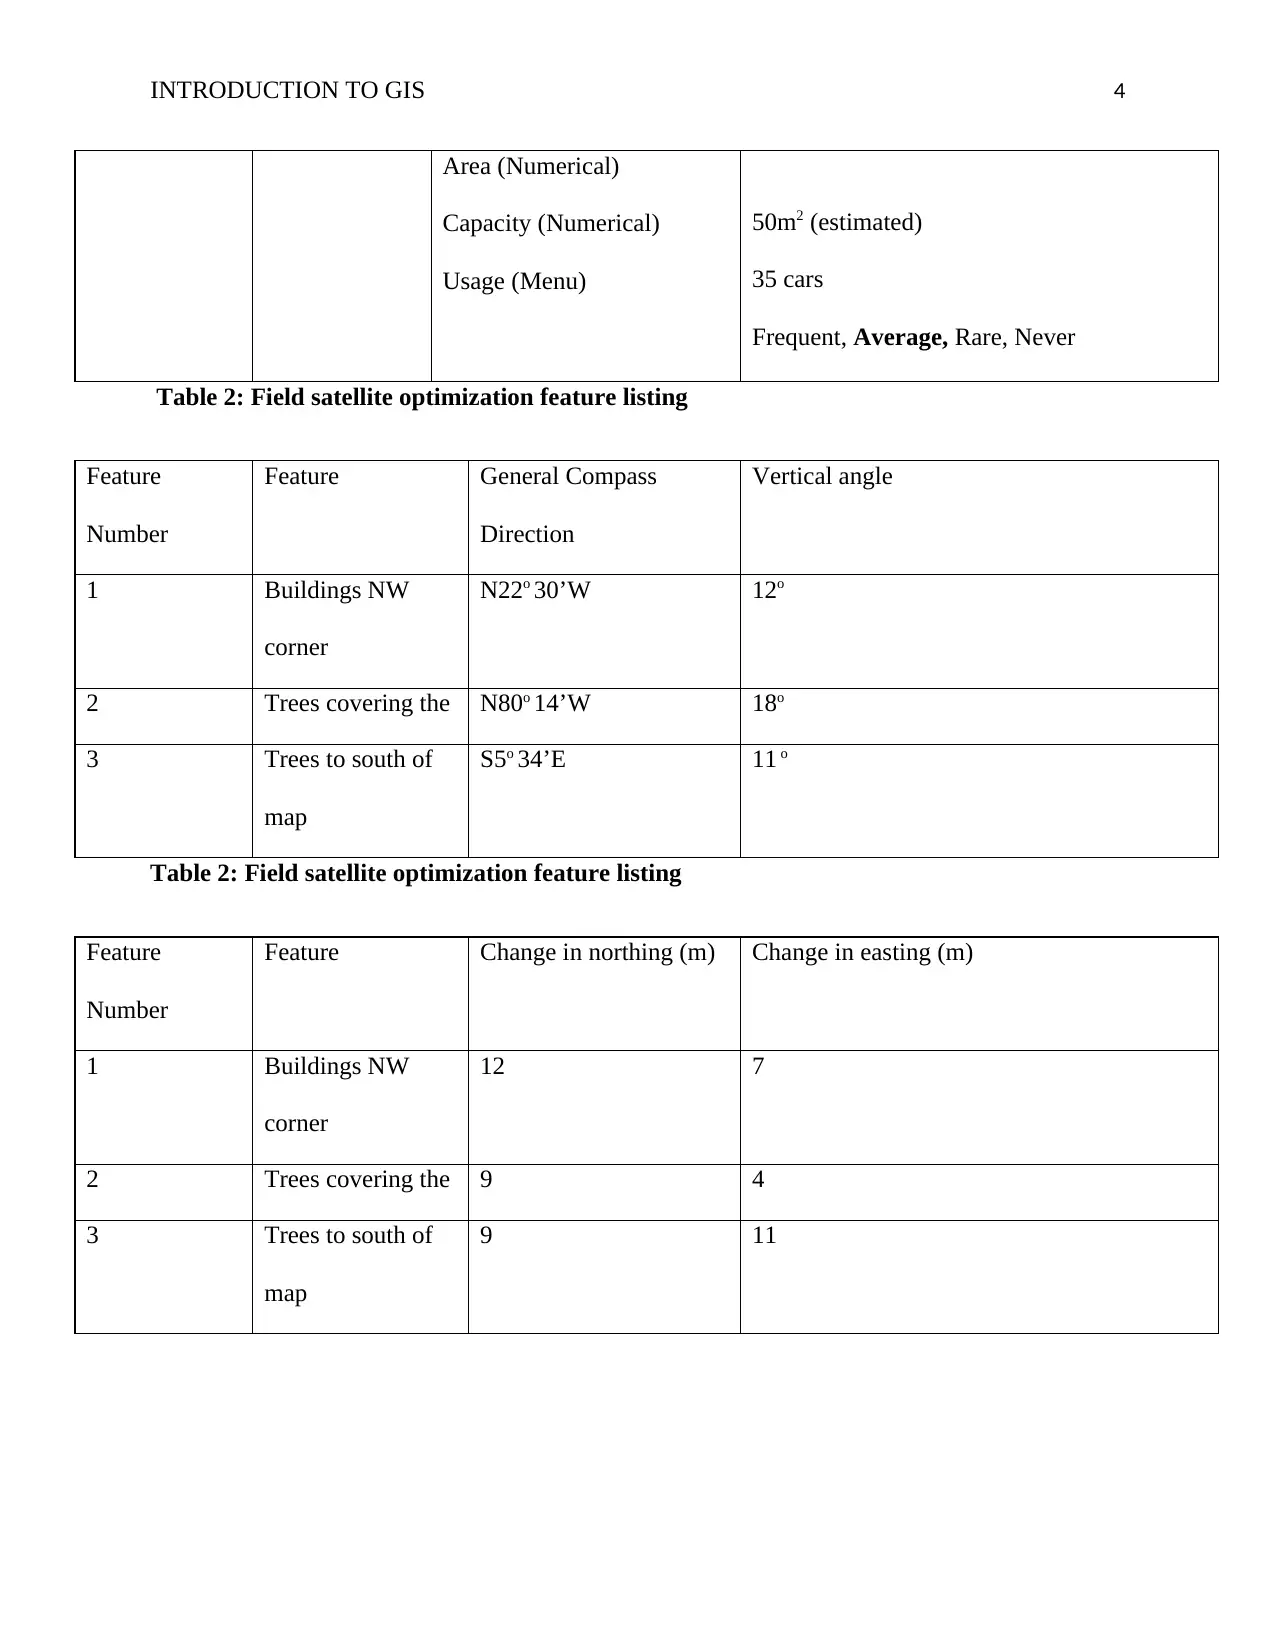
Area (Numerical)
Capacity (Numerical)
Usage (Menu)
50m2 (estimated)
35 cars
Frequent, Average, Rare, Never
Table 2: Field satellite optimization feature listing
Feature
Number
Feature General Compass
Direction
Vertical angle
1 Buildings NW
corner
N22o 30’W 12o
2 Trees covering the N80o 14’W 18o
3 Trees to south of
map
S5o 34’E 11 o
Table 2: Field satellite optimization feature listing
Feature
Number
Feature Change in northing (m) Change in easting (m)
1 Buildings NW
corner
12 7
2 Trees covering the 9 4
3 Trees to south of
map
9 11
Paraphrase This Document
Need a fresh take? Get an instant paraphrase of this document with our AI Paraphraser
INTRODUCTION TO GIS 5
Results
Map
See attached excel sheet under the 3D map tab. The map was created using the excel version of
2016. Just open the data and click open 3D maps menu under the insert tab of excel.
Discussion
To plot any obstructions in the sky window diagrams during the satellite optimization
plan of the project, one of the methods that could be utilized is to occupy that point for a longer
time than is expected. This is due to the fact that the GNSS observation technique is very
sensitive to observing conditions that are not optimal (Lindström, Akos, Isoz, & Junered, 2007).
This enables all of the variations in the data collected by the GNSS recievers to be minimized
through the lengthened collection tuime, thus increasing the effectiveness of the plots of the
obstruction in the sky window diagram.
The Position Dilution of Preposition refers to the impact of the configuration of satellites
in the space on any of the data that was collected using the GNSS reciever when it was used in
the field. The role of the PDOP is spurred by the fact that satellites are able to triangulate the
positions on the earths surface, although the vertical result is always less accurate than the
horizontal positions. PDOP values are significant in any of this exercise as they provide an
opportunity to establish the geometry of the prevailing satellites while the data is being collected
using the recievers.When these satellites occur in the same area in the space, the configuration
of these satelites is said to be weak whereas when they are well spresad out in the sky, their
configuration is said to be strong (Wing, Eklund, & Kellogg, 2005). Thus, when a a PDOP value
of a maximum of 4.0 is obtained, the value is said to be a low PDOP value, indicating that the
INTRODUCTION TO GIS 6
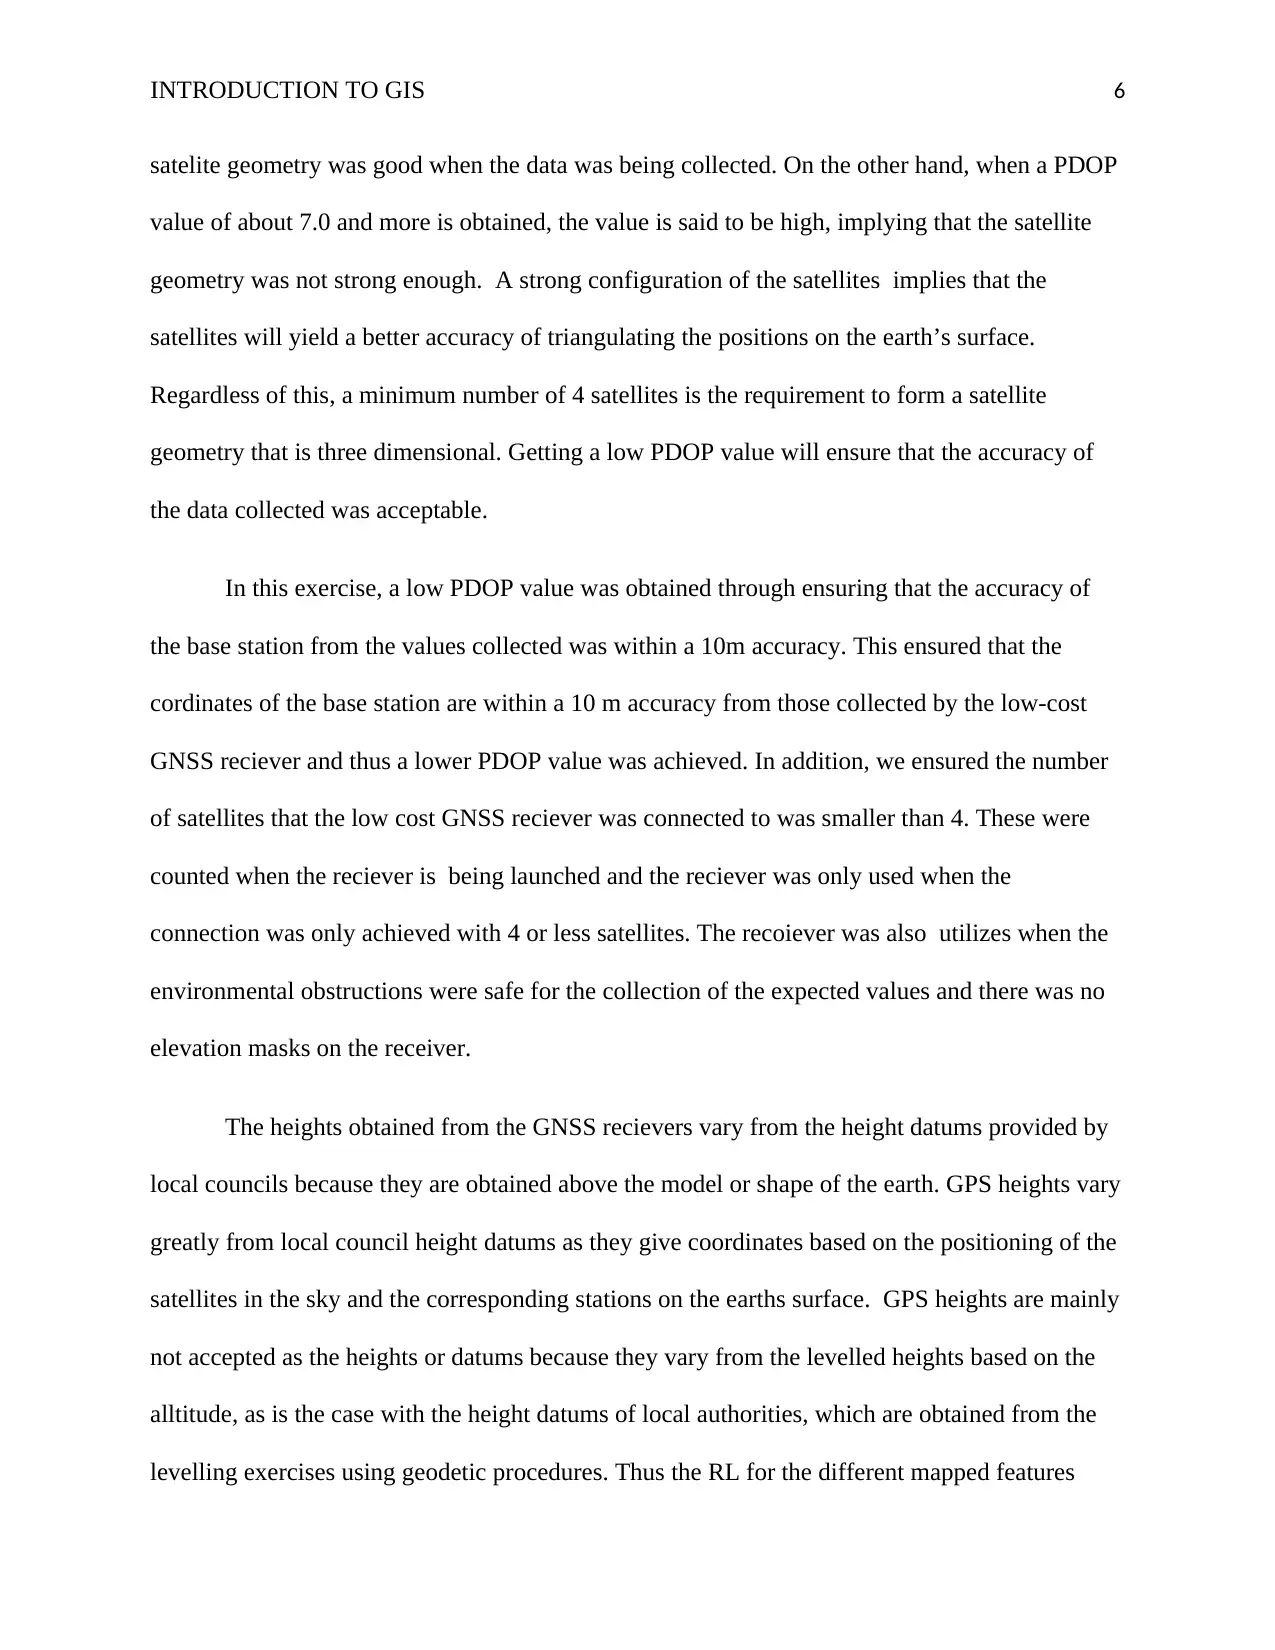
satelite geometry was good when the data was being collected. On the other hand, when a PDOP
value of about 7.0 and more is obtained, the value is said to be high, implying that the satellite
geometry was not strong enough. A strong configuration of the satellites implies that the
satellites will yield a better accuracy of triangulating the positions on the earth’s surface.
Regardless of this, a minimum number of 4 satellites is the requirement to form a satellite
geometry that is three dimensional. Getting a low PDOP value will ensure that the accuracy of
the data collected was acceptable.
In this exercise, a low PDOP value was obtained through ensuring that the accuracy of
the base station from the values collected was within a 10m accuracy. This ensured that the
cordinates of the base station are within a 10 m accuracy from those collected by the low-cost
GNSS reciever and thus a lower PDOP value was achieved. In addition, we ensured the number
of satellites that the low cost GNSS reciever was connected to was smaller than 4. These were
counted when the reciever is being launched and the reciever was only used when the
connection was only achieved with 4 or less satellites. The recoiever was also utilizes when the
environmental obstructions were safe for the collection of the expected values and there was no
elevation masks on the receiver.
The heights obtained from the GNSS recievers vary from the height datums provided by
local councils because they are obtained above the model or shape of the earth. GPS heights vary
greatly from local council height datums as they give coordinates based on the positioning of the
satellites in the sky and the corresponding stations on the earths surface. GPS heights are mainly
not accepted as the heights or datums because they vary from the levelled heights based on the
alltitude, as is the case with the height datums of local authorities, which are obtained from the
levelling exercises using geodetic procedures. Thus the RL for the different mapped features
⊘ This is a preview!⊘
Do you want full access?
Subscribe today to unlock all pages.
Trusted by 1+ million students worldwide
INTRODUCTION TO GIS 7
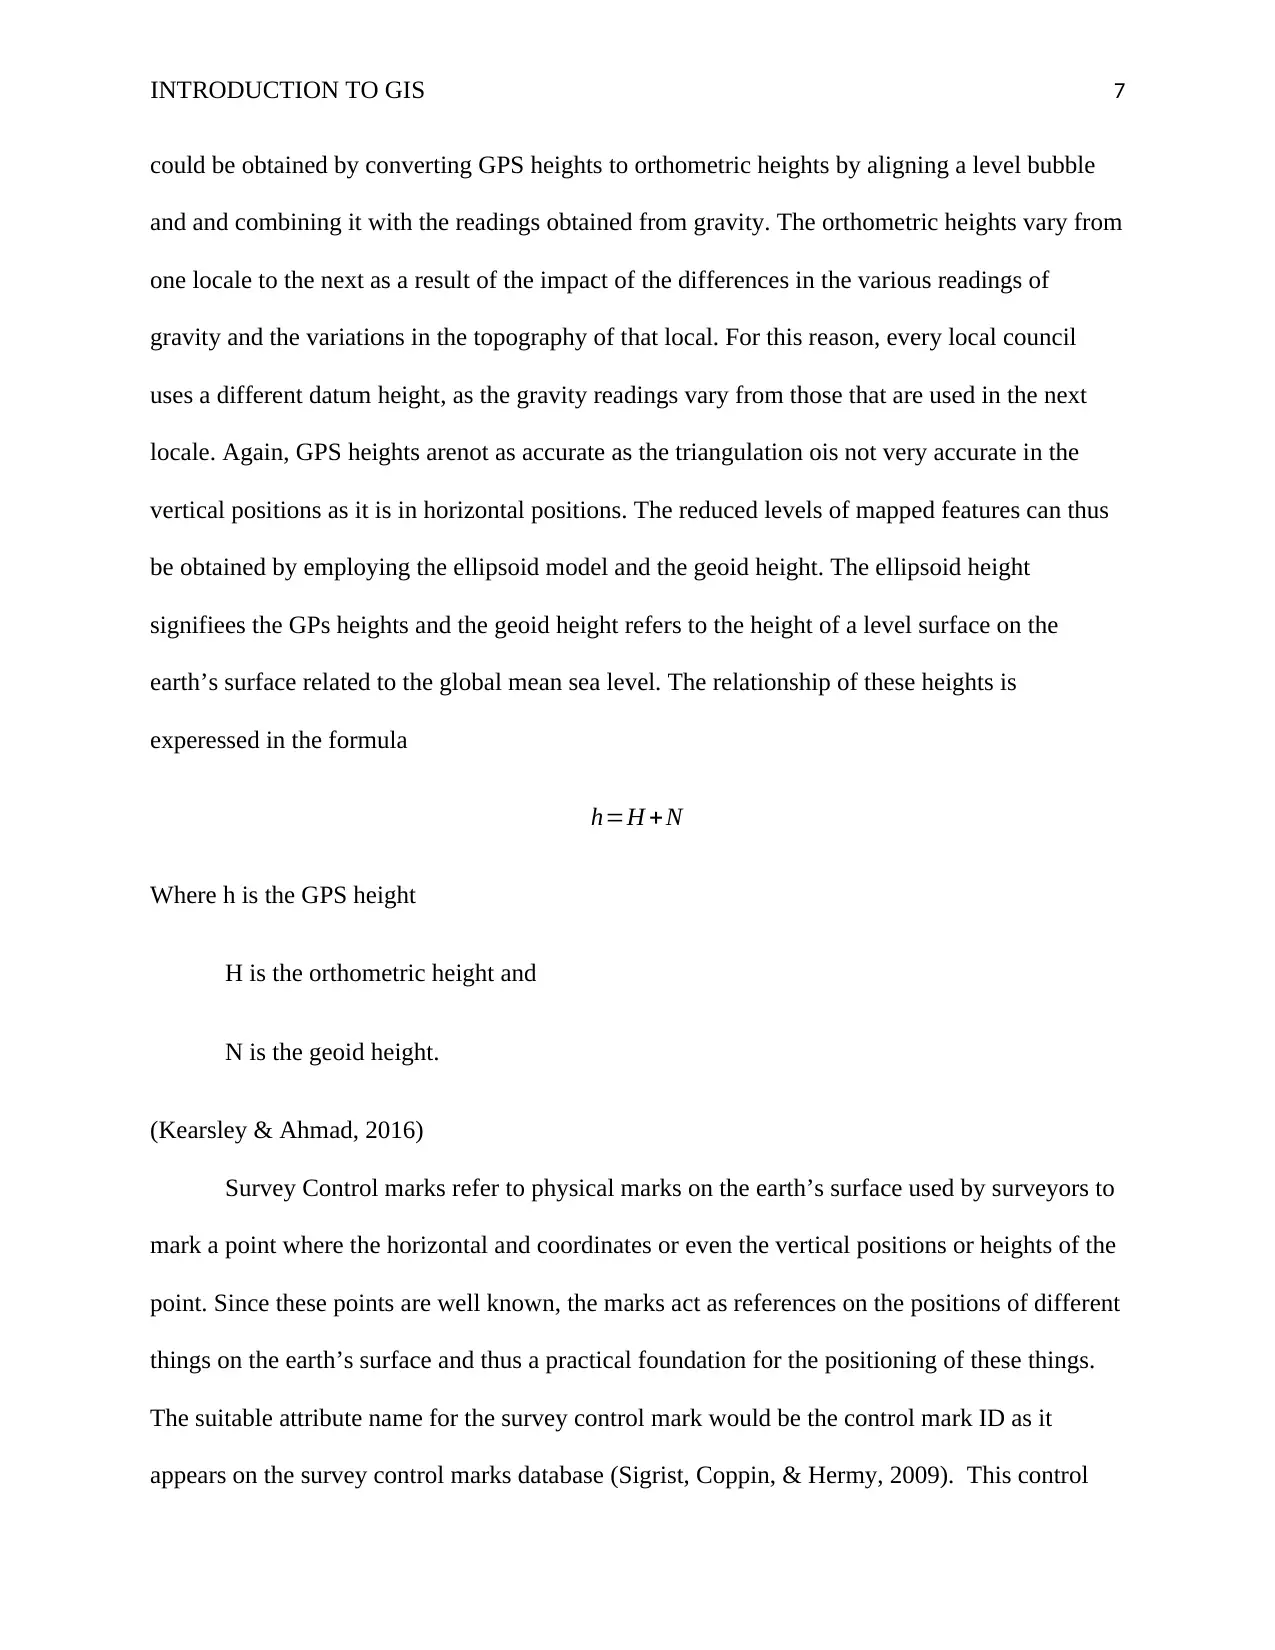
could be obtained by converting GPS heights to orthometric heights by aligning a level bubble
and and combining it with the readings obtained from gravity. The orthometric heights vary from
one locale to the next as a result of the impact of the differences in the various readings of
gravity and the variations in the topography of that local. For this reason, every local council
uses a different datum height, as the gravity readings vary from those that are used in the next
locale. Again, GPS heights arenot as accurate as the triangulation ois not very accurate in the
vertical positions as it is in horizontal positions. The reduced levels of mapped features can thus
be obtained by employing the ellipsoid model and the geoid height. The ellipsoid height
signifiees the GPs heights and the geoid height refers to the height of a level surface on the
earth’s surface related to the global mean sea level. The relationship of these heights is
experessed in the formula
h=H +N
Where h is the GPS height
H is the orthometric height and
N is the geoid height.
(Kearsley & Ahmad, 2016)
Survey Control marks refer to physical marks on the earth’s surface used by surveyors to
mark a point where the horizontal and coordinates or even the vertical positions or heights of the
point. Since these points are well known, the marks act as references on the positions of different
things on the earth’s surface and thus a practical foundation for the positioning of these things.
The suitable attribute name for the survey control mark would be the control mark ID as it
appears on the survey control marks database (Sigrist, Coppin, & Hermy, 2009). This control
Paraphrase This Document
Need a fresh take? Get an instant paraphrase of this document with our AI Paraphraser
INTRODUCTION TO GIS 8
mark ID is also in different occasions referred to as the site ID. The feature type of a survey
control mark is a point as its role is to contain known values of horizontal and vertical positions
of a point that could be used as a reference point to identify the position of other points. The
menu list or attribute values of this point are mainly related to the position of the point in the
earth’s surface, including the vertical and horizontal positions using the XYZ axis. This will
mainly entail the northing and eastings of the point as well as its vertical position. Other
attributes may include the details on how to access the point as well as other descriptions of other
works.
While it is impossible for GIS data to be accurate, the accuracy in of topographical data
can be evaluated through different methods. Firstly, when it is compared to the existing
photographs or maps of the area, the data received by the GNSS ought to appear almost alike to
the existing data. In addition, the collected data being compared to any additional existing data,
the PDOP values ought to be as low as possible as fewer satellites guarantee more accurate
results.
References

INTRODUCTION TO GIS 9
Lindström, J., Akos, D., Isoz, O., & Junered, M. (2007). GNSS interference detection and
localization using a network of low cost front-end modules. In International Technical
Meeting of the Satellite Division of the Institute of Navigation: 24/09/2007-28/09/2007
(pp. 1165-1172). Institute of Navigation, The.
Kearsley, W., & Ahmad, Z. (2016). Geoid Computations of Heights. Australian Component of
the Land Management Project, 1-14.
Sigrist, P., Coppin, P., & Hermy, M. (2009). Impact of forest canopy on quality and accuracy of
GPS measurements. International Journal of Remote Sensing, 20(18), 3595-3610.
Wing, M. G., Eklund, A., & Kellogg, L. D. (2005). Consumer-grade global positioning system
(GPS) accuracy and reliability. Journal of forestry, 103(4), 169-173.
⊘ This is a preview!⊘
Do you want full access?
Subscribe today to unlock all pages.
Trusted by 1+ million students worldwide
1 out of 9
Your All-in-One AI-Powered Toolkit for Academic Success.
+13062052269
info@desklib.com
Available 24*7 on WhatsApp / Email
![[object Object]](/_next/static/media/star-bottom.7253800d.svg)
Unlock your academic potential
Copyright © 2020–2026 A2Z Services. All Rights Reserved. Developed and managed by ZUCOL.