Data Analysis and Forecasting: Humidity in Glasgow, Scotland (2019)
VerifiedAdded on 2023/01/16
|11
|1382
|94
Homework Assignment
AI Summary
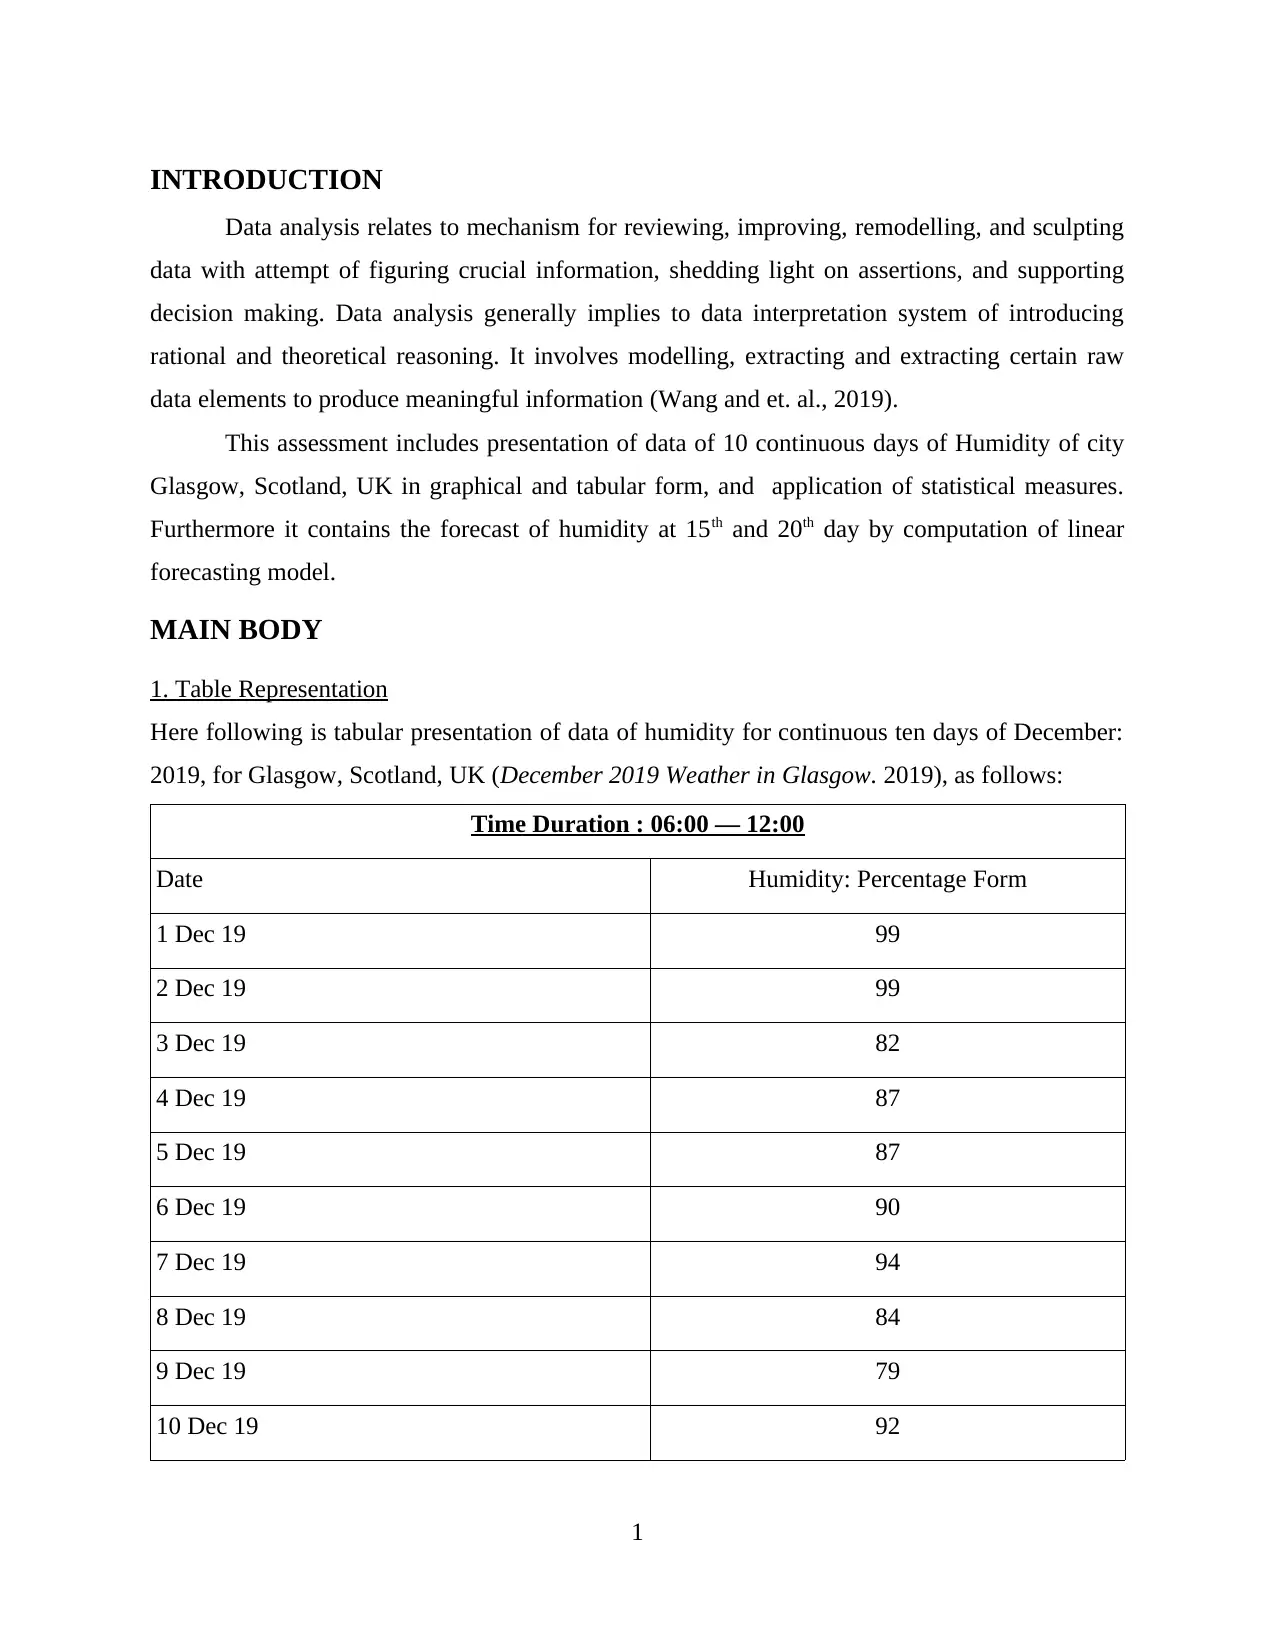
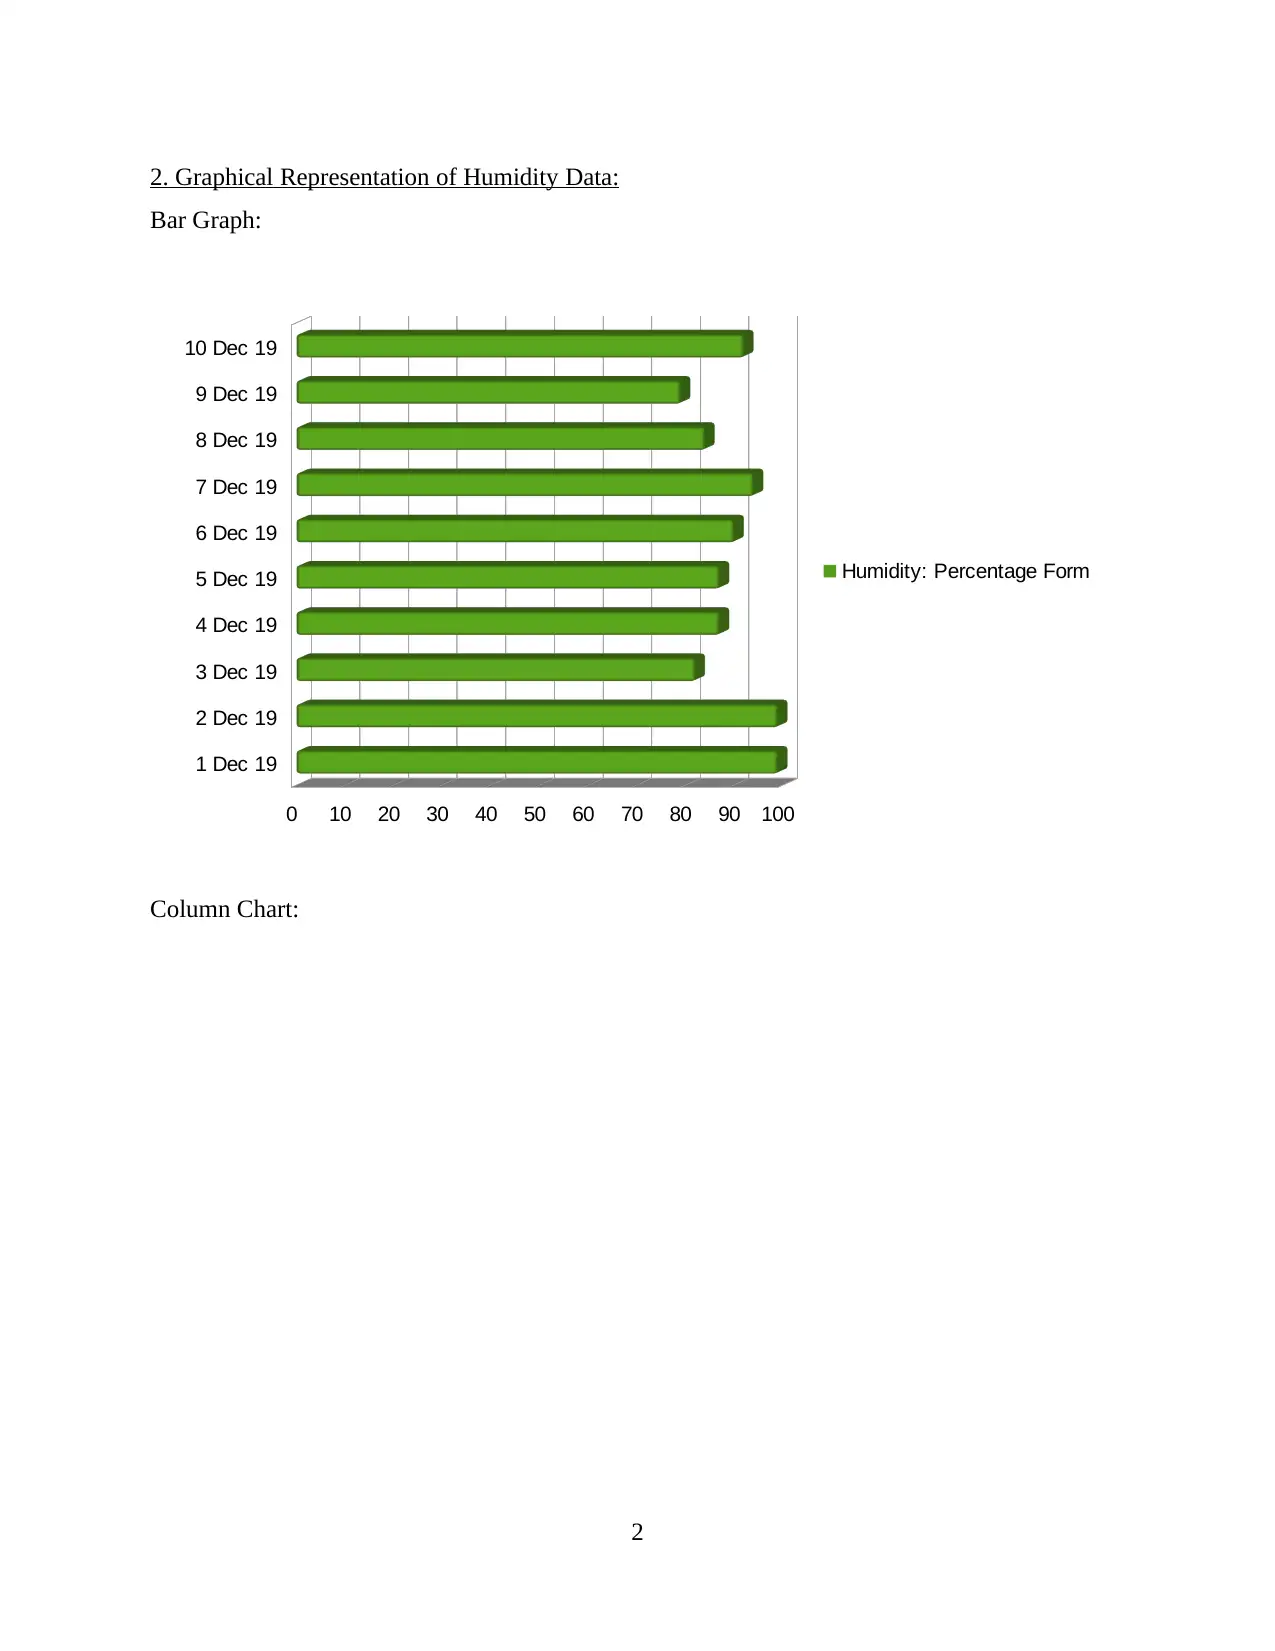
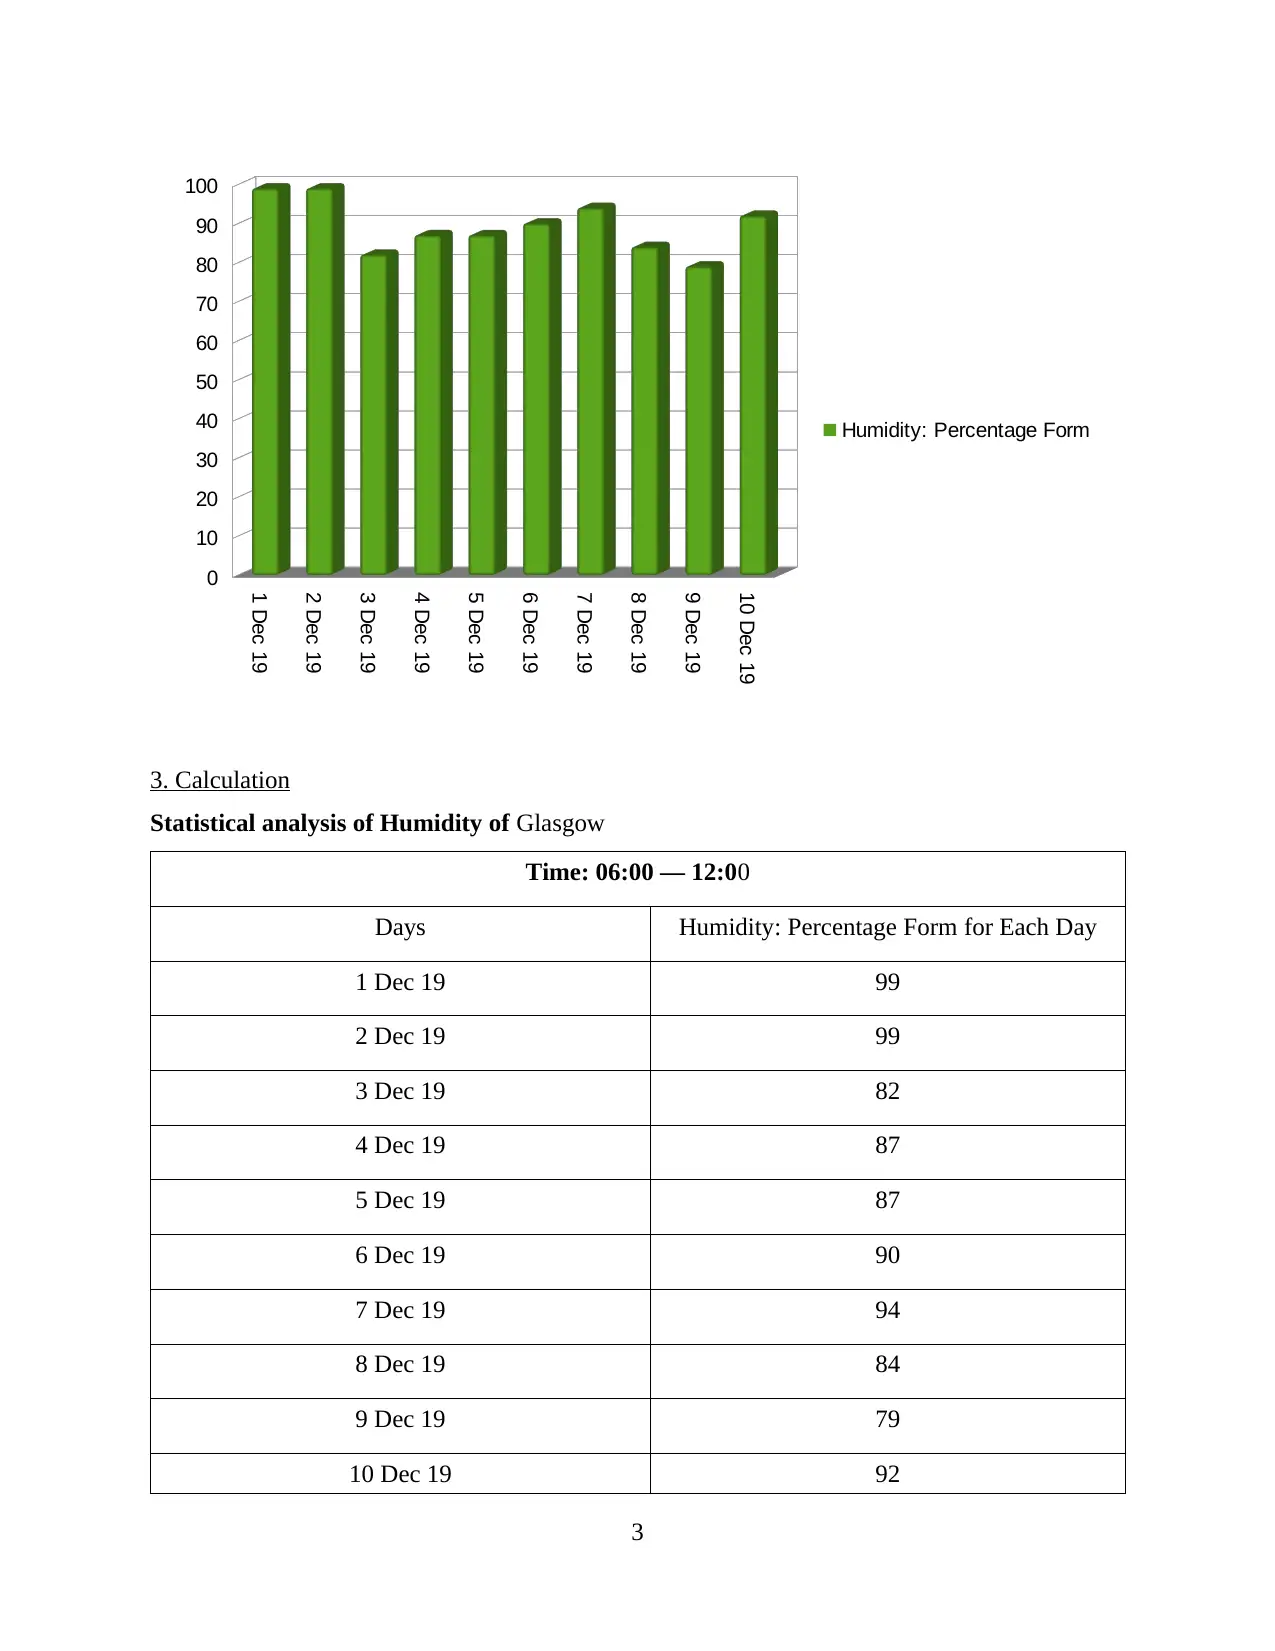
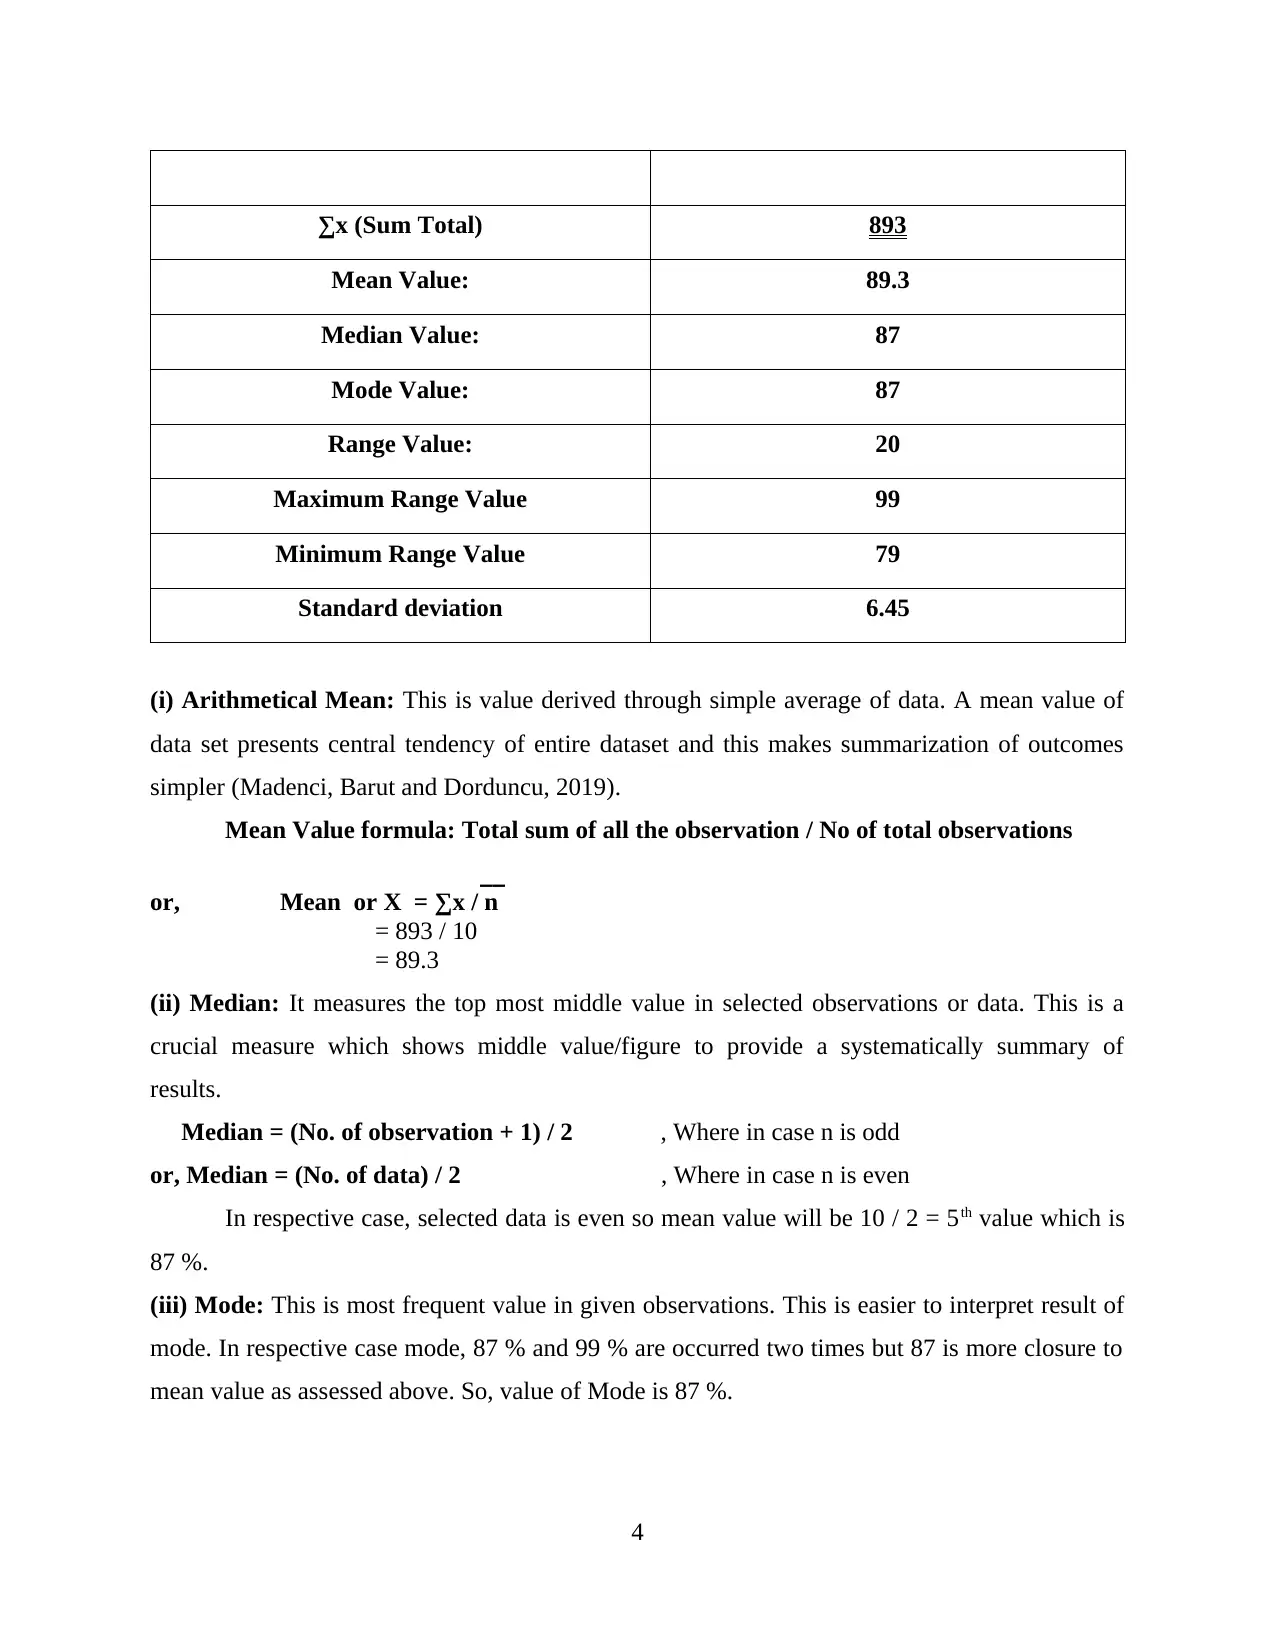
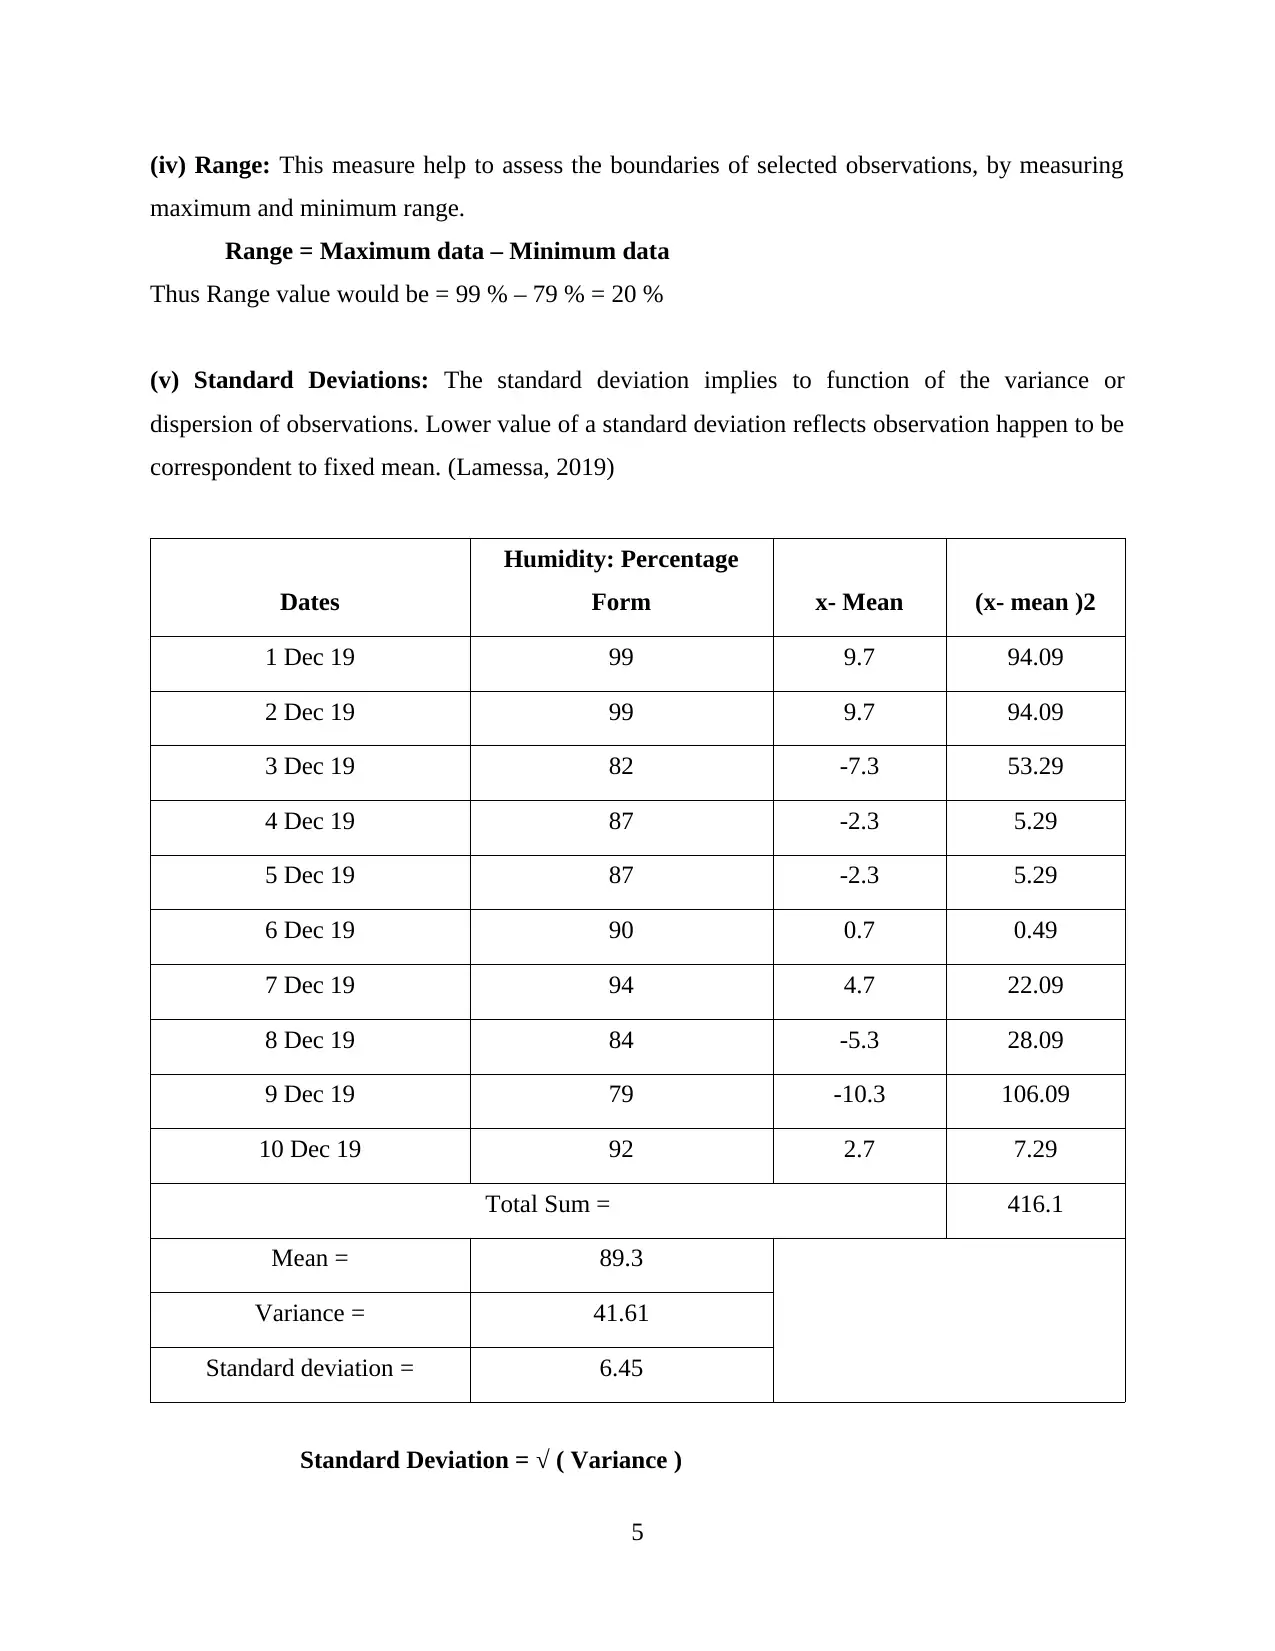
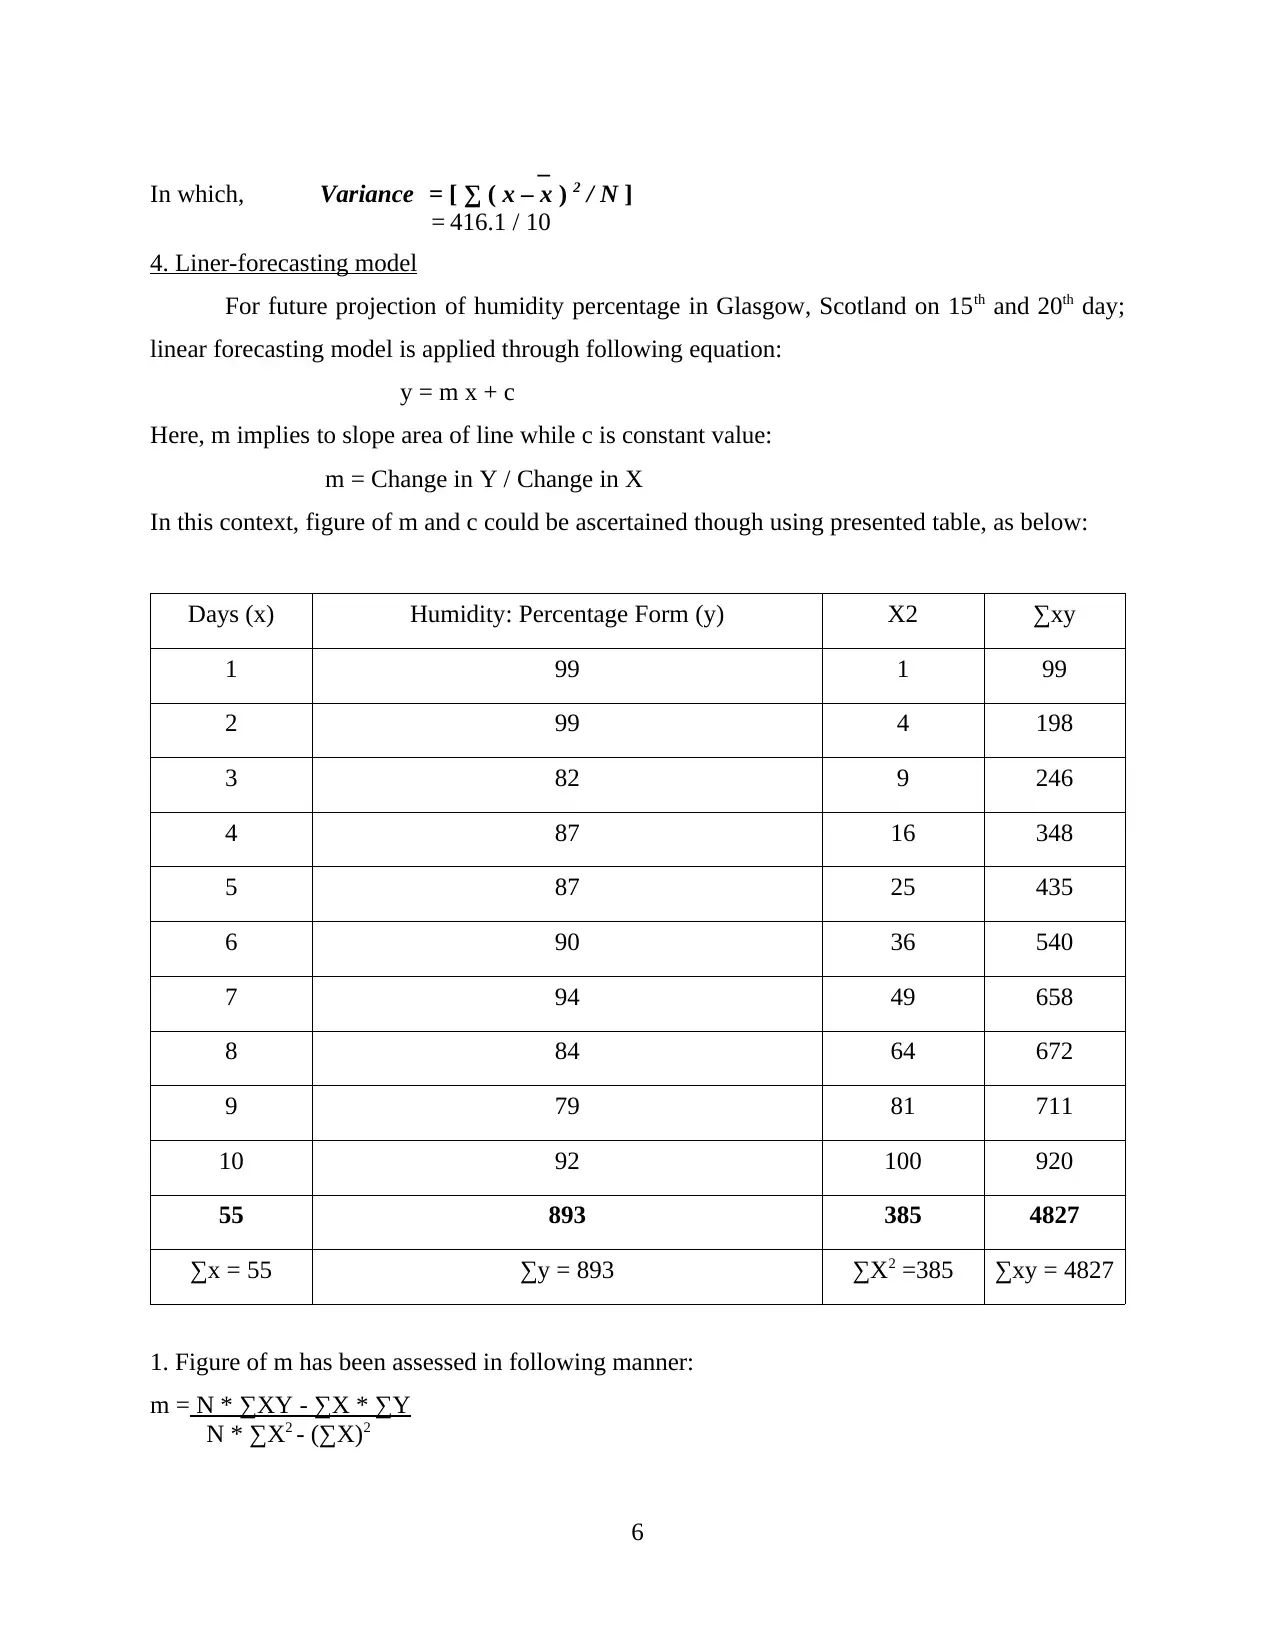
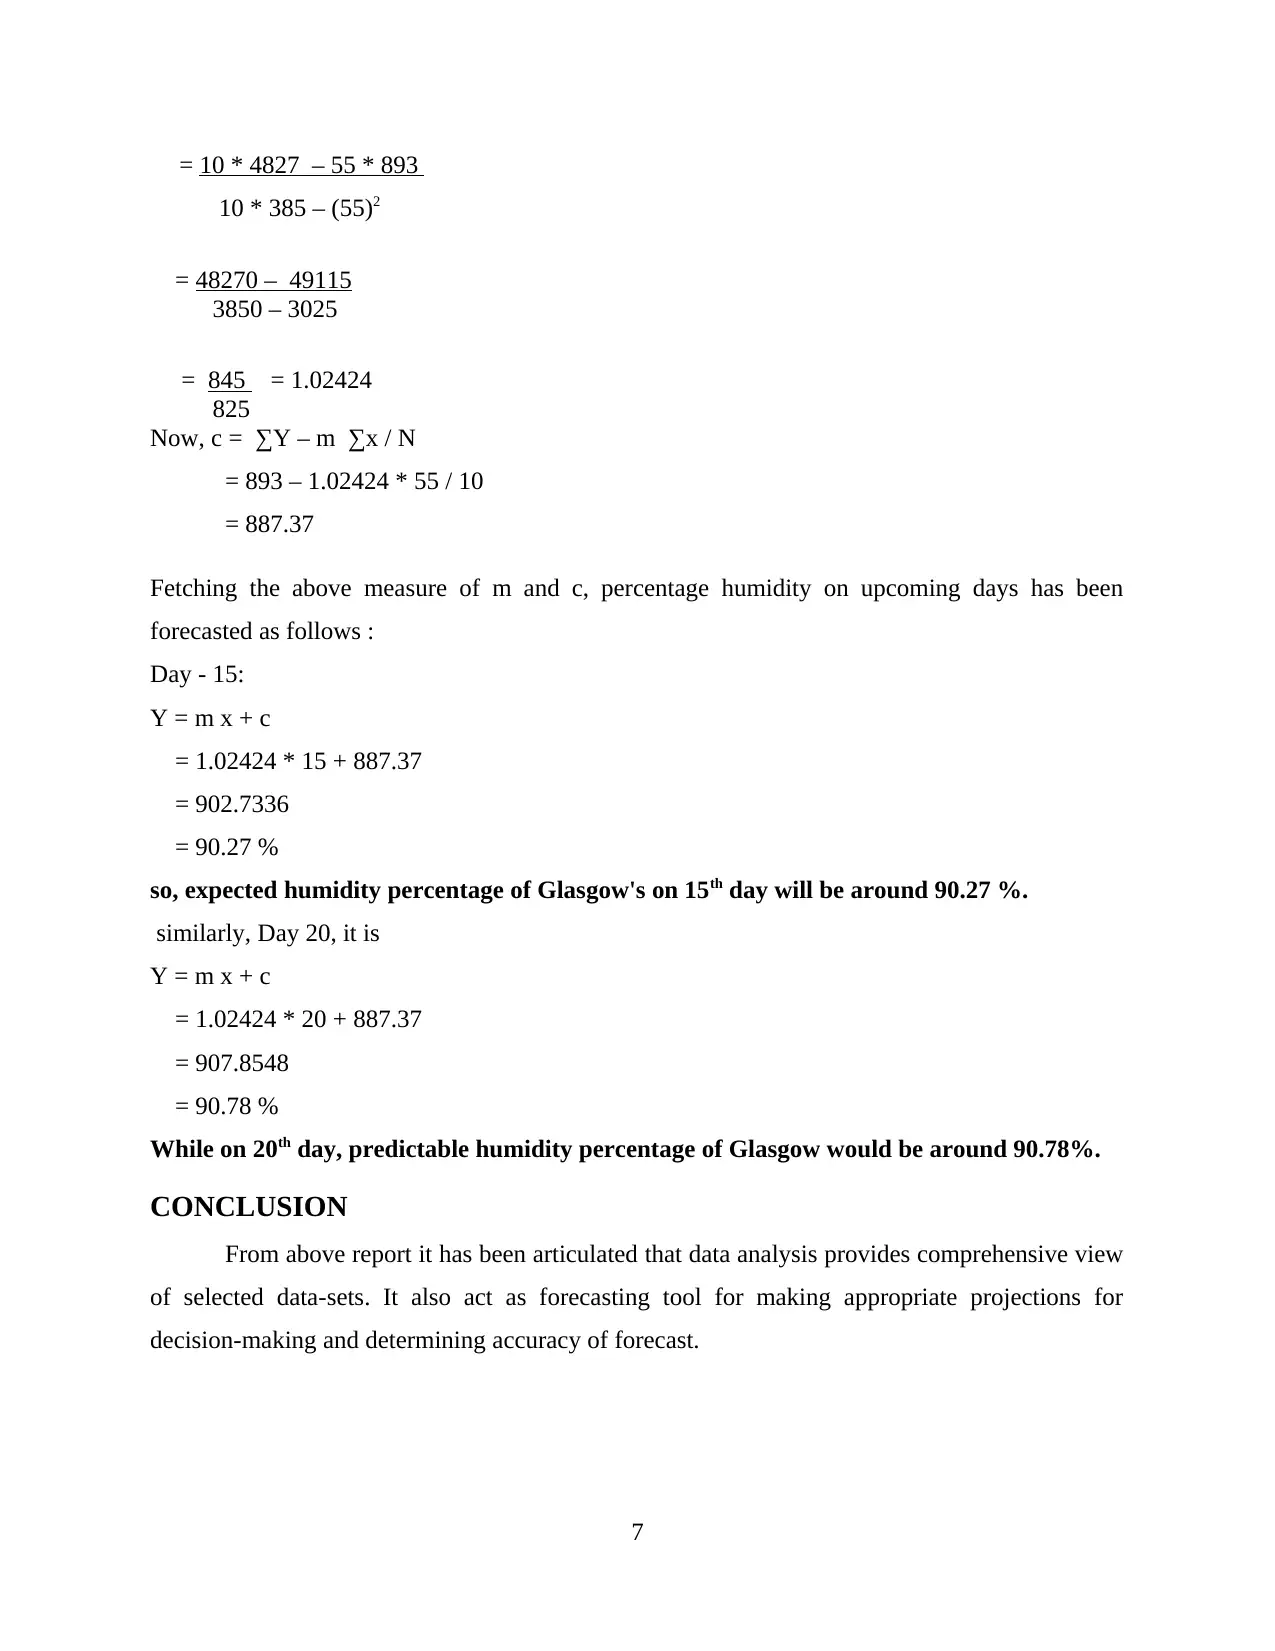
This assignment presents a comprehensive analysis of humidity data for Glasgow, Scotland, during December 2019. The analysis begins with a tabular and graphical representation of the data, followed by a detailed statistical analysis including the calculation of mean, median, mode, range, and standard deviation. Furthermore, the assignment employs a linear forecasting model to predict humidity percentages for the 15th and 20th days of the month. The calculations for the linear model, including the determination of the slope and intercept, are clearly demonstrated. The report concludes with the forecasted humidity percentages for the specified future dates, providing insights into potential humidity trends. The assignment highlights the application of statistical methods and forecasting techniques to real-world data.

Data Analysis
&
Forecasting
&
Forecasting
Paraphrase This Document
Need a fresh take? Get an instant paraphrase of this document with our AI Paraphraser

Table of Contents
INTRODUCTION...........................................................................................................................1
MAIN BODY .................................................................................................................................1
1. Table Representation...............................................................................................................1
2. Graphical Representation of Humidity Data:..........................................................................2
3. Calculation..............................................................................................................................3
4. Liner-forecasting model..........................................................................................................5
CONCLUSION................................................................................................................................6
REFERENCES................................................................................................................................7
.........................................................................................................................................................7

⊘ This is a preview!⊘
Do you want full access?
Subscribe today to unlock all pages.

Trusted by 1+ million students worldwide

INTRODUCTION
Data analysis relates to mechanism for reviewing, improving, remodelling, and sculpting
data with attempt of figuring crucial information, shedding light on assertions, and supporting
decision making. Data analysis generally implies to data interpretation system of introducing
rational and theoretical reasoning. It involves modelling, extracting and extracting certain raw
data elements to produce meaningful information (Wang and et. al., 2019).
This assessment includes presentation of data of 10 continuous days of Humidity of city
Glasgow, Scotland, UK in graphical and tabular form, and application of statistical measures.
Furthermore it contains the forecast of humidity at 15th and 20th day by computation of linear
forecasting model.
MAIN BODY
1. Table Representation
Here following is tabular presentation of data of humidity for continuous ten days of December:
2019, for Glasgow, Scotland, UK (December 2019 Weather in Glasgow. 2019), as follows:
Time Duration : 06:00 — 12:00
Date Humidity: Percentage Form
1 Dec 19 99
2 Dec 19 99
3 Dec 19 82
4 Dec 19 87
5 Dec 19 87
6 Dec 19 90
7 Dec 19 94
8 Dec 19 84
9 Dec 19 79
10 Dec 19 92
1
Paraphrase This Document
Need a fresh take? Get an instant paraphrase of this document with our AI Paraphraser

2. Graphical Representation of Humidity Data:
Bar Graph:
Column Chart:
2
1 Dec 19
2 Dec 19
3 Dec 19
4 Dec 19
5 Dec 19
6 Dec 19
7 Dec 19
8 Dec 19
9 Dec 19
10 Dec 19
0 10 20 30 40 50 60 70 80 90 100
Humidity: Percentage Form
Bar Graph:
Column Chart:
2
1 Dec 19
2 Dec 19
3 Dec 19
4 Dec 19
5 Dec 19
6 Dec 19
7 Dec 19
8 Dec 19
9 Dec 19
10 Dec 19
0 10 20 30 40 50 60 70 80 90 100
Humidity: Percentage Form

3. Calculation
Statistical analysis of Humidity of Glasgow
Time: 06:00 — 12:00
Days Humidity: Percentage Form for Each Day
1 Dec 19 99
2 Dec 19 99
3 Dec 19 82
4 Dec 19 87
5 Dec 19 87
6 Dec 19 90
7 Dec 19 94
8 Dec 19 84
9 Dec 19 79
10 Dec 19 92
3
1 Dec 19
2 Dec 19
3 Dec 19
4 Dec 19
5 Dec 19
6 Dec 19
7 Dec 19
8 Dec 19
9 Dec 19
10 Dec 19
0
10
20
30
40
50
60
70
80
90
100
Humidity: Percentage Form
⊘ This is a preview!⊘
Do you want full access?
Subscribe today to unlock all pages.

Trusted by 1+ million students worldwide

∑x (Sum Total) 893
Mean Value: 89.3
Median Value: 87
Mode Value: 87
Range Value: 20
Maximum Range Value 99
Minimum Range Value 79
Standard deviation 6.45
(i) Arithmetical Mean: This is value derived through simple average of data. A mean value of
data set presents central tendency of entire dataset and this makes summarization of outcomes
simpler (Madenci, Barut and Dorduncu, 2019).
Mean Value formula: Total sum of all the observation / No of total observations
__
or, Mean or X = ∑x / n
= 893 / 10
= 89.3
(ii) Median: It measures the top most middle value in selected observations or data. This is a
crucial measure which shows middle value/figure to provide a systematically summary of
results.
Median = (No. of observation + 1) / 2 , Where in case n is odd
or, Median = (No. of data) / 2 , Where in case n is even
In respective case, selected data is even so mean value will be 10 / 2 = 5th value which is
87 %.
(iii) Mode: This is most frequent value in given observations. This is easier to interpret result of
mode. In respective case mode, 87 % and 99 % are occurred two times but 87 is more closure to
mean value as assessed above. So, value of Mode is 87 %.
4
Paraphrase This Document
Need a fresh take? Get an instant paraphrase of this document with our AI Paraphraser

(iv) Range: This measure help to assess the boundaries of selected observations, by measuring
maximum and minimum range.
Range = Maximum data – Minimum data
Thus Range value would be = 99 % – 79 % = 20 %
(v) Standard Deviations: The standard deviation implies to function of the variance or
dispersion of observations. Lower value of a standard deviation reflects observation happen to be
correspondent to fixed mean. (Lamessa, 2019)
Dates
Humidity: Percentage
Form x- Mean (x- mean )2
1 Dec 19 99 9.7 94.09
2 Dec 19 99 9.7 94.09
3 Dec 19 82 -7.3 53.29
4 Dec 19 87 -2.3 5.29
5 Dec 19 87 -2.3 5.29
6 Dec 19 90 0.7 0.49
7 Dec 19 94 4.7 22.09
8 Dec 19 84 -5.3 28.09
9 Dec 19 79 -10.3 106.09
10 Dec 19 92 2.7 7.29
Total Sum = 416.1
Mean = 89.3
Variance = 41.61
Standard deviation = 6.45
Standard Deviation = √ ( Variance )
5

_
In which, Variance = [ ∑ ( x – x ) 2 / N ]
= 416.1 / 10
4. Liner-forecasting model
For future projection of humidity percentage in Glasgow, Scotland on 15th and 20th day;
linear forecasting model is applied through following equation:
y = m x + c
Here, m implies to slope area of line while c is constant value:
m = Change in Y / Change in X
In this context, figure of m and c could be ascertained though using presented table, as below:
Days (x) Humidity: Percentage Form (y) X2 ∑xy
1 99 1 99
2 99 4 198
3 82 9 246
4 87 16 348
5 87 25 435
6 90 36 540
7 94 49 658
8 84 64 672
9 79 81 711
10 92 100 920
55 893 385 4827
∑x = 55 ∑y = 893 ∑X2 =385 ∑xy = 4827
1. Figure of m has been assessed in following manner:
m = N * ∑XY - ∑X * ∑Y
N * ∑X2 - (∑X)2
6
⊘ This is a preview!⊘
Do you want full access?
Subscribe today to unlock all pages.

Trusted by 1+ million students worldwide

= 10 * 4827 – 55 * 893
10 * 385 – (55)2
= 48270 – 49115
3850 – 3025
= 845 = 1.02424
825
Now, c = ∑Y – m ∑x / N
= 893 – 1.02424 * 55 / 10
= 887.37
Fetching the above measure of m and c, percentage humidity on upcoming days has been
forecasted as follows :
Day - 15:
Y = m x + c
= 1.02424 * 15 + 887.37
= 902.7336
= 90.27 %
so, expected humidity percentage of Glasgow's on 15th day will be around 90.27 %.
similarly, Day 20, it is
Y = m x + c
= 1.02424 * 20 + 887.37
= 907.8548
= 90.78 %
While on 20th day, predictable humidity percentage of Glasgow would be around 90.78%.
CONCLUSION
From above report it has been articulated that data analysis provides comprehensive view
of selected data-sets. It also act as forecasting tool for making appropriate projections for
decision-making and determining accuracy of forecast.
7
Paraphrase This Document
Need a fresh take? Get an instant paraphrase of this document with our AI Paraphraser

REFERENCES
Books and Journals
Lamessa, T., 2019. Computational Data analysis of Fourıer Transformatıon by Numerical
experiments (Numerical CODE). International Journal For Research In Mathematics
And Statistics (ISSN: 2208-2662). 5(5). pp.01-13.
Madenci, E., Barut, A. and Dorduncu, M., 2019. Peridynamic differential operator for numerical
analysis. Springer International Publishing.
Wang, Y. and et. al., 2019. Test of a Weather-Adaptive Dual-Resolution Hybrid Warn-on-
Forecast Analysis and Forecast System for Several Severe Weather Events. Weather and
Forecasting. 34(6). pp.1807-1827.
Online
December 2019 Weather in Glasgow. 2019. [Online] Available Through:
<https://www.timeanddate.com/weather/uk/glasgow/historic?month=12&year=2019>.
8
1 out of 11
Related Documents

Your All-in-One AI-Powered Toolkit for Academic Success.
+13062052269
info@desklib.com
Available 24*7 on WhatsApp / Email
Unlock your academic potential
Copyright © 2020–2025 A2Z Services. All Rights Reserved. Developed and managed by ZUCOL.