Corporate Finance Case Study: GlaxoSmithKline Analysis

Verified

Added on  2019/12/18

|18
|4384
|155
Case Study
AI Summary
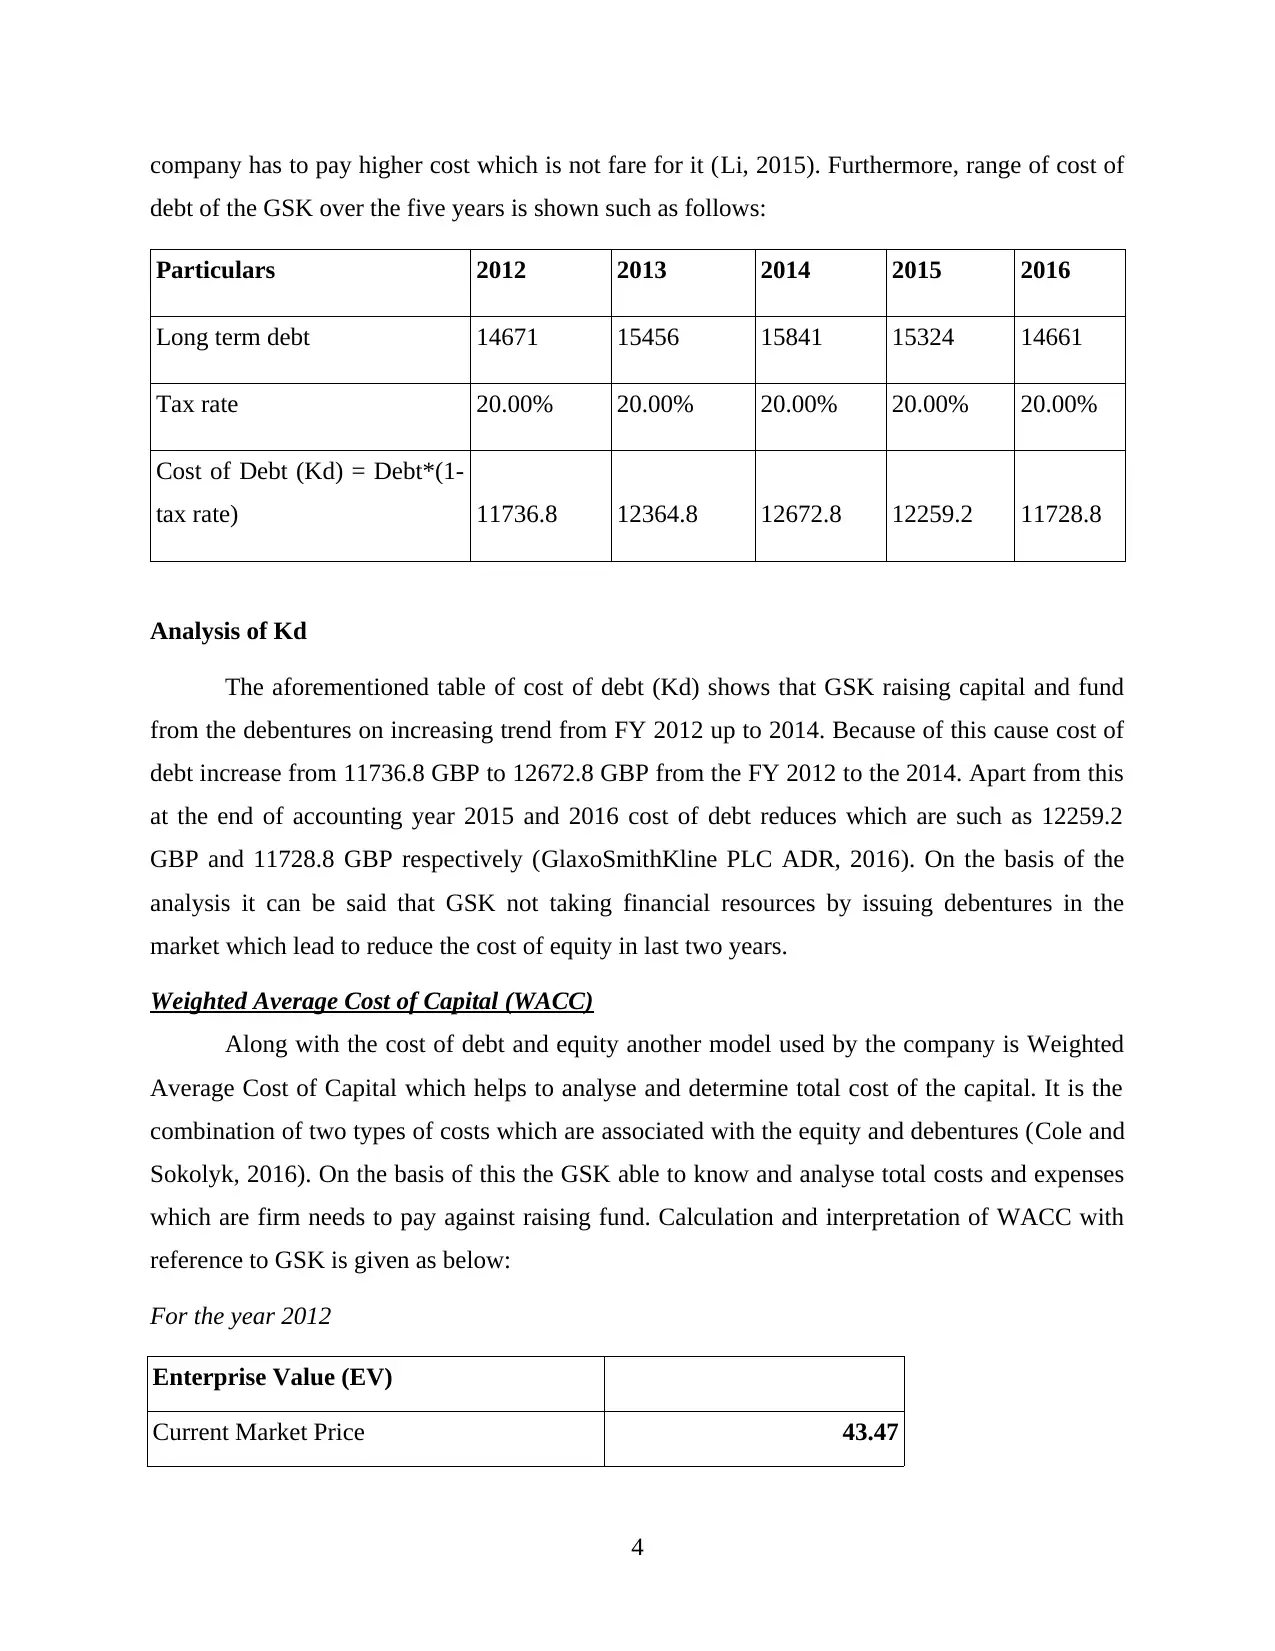
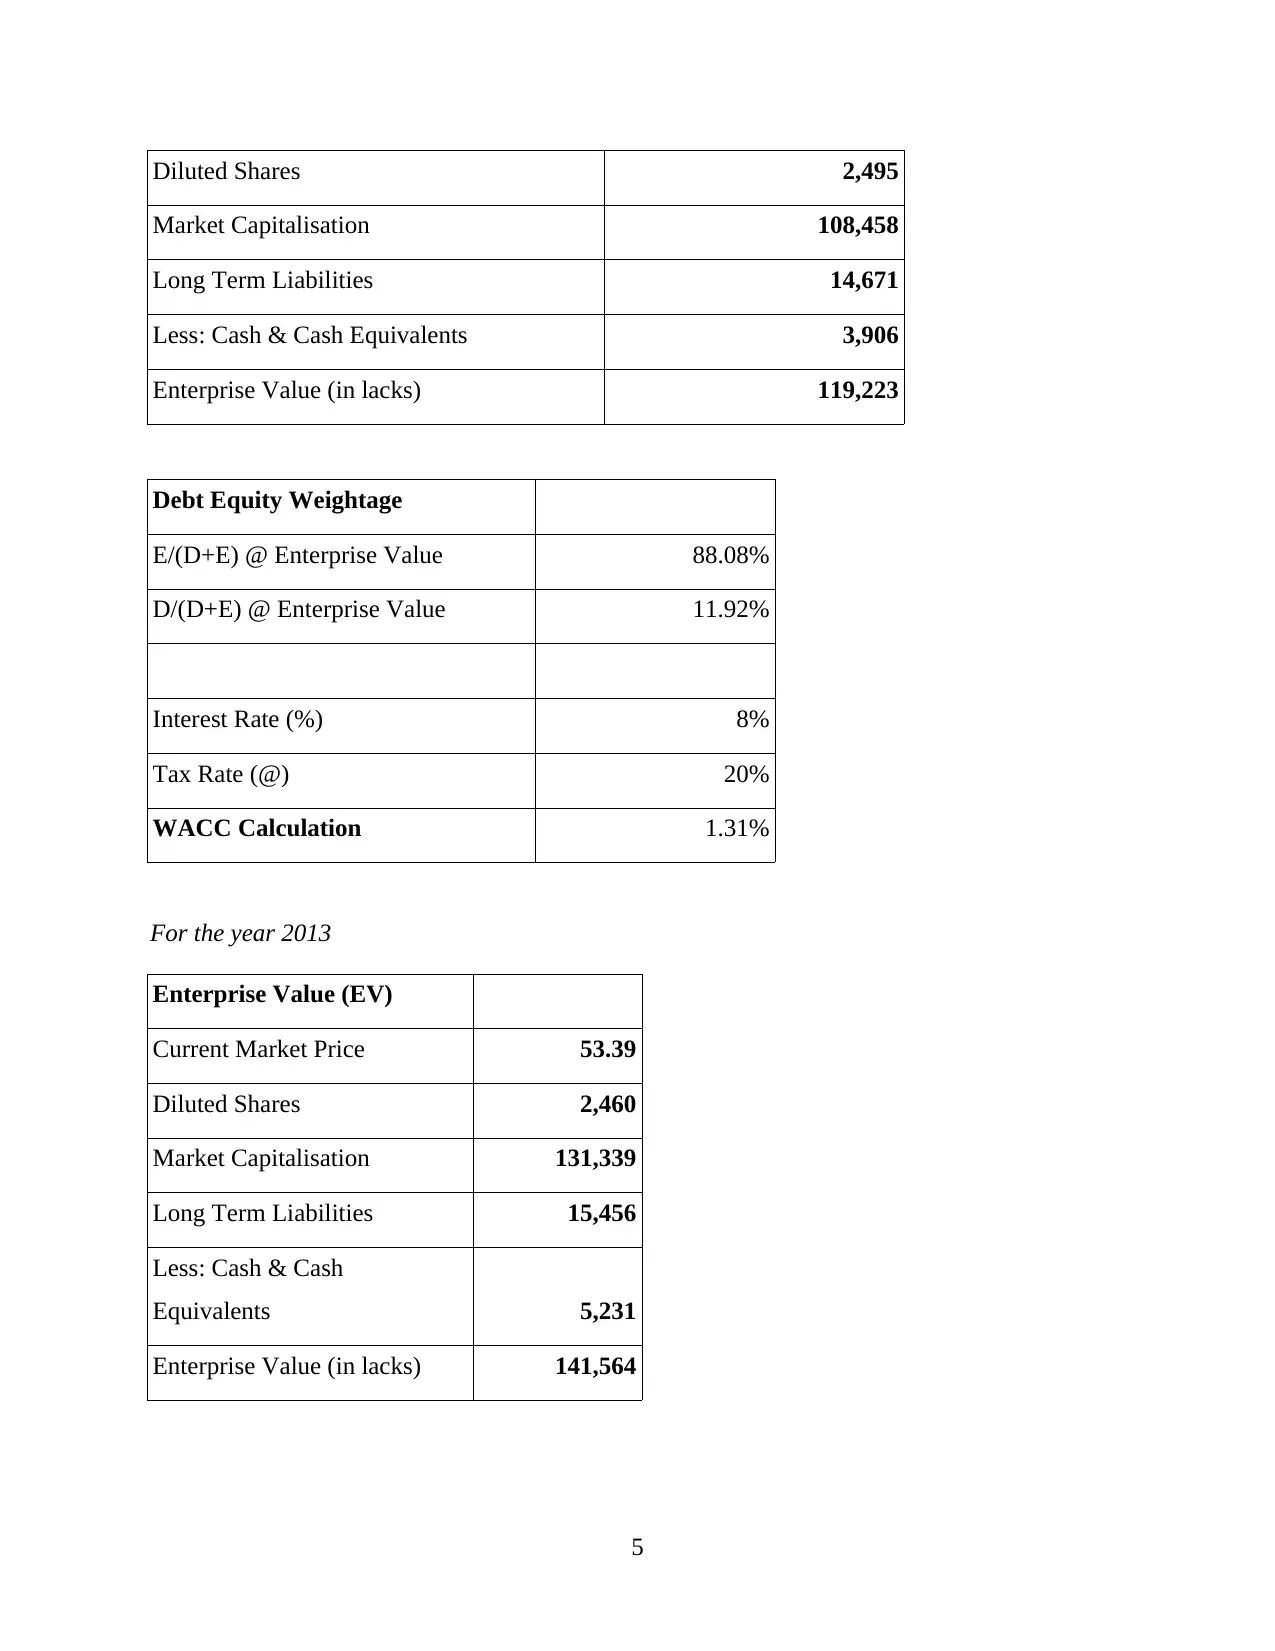
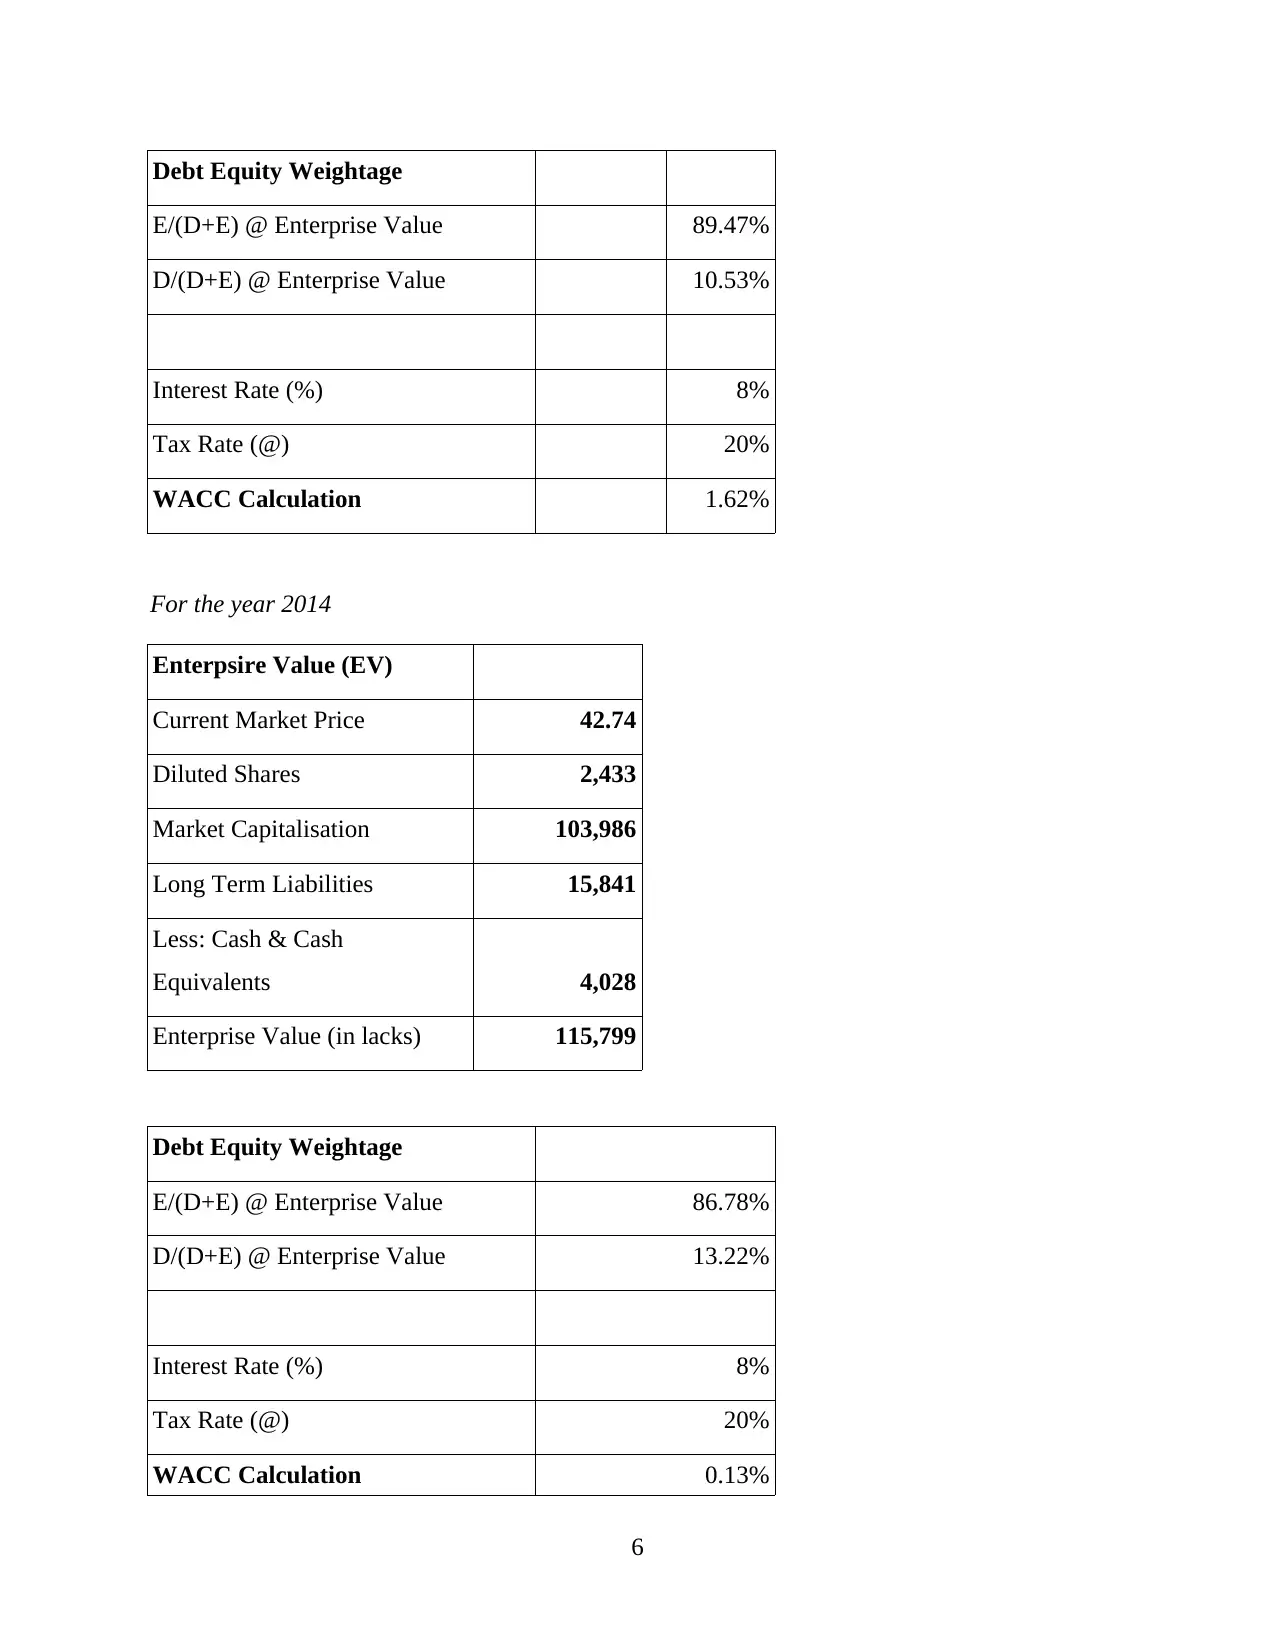
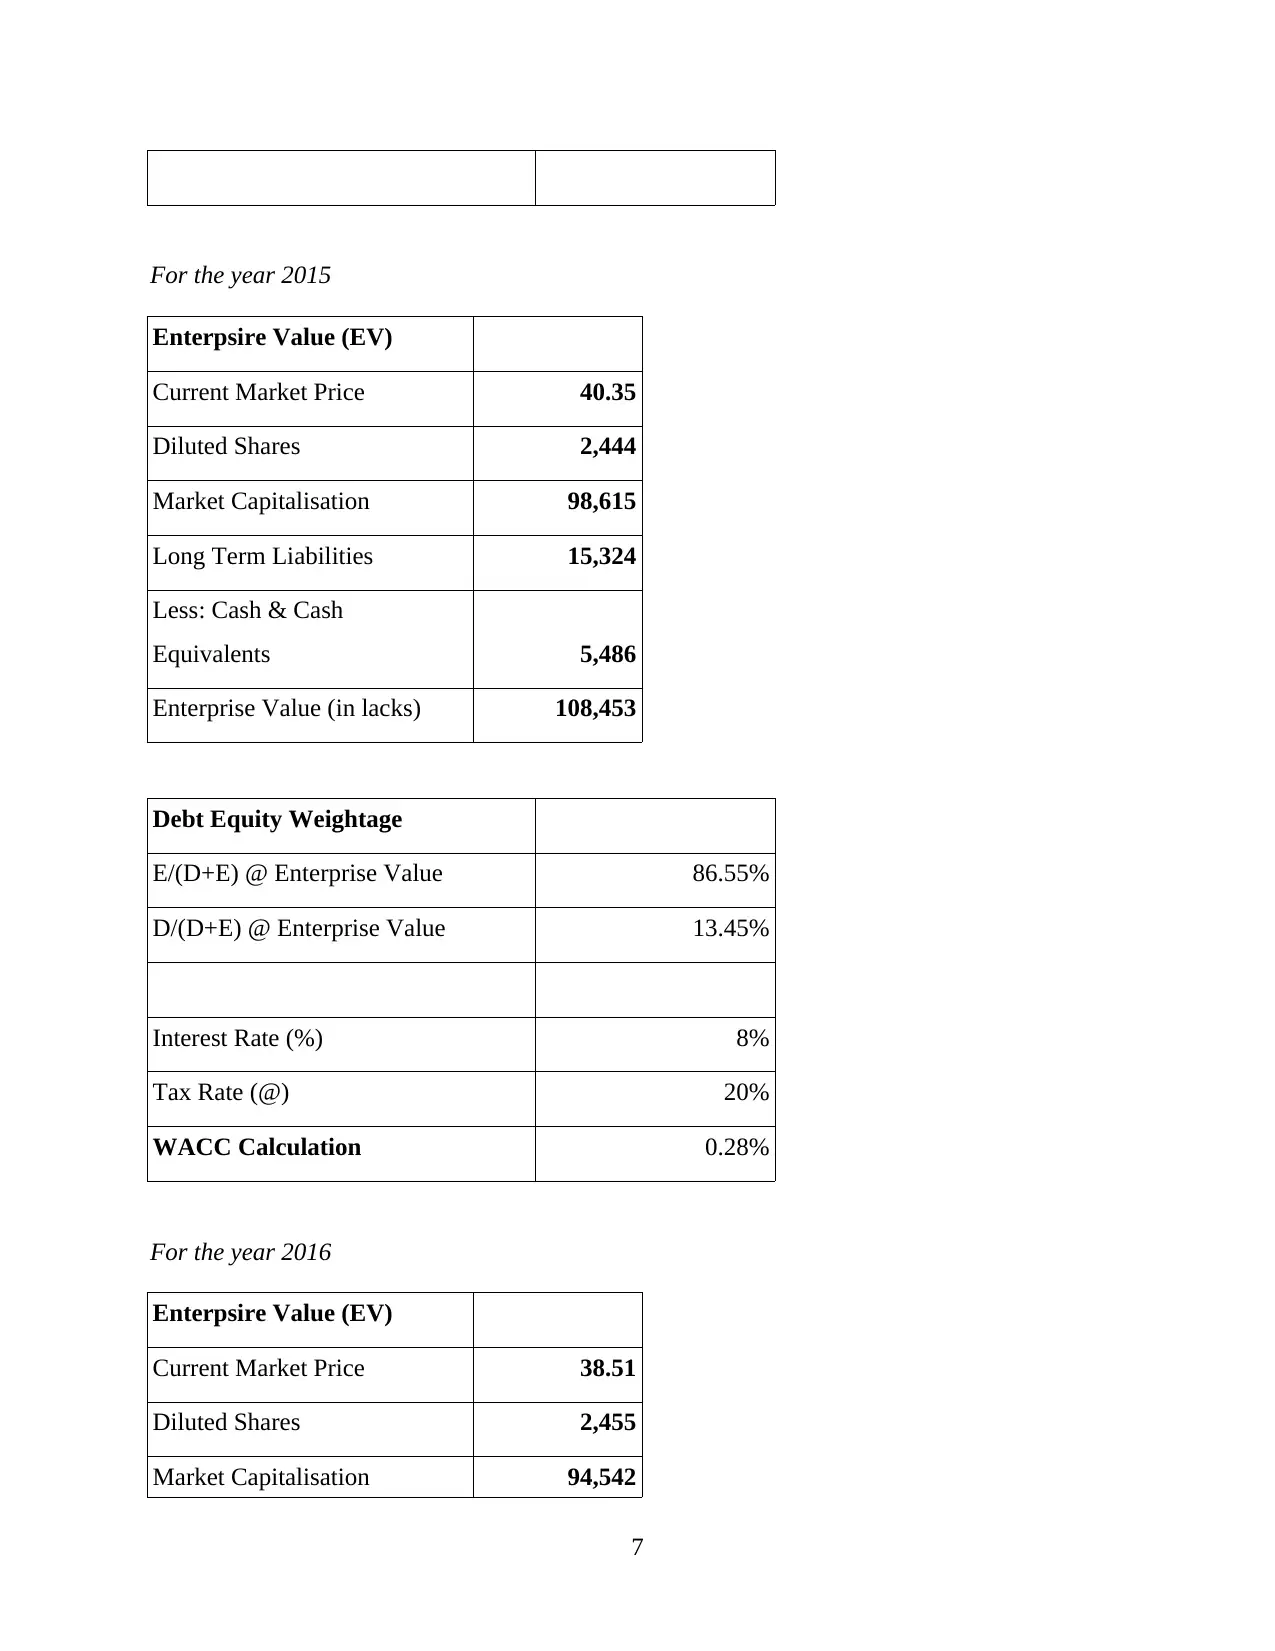
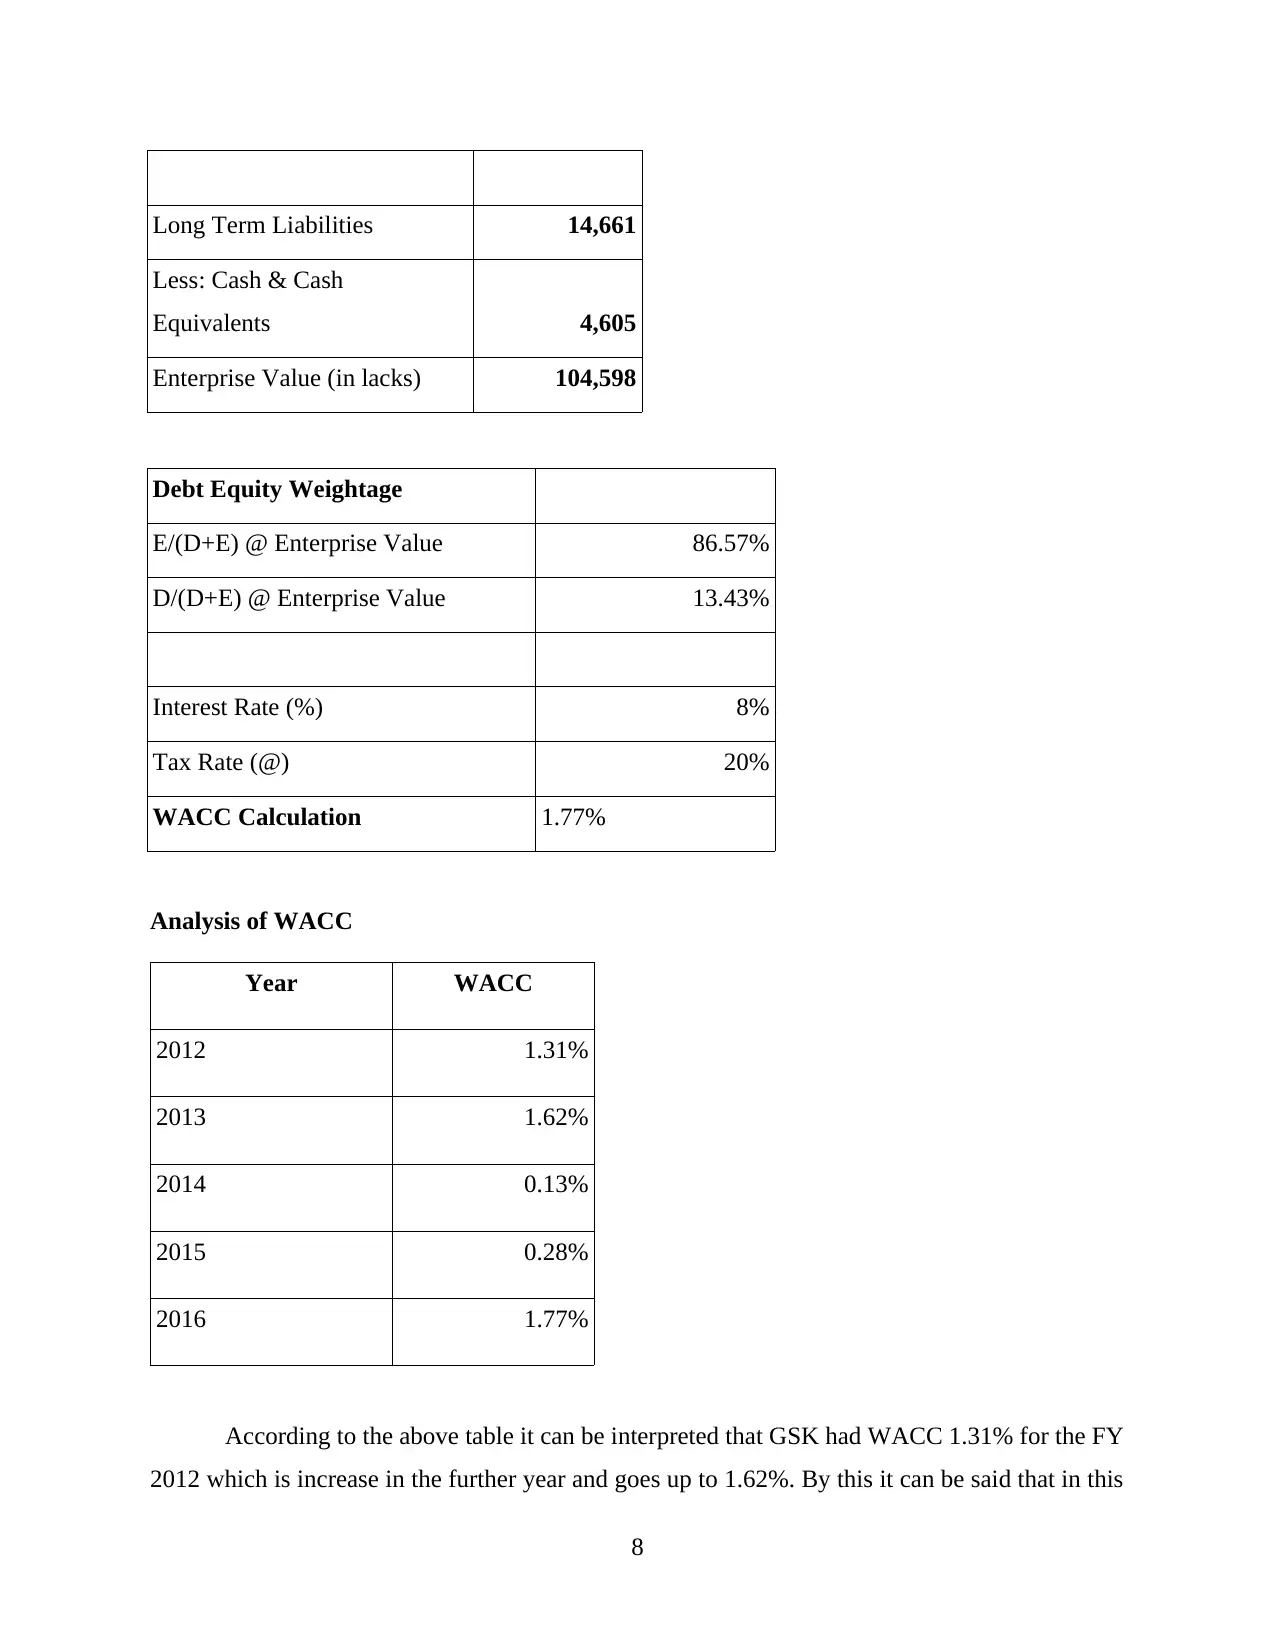
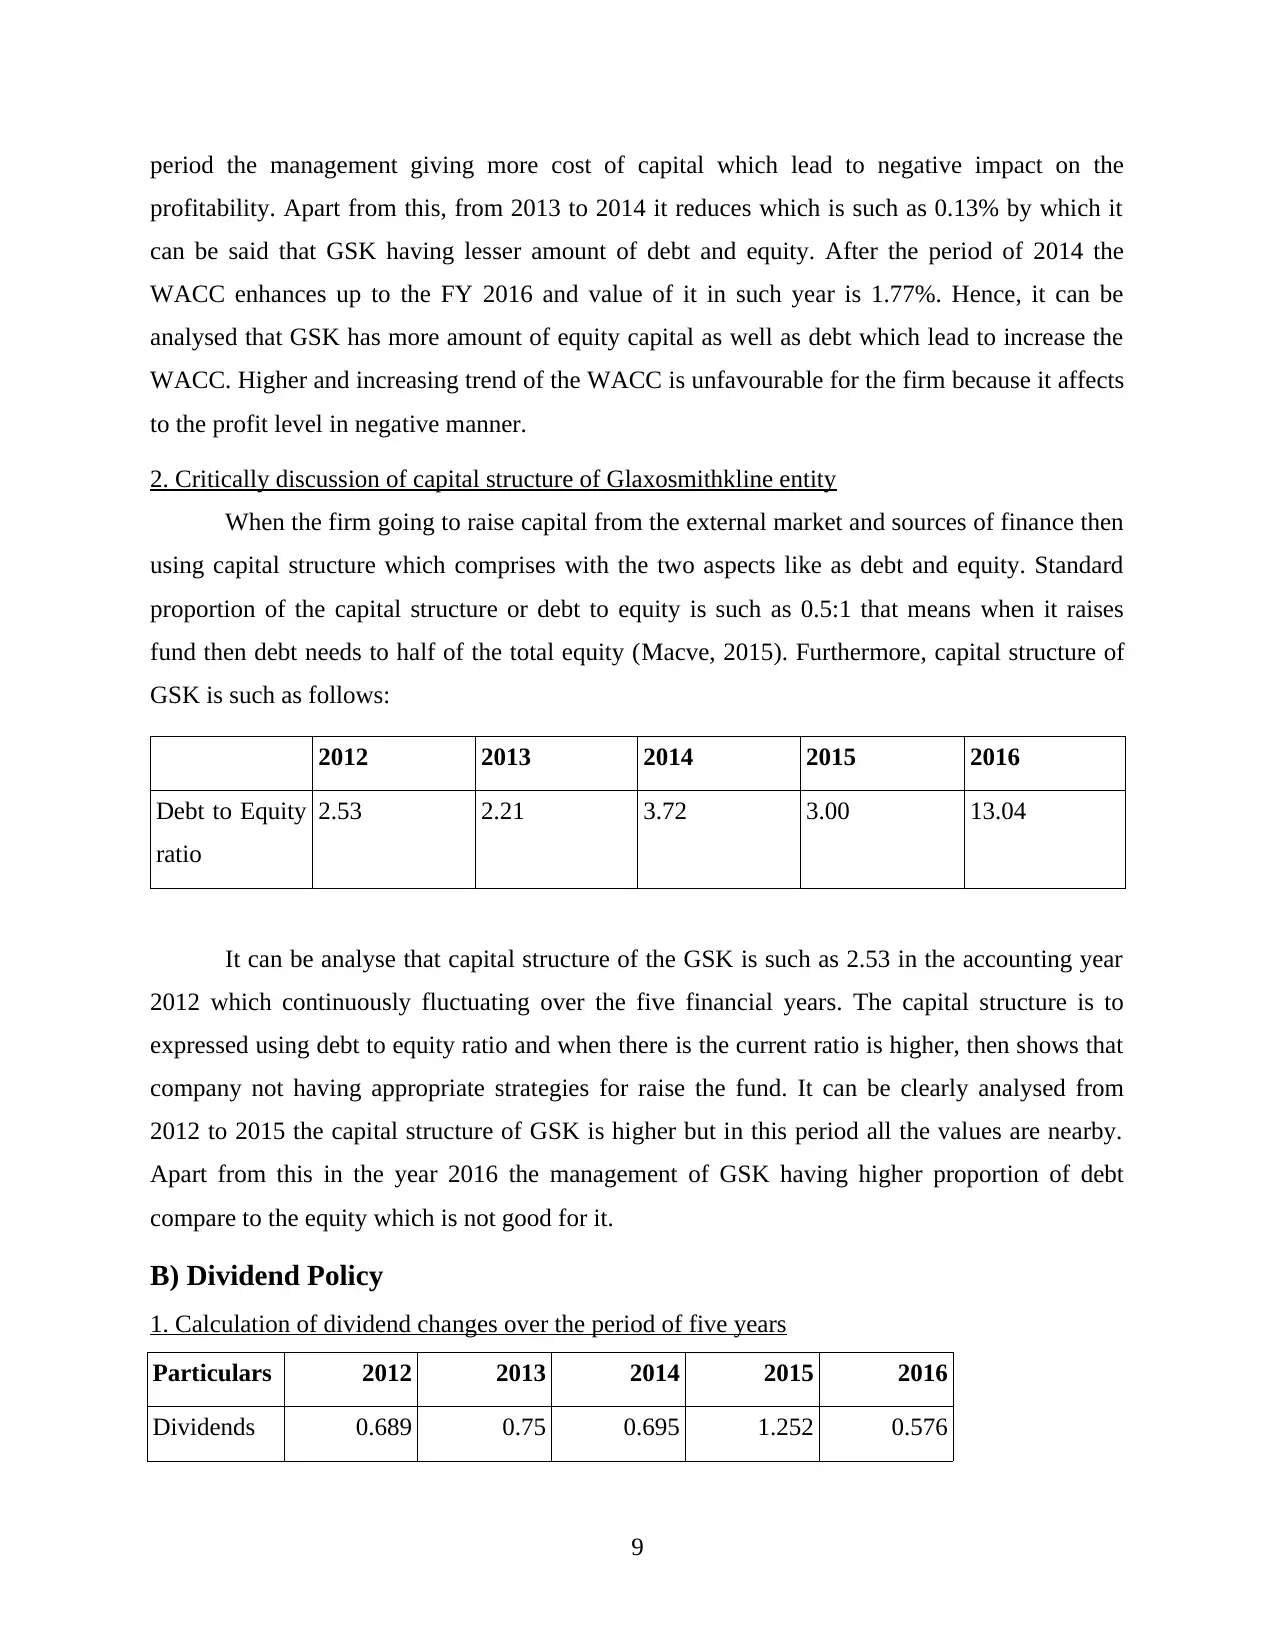
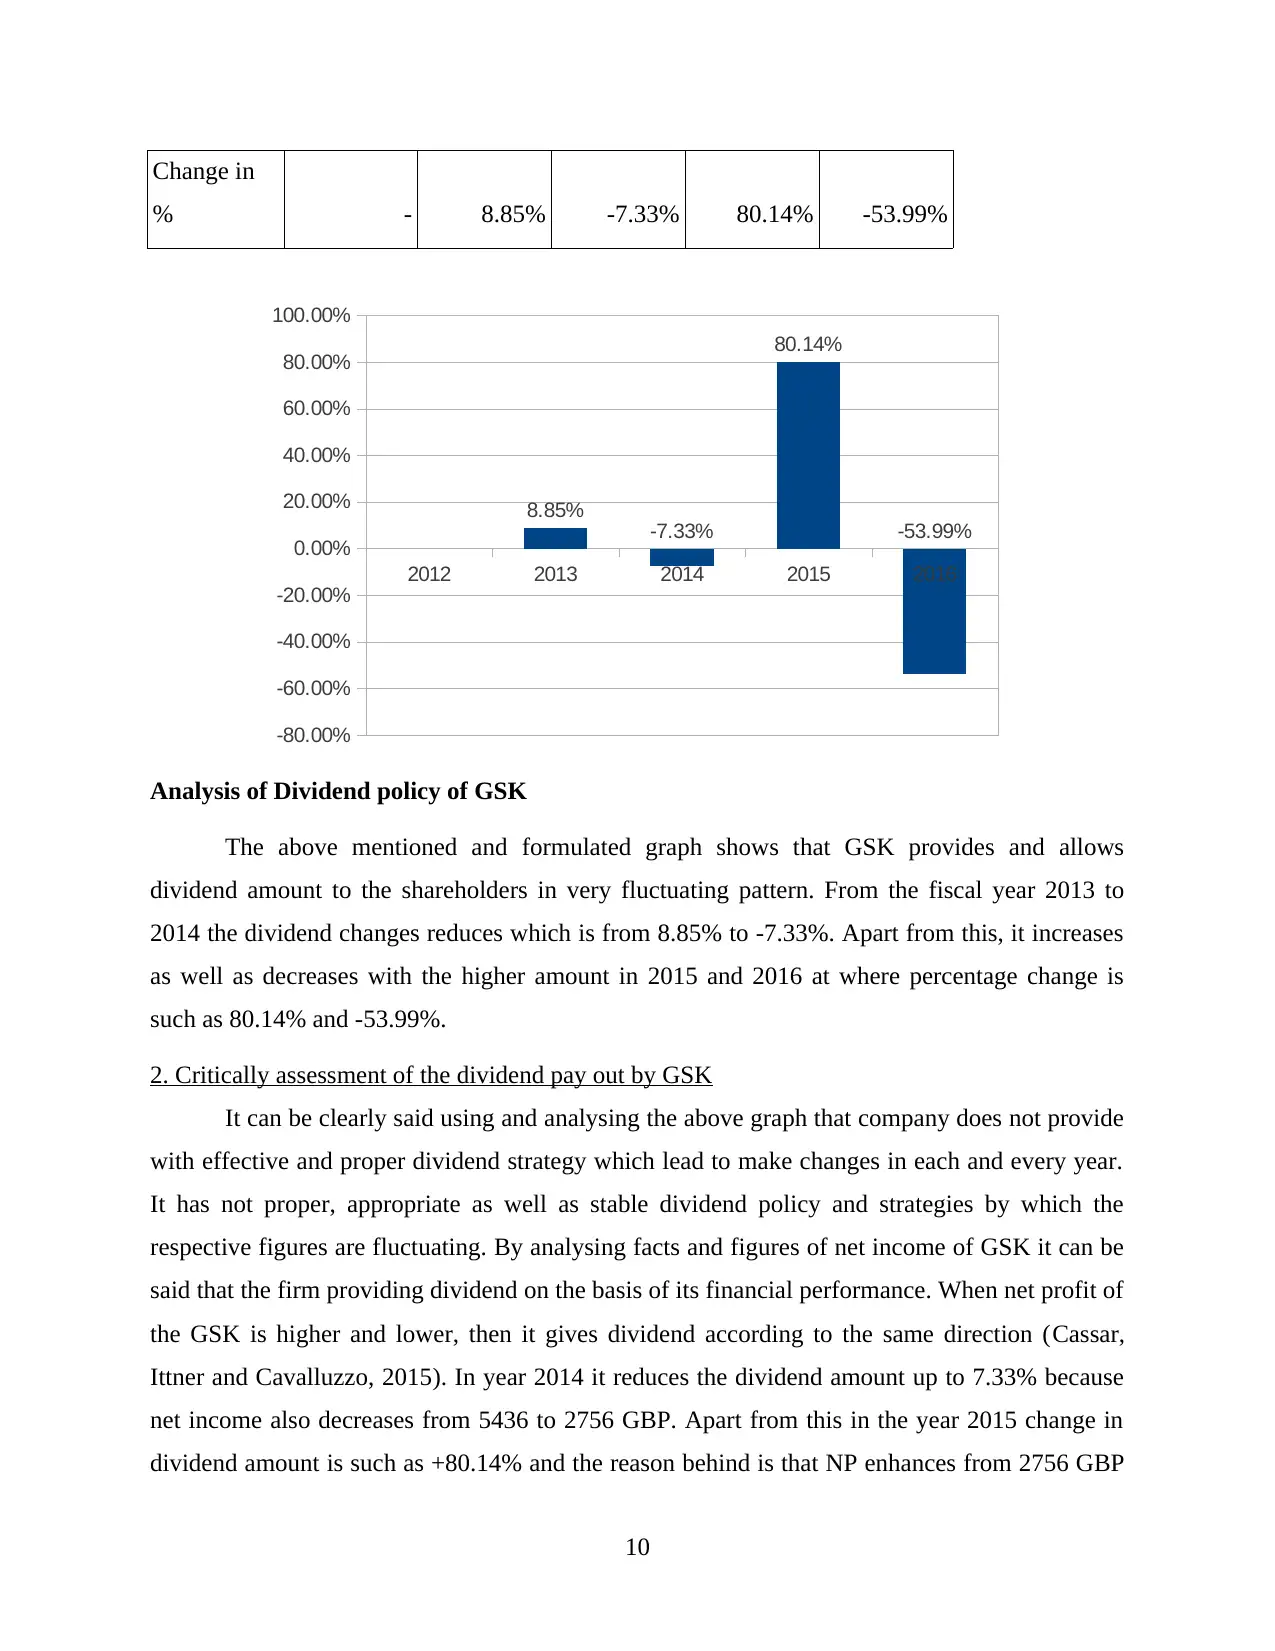
This case study examines the corporate financial strategy of GlaxoSmithKline (GSK), focusing on its discount rates, dividend policy, and capital structure. The analysis includes calculations of the cost of equity, cost of debt, and Weighted Average Cost of Capital (WACC) for GSK from 2012 to 2016, along with a critical discussion of its capital structure using debt-to-equity ratios. The study also assesses GSK's dividend policy, analyzing dividend changes over a five-year period and evaluating its dividend payout strategy. The report compares GSK's shareholder value performance with AstraZeneca (AZN) and utilizes various financial models and ratios to evaluate stock valuation and dividend strategies, providing insights into GSK's corporate life cycle and financial decision-making processes.
Document Page
CORPORATE
FINANCIAL STRATEGY
tabler-icon-diamond-filled.svg

Paraphrase This Document

Need a fresh take? Get an instant paraphrase of this document with our AI Paraphraser
Document Page
Document Page
INTRODUCTION
The area and aspect in which a company or an organisation deal with the different
financing sources as well as capital structure which are related to the financial department is
known as corporate finance. Apart from this in the corporate finance there are stock market
comes into consideration because it is the key part of every organisation which listed in
respective market. There are various number of strategies which are used in the corporate finance
for make it better and enhance level of profit. Further, the present case study is based on the
Glaxosmithkline (GSK) company which is operating in the Pharmaceutical, Consumer goods and
Biotechnology industry. Apart from this it is a public limited company and having global
presence. The current study shows about the discount rates, dividend policy as well as capital
structure of the GSK in context to the stock market. Beside this, the study describes about the
valuation of stock and dividend using different dividend ratios and models. Moreover, the study
helps to reader to analyse corporate life cycle of chosen firm using four aspects. At the end of
report, it describes about the shareholder value performance of the GSK and compare with the
AstraZeneca (AZN) company which operates in the same industry.
A) Discount Rates & Capital Structure
1. Calculation of Cost of Equity, Cost of Debt and Weighted Average Cost of Capital (WACC)
of Glaxosmithkline (GSK)
In the financing world there are different kinds of elements and available which helps to
management in order to assess its performance. When a business entity going to expand the firm
and enter in new market then it requires fund and capital which is provided by the several
sources of finance. Further, such all the financing sources imposes cost and charges in different
forms on the firm which uses its financing services. There are mainly two costs are analysed
using different formulas which are such as cost of equity and cost of debt. Moreover, cost of
equity associated with the equity financing while cost of debt associated with the debentures
which are denoted by Ke and Kd respectively (Jorda, Schularick and Taylor, 2016). On the basis
of such both the costs Weighted average cost of capital (WACC) is to determined of the firm.
Furthermore, Ke, Kd ad well as WACC of the GSK firm calculated and interpreted as below:
1
Document Page
Cost of Equity (Ke)
It is an aspect and cost related with equity financing which allow to the companies for
provide financial resources. Apart from this, it shows that the shareholder's required and
expected rate of return is up to which level behind investing money in GSK. On the basis of such
factor the management of firm analyse that how much expected return will be there with the
stockholders. It is explained along with calculation with reference to GSK as below:
For the year 2012
CAPM Assumptions 2012
K(e) 0.64%
RFR 1.0%
Beta 0.55
Rp 0.35%
For the year 2013
CAPM Assumptions
K(e) 1.09%
RFR 1.0%
Beta 0.46
Rp 1.19%
For the year 2014
CAPM Assumptions
K(e) -0.82%
RFR 1.0%
Beta 1.52
2
tabler-icon-diamond-filled.svg

Paraphrase This Document

Need a fresh take? Get an instant paraphrase of this document with our AI Paraphraser
Document Page
Rp -0.20%
For the year 2015
CAPM Assumptions
K(e) -0.71%
RFR 1.0%
Beta 1.27
Rp -0.35%
For the year 2016
CAPM Assumptions
K(e) 1.12%
RFR 1.0%
Beta 0.75
Rp 1.16%
Analysis of Ke
From the above tables of the cost of equity analysis it can be analysed that Ke of GSK
was 0.64% in the year 2012 which increase in the further year up to 1.09%. Afterwards it starts
to reduce and reaches up to -0.71% in an accounting period 2015 which is good for the GSK. In
the financial year 2016 it again increases from -0.71% to 1.12% which shows that the company
issues more amount of shares and provide dividend on it. It can be clearly said that required rate
of return of the GSK is fluctuating every accounting year and if it reduces then profitable for it.
Cost of Debt (Kd)
Apart from cost of equity there is cost of debt is also associated with the firm behind
taking and raising capital from debentures. When the firm has more amount of debt then
3
Document Page
company has to pay higher cost which is not fare for it (Li, 2015). Furthermore, range of cost of
debt of the GSK over the five years is shown such as follows:
Particulars 2012 2013 2014 2015 2016
Long term debt 14671 15456 15841 15324 14661
Tax rate 20.00% 20.00% 20.00% 20.00% 20.00%
Cost of Debt (Kd) = Debt*(1-
tax rate) 11736.8 12364.8 12672.8 12259.2 11728.8
Analysis of Kd
The aforementioned table of cost of debt (Kd) shows that GSK raising capital and fund
from the debentures on increasing trend from FY 2012 up to 2014. Because of this cause cost of
debt increase from 11736.8 GBP to 12672.8 GBP from the FY 2012 to the 2014. Apart from this
at the end of accounting year 2015 and 2016 cost of debt reduces which are such as 12259.2
GBP and 11728.8 GBP respectively (GlaxoSmithKline PLC ADR, 2016). On the basis of the
analysis it can be said that GSK not taking financial resources by issuing debentures in the
market which lead to reduce the cost of equity in last two years.
Weighted Average Cost of Capital (WACC)
Along with the cost of debt and equity another model used by the company is Weighted
Average Cost of Capital which helps to analyse and determine total cost of the capital. It is the
combination of two types of costs which are associated with the equity and debentures (Cole and
Sokolyk, 2016). On the basis of this the GSK able to know and analyse total costs and expenses
which are firm needs to pay against raising fund. Calculation and interpretation of WACC with
reference to GSK is given as below:
For the year 2012
Enterprise Value (EV)
Current Market Price 43.47
4
Document Page
Diluted Shares 2,495
Market Capitalisation 108,458
Long Term Liabilities 14,671
Less: Cash & Cash Equivalents 3,906
Enterprise Value (in lacks) 119,223
Debt Equity Weightage
E/(D+E) @ Enterprise Value 88.08%
D/(D+E) @ Enterprise Value 11.92%
Interest Rate (%) 8%
Tax Rate (@) 20%
WACC Calculation 1.31%
For the year 2013
Enterprise Value (EV)
Current Market Price 53.39
Diluted Shares 2,460
Market Capitalisation 131,339
Long Term Liabilities 15,456
Less: Cash & Cash
Equivalents 5,231
Enterprise Value (in lacks) 141,564
5
tabler-icon-diamond-filled.svg

Paraphrase This Document

Need a fresh take? Get an instant paraphrase of this document with our AI Paraphraser
Document Page
Debt Equity Weightage
E/(D+E) @ Enterprise Value 89.47%
D/(D+E) @ Enterprise Value 10.53%
Interest Rate (%) 8%
Tax Rate (@) 20%
WACC Calculation 1.62%
For the year 2014
Enterpsire Value (EV)
Current Market Price 42.74
Diluted Shares 2,433
Market Capitalisation 103,986
Long Term Liabilities 15,841
Less: Cash & Cash
Equivalents 4,028
Enterprise Value (in lacks) 115,799
Debt Equity Weightage
E/(D+E) @ Enterprise Value 86.78%
D/(D+E) @ Enterprise Value 13.22%
Interest Rate (%) 8%
Tax Rate (@) 20%
WACC Calculation 0.13%
6
Document Page
For the year 2015
Enterpsire Value (EV)
Current Market Price 40.35
Diluted Shares 2,444
Market Capitalisation 98,615
Long Term Liabilities 15,324
Less: Cash & Cash
Equivalents 5,486
Enterprise Value (in lacks) 108,453
Debt Equity Weightage
E/(D+E) @ Enterprise Value 86.55%
D/(D+E) @ Enterprise Value 13.45%
Interest Rate (%) 8%
Tax Rate (@) 20%
WACC Calculation 0.28%
For the year 2016
Enterpsire Value (EV)
Current Market Price 38.51
Diluted Shares 2,455
Market Capitalisation 94,542
7
Document Page
Long Term Liabilities 14,661
Less: Cash & Cash
Equivalents 4,605
Enterprise Value (in lacks) 104,598
Debt Equity Weightage
E/(D+E) @ Enterprise Value 86.57%
D/(D+E) @ Enterprise Value 13.43%
Interest Rate (%) 8%
Tax Rate (@) 20%
WACC Calculation 1.77%
Analysis of WACC
Year WACC
2012 1.31%
2013 1.62%
2014 0.13%
2015 0.28%
2016 1.77%
According to the above table it can be interpreted that GSK had WACC 1.31% for the FY
2012 which is increase in the further year and goes up to 1.62%. By this it can be said that in this
8
tabler-icon-diamond-filled.svg

Paraphrase This Document

Need a fresh take? Get an instant paraphrase of this document with our AI Paraphraser
Document Page
period the management giving more cost of capital which lead to negative impact on the
profitability. Apart from this, from 2013 to 2014 it reduces which is such as 0.13% by which it
can be said that GSK having lesser amount of debt and equity. After the period of 2014 the
WACC enhances up to the FY 2016 and value of it in such year is 1.77%. Hence, it can be
analysed that GSK has more amount of equity capital as well as debt which lead to increase the
WACC. Higher and increasing trend of the WACC is unfavourable for the firm because it affects
to the profit level in negative manner.
2. Critically discussion of capital structure of Glaxosmithkline entity
When the firm going to raise capital from the external market and sources of finance then
using capital structure which comprises with the two aspects like as debt and equity. Standard
proportion of the capital structure or debt to equity is such as 0.5:1 that means when it raises
fund then debt needs to half of the total equity (Macve, 2015). Furthermore, capital structure of
GSK is such as follows:
2012 2013 2014 2015 2016
Debt to Equity
ratio
2.53 2.21 3.72 3.00 13.04
It can be analyse that capital structure of the GSK is such as 2.53 in the accounting year
2012 which continuously fluctuating over the five financial years. The capital structure is to
expressed using debt to equity ratio and when there is the current ratio is higher, then shows that
company not having appropriate strategies for raise the fund. It can be clearly analysed from
2012 to 2015 the capital structure of GSK is higher but in this period all the values are nearby.
Apart from this in the year 2016 the management of GSK having higher proportion of debt
compare to the equity which is not good for it.
B) Dividend Policy
1. Calculation of dividend changes over the period of five years
Particulars 2012 2013 2014 2015 2016
Dividends 0.689 0.75 0.695 1.252 0.576
9
Document Page
Change in
% - 8.85% -7.33% 80.14% -53.99%
2012 2013 2014 2015 2016
-80.00%
-60.00%
-40.00%
-20.00%
0.00%
20.00%
40.00%
60.00%
80.00%
100.00%
8.85% -7.33%
80.14%
-53.99%
Analysis of Dividend policy of GSK
The above mentioned and formulated graph shows that GSK provides and allows
dividend amount to the shareholders in very fluctuating pattern. From the fiscal year 2013 to
2014 the dividend changes reduces which is from 8.85% to -7.33%. Apart from this, it increases
as well as decreases with the higher amount in 2015 and 2016 at where percentage change is
such as 80.14% and -53.99%.
2. Critically assessment of the dividend pay out by GSK
It can be clearly said using and analysing the above graph that company does not provide
with effective and proper dividend strategy which lead to make changes in each and every year.
It has not proper, appropriate as well as stable dividend policy and strategies by which the
respective figures are fluctuating. By analysing facts and figures of net income of GSK it can be
said that the firm providing dividend on the basis of its financial performance. When net profit of
the GSK is higher and lower, then it gives dividend according to the same direction (Cassar,
Ittner and Cavalluzzo, 2015). In year 2014 it reduces the dividend amount up to 7.33% because
net income also decreases from 5436 to 2756 GBP. Apart from this in the year 2015 change in
dividend amount is such as +80.14% and the reason behind is that NP enhances from 2756 GBP
10
chevron_up_icon
1 out of 18
circle_padding
hide_on_mobile
zoom_out_icon
[object Object]