CM Project: Market Analysis of GSK, Pfizer, and AstraZeneca Companies
VerifiedAdded on 2020/07/23
|19
|3398
|63
Report
AI Summary
This report provides a comprehensive analysis of GlaxoSmithKline (GSK), Pfizer, and AstraZeneca (AZN), focusing on the pharmaceutical industry. It begins with an industry analysis, examining market sectors, competitors (including Pfizer and AZN), and strategic alliances. The market analysis delves into market capitalization trends, comparing the financial performance of the three companies from 2012 to 2017. The report then investigates the companies' performance metrics, including earnings per share (EPS), share price fluctuations, and share price history. It also covers shares outstanding and debentures, providing a detailed financial overview. The analysis highlights key financial data, strategic moves, and market positions of each company, offering valuable insights into the competitive landscape of the pharmaceutical sector, with a focus on how GSK, Pfizer, and AZN compare in terms of financial health and market capitalization. The report uses data from 2012 to 2017 to provide a comprehensive overview of the companies' performances and market positions.

CM Project
Paraphrase This Document
Need a fresh take? Get an instant paraphrase of this document with our AI Paraphraser
Table of Contents
4.0 INDUSTRY ANALYSIS..........................................................................................................1
4.1 Market sector....................................................................................................................1
4.2 Competitors......................................................................................................................3
4.3 Strategic alliances.............................................................................................................5
5.0 MARKET ANALYSIS..............................................................................................................5
5.1 Market capitalization........................................................................................................6
5.2 Market segmentation........................................................................................................9
6.0 PERFORMANCE....................................................................................................................11
6.1 Earnings per share..........................................................................................................11
6.2 Share price......................................................................................................................12
6.3 Share price history..........................................................................................................13
6.4 Shares outstanding..........................................................................................................14
6.5 Debentures and other loans outstanding.........................................................................15
REFERENCES..............................................................................................................................17
4.0 INDUSTRY ANALYSIS
4.1 Market sector
Glaxosmith Kline (GSK) is a UK based pharmaceutical company that is headquartered in
Brentford, London. It was established by the merger of SmithKline Beecham and Glaxo
Wellcome in the year 2000. It is primary listed on the London Stock Exchange with constituents
of FTSE 100 Index while secondary listing is on New York Stock Exchange (NYSE). It operates
in pharmaceutical industry of UK which mission is to provide qualify life to all so that people
feel better and live a healthier life. It operates in three segment; pharmaceutical, vaccines and
consumer healthcare business with an employee portfolio of 99,300.
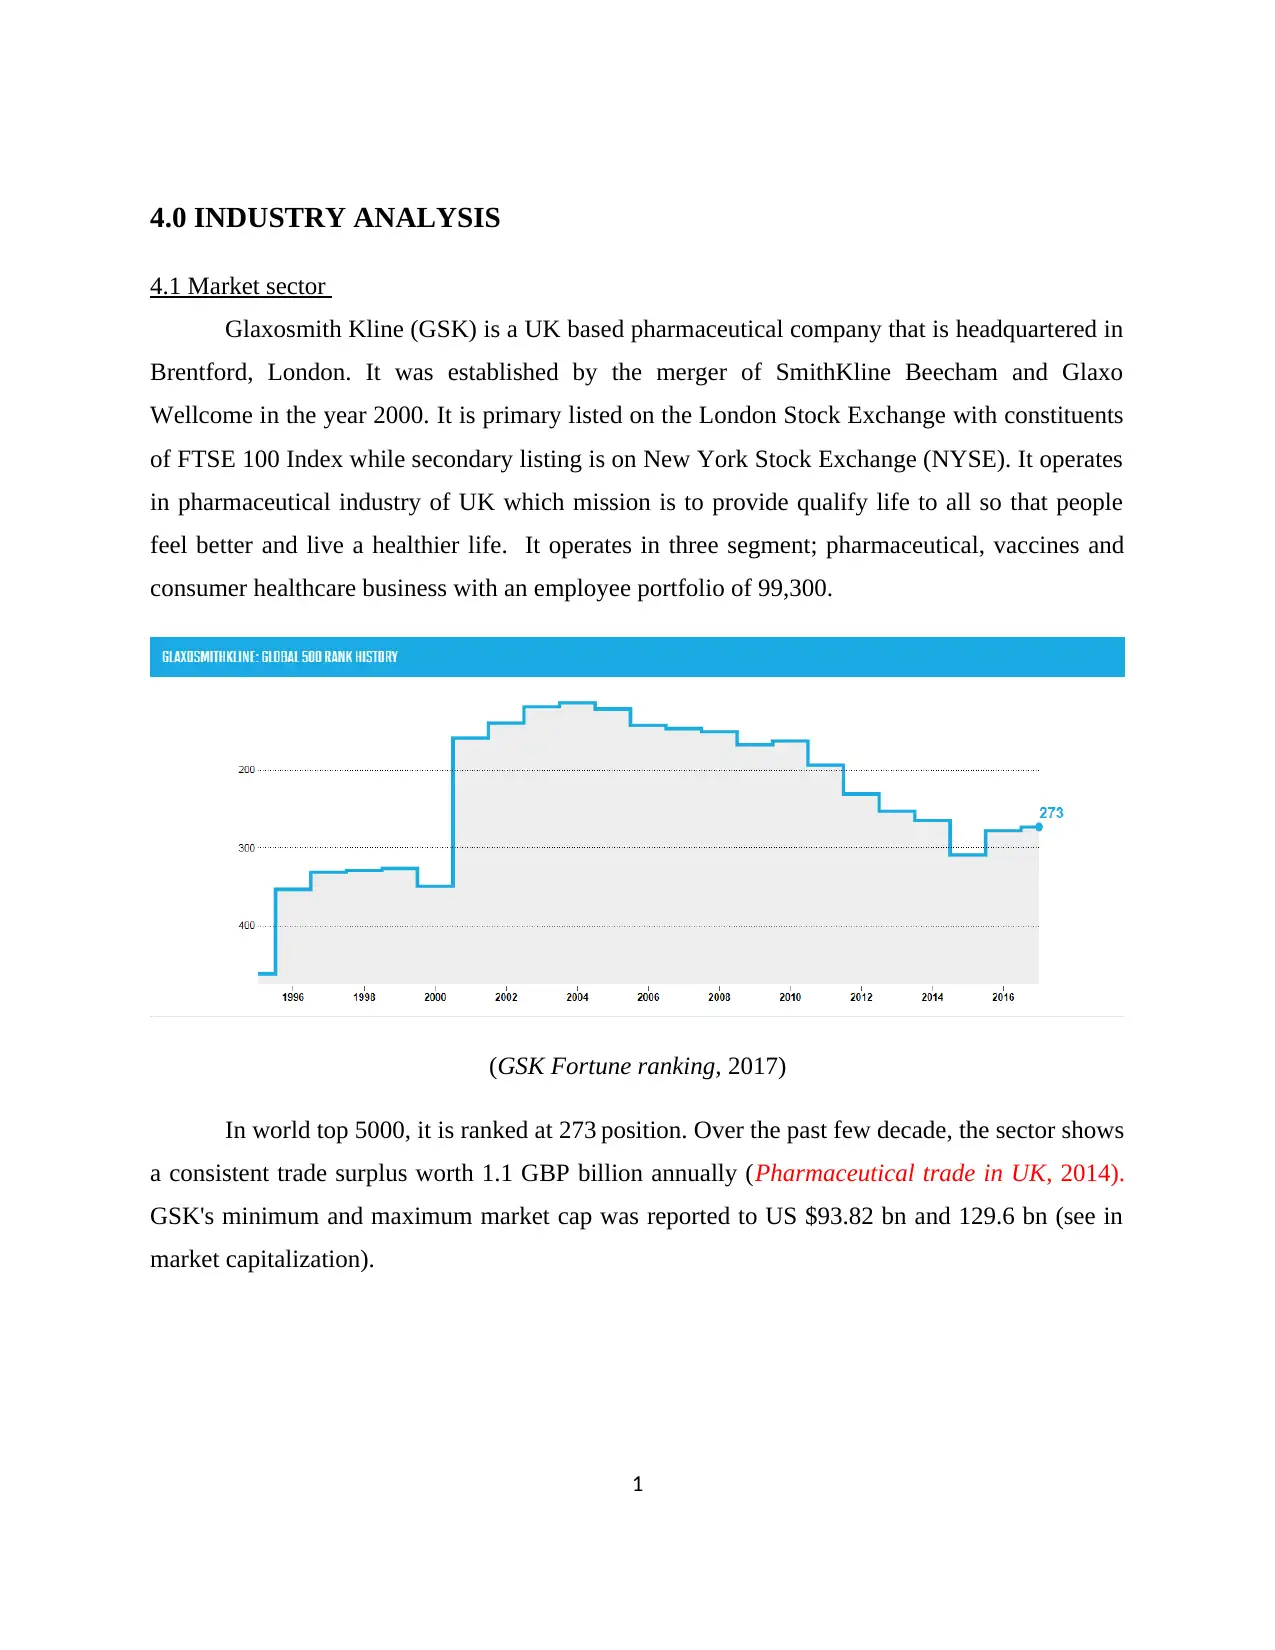
(GSK Fortune ranking, 2017)
In world top 5000, it is ranked at 273 position. Over the past few decade, the sector shows
a consistent trade surplus worth 1.1 GBP billion annually (Pharmaceutical trade in UK, 2014).
GSK's minimum and maximum market cap was reported to US $93.82 bn and 129.6 bn (see in
market capitalization).
1
4.1 Market sector
Glaxosmith Kline (GSK) is a UK based pharmaceutical company that is headquartered in
Brentford, London. It was established by the merger of SmithKline Beecham and Glaxo
Wellcome in the year 2000. It is primary listed on the London Stock Exchange with constituents
of FTSE 100 Index while secondary listing is on New York Stock Exchange (NYSE). It operates
in pharmaceutical industry of UK which mission is to provide qualify life to all so that people
feel better and live a healthier life. It operates in three segment; pharmaceutical, vaccines and
consumer healthcare business with an employee portfolio of 99,300.
(GSK Fortune ranking, 2017)
In world top 5000, it is ranked at 273 position. Over the past few decade, the sector shows
a consistent trade surplus worth 1.1 GBP billion annually (Pharmaceutical trade in UK, 2014).
GSK's minimum and maximum market cap was reported to US $93.82 bn and 129.6 bn (see in
market capitalization).
1
⊘ This is a preview!⊘
Do you want full access?
Subscribe today to unlock all pages.
Trusted by 1+ million students worldwide
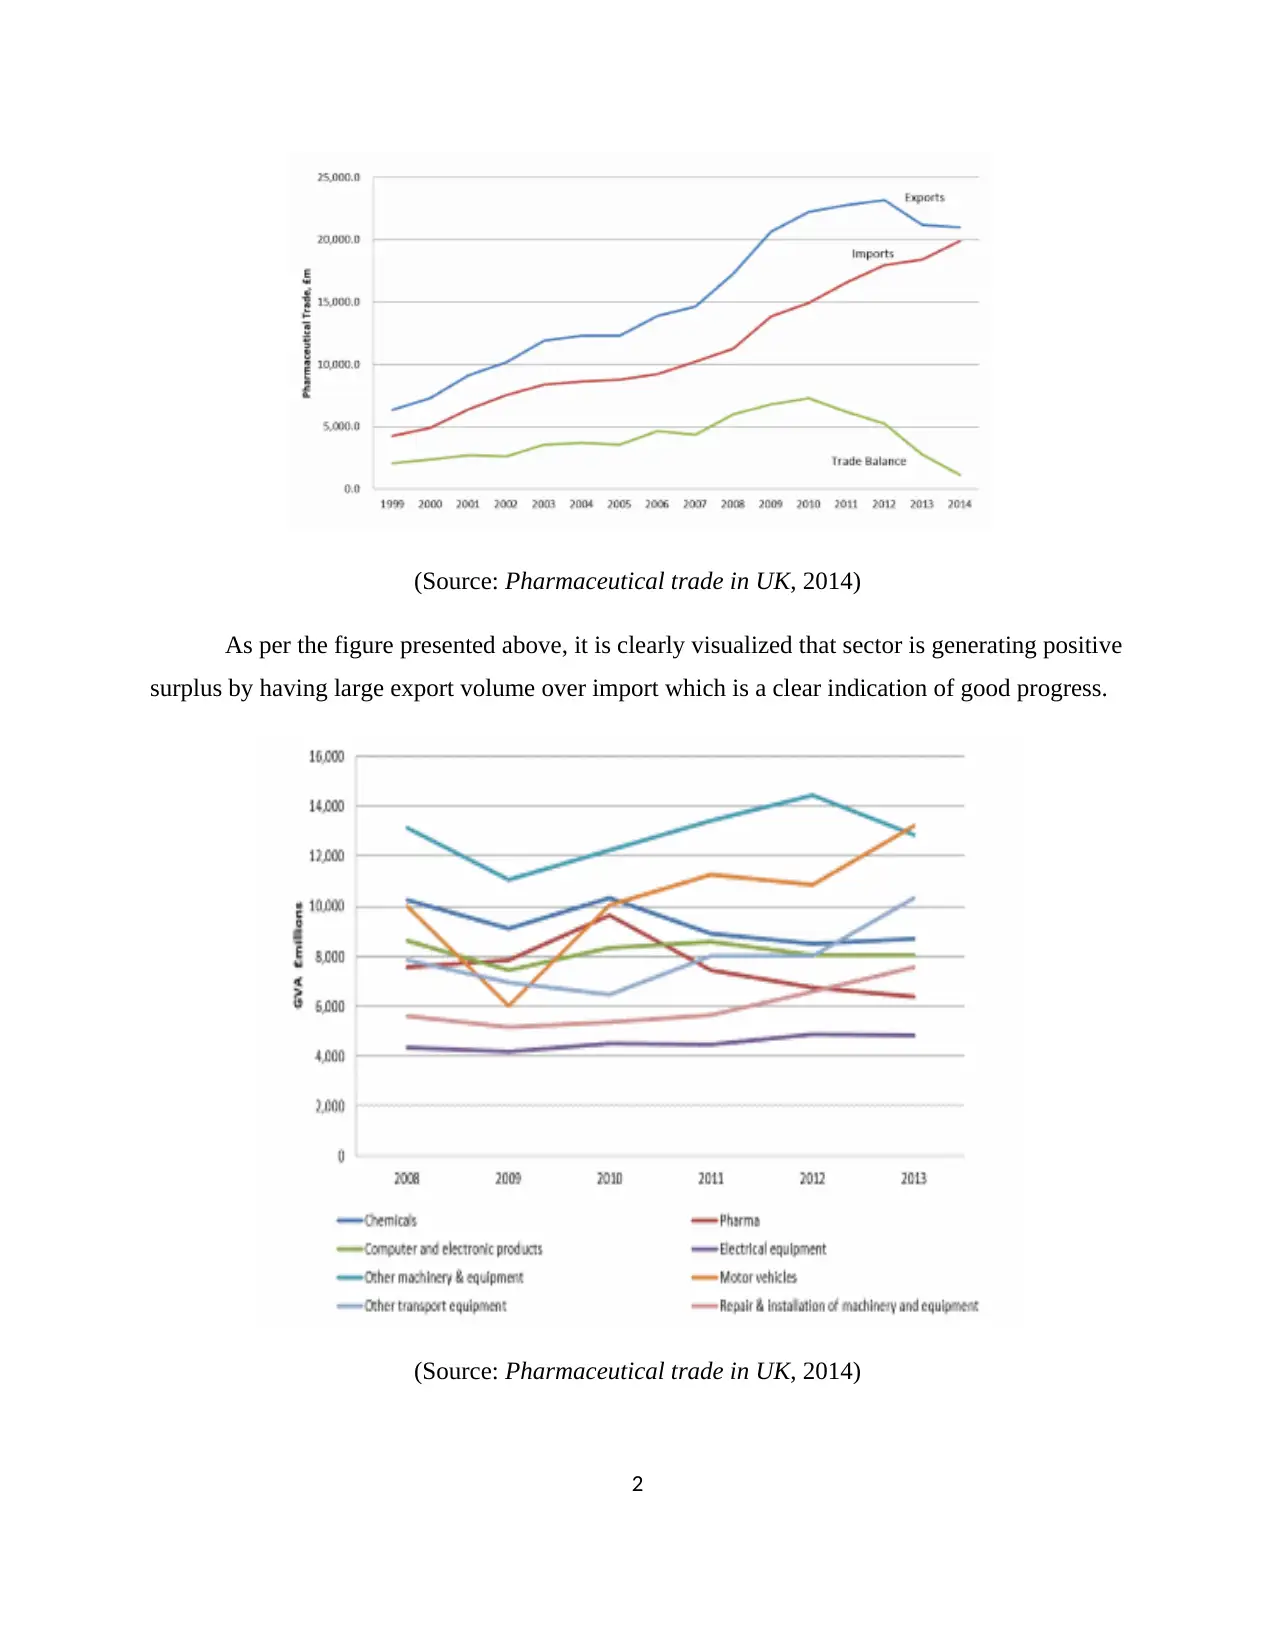
(Source: Pharmaceutical trade in UK, 2014)
As per the figure presented above, it is clearly visualized that sector is generating positive
surplus by having large export volume over import which is a clear indication of good progress.
(Source: Pharmaceutical trade in UK, 2014)
2
As per the figure presented above, it is clearly visualized that sector is generating positive
surplus by having large export volume over import which is a clear indication of good progress.
(Source: Pharmaceutical trade in UK, 2014)
2
Paraphrase This Document
Need a fresh take? Get an instant paraphrase of this document with our AI Paraphraser
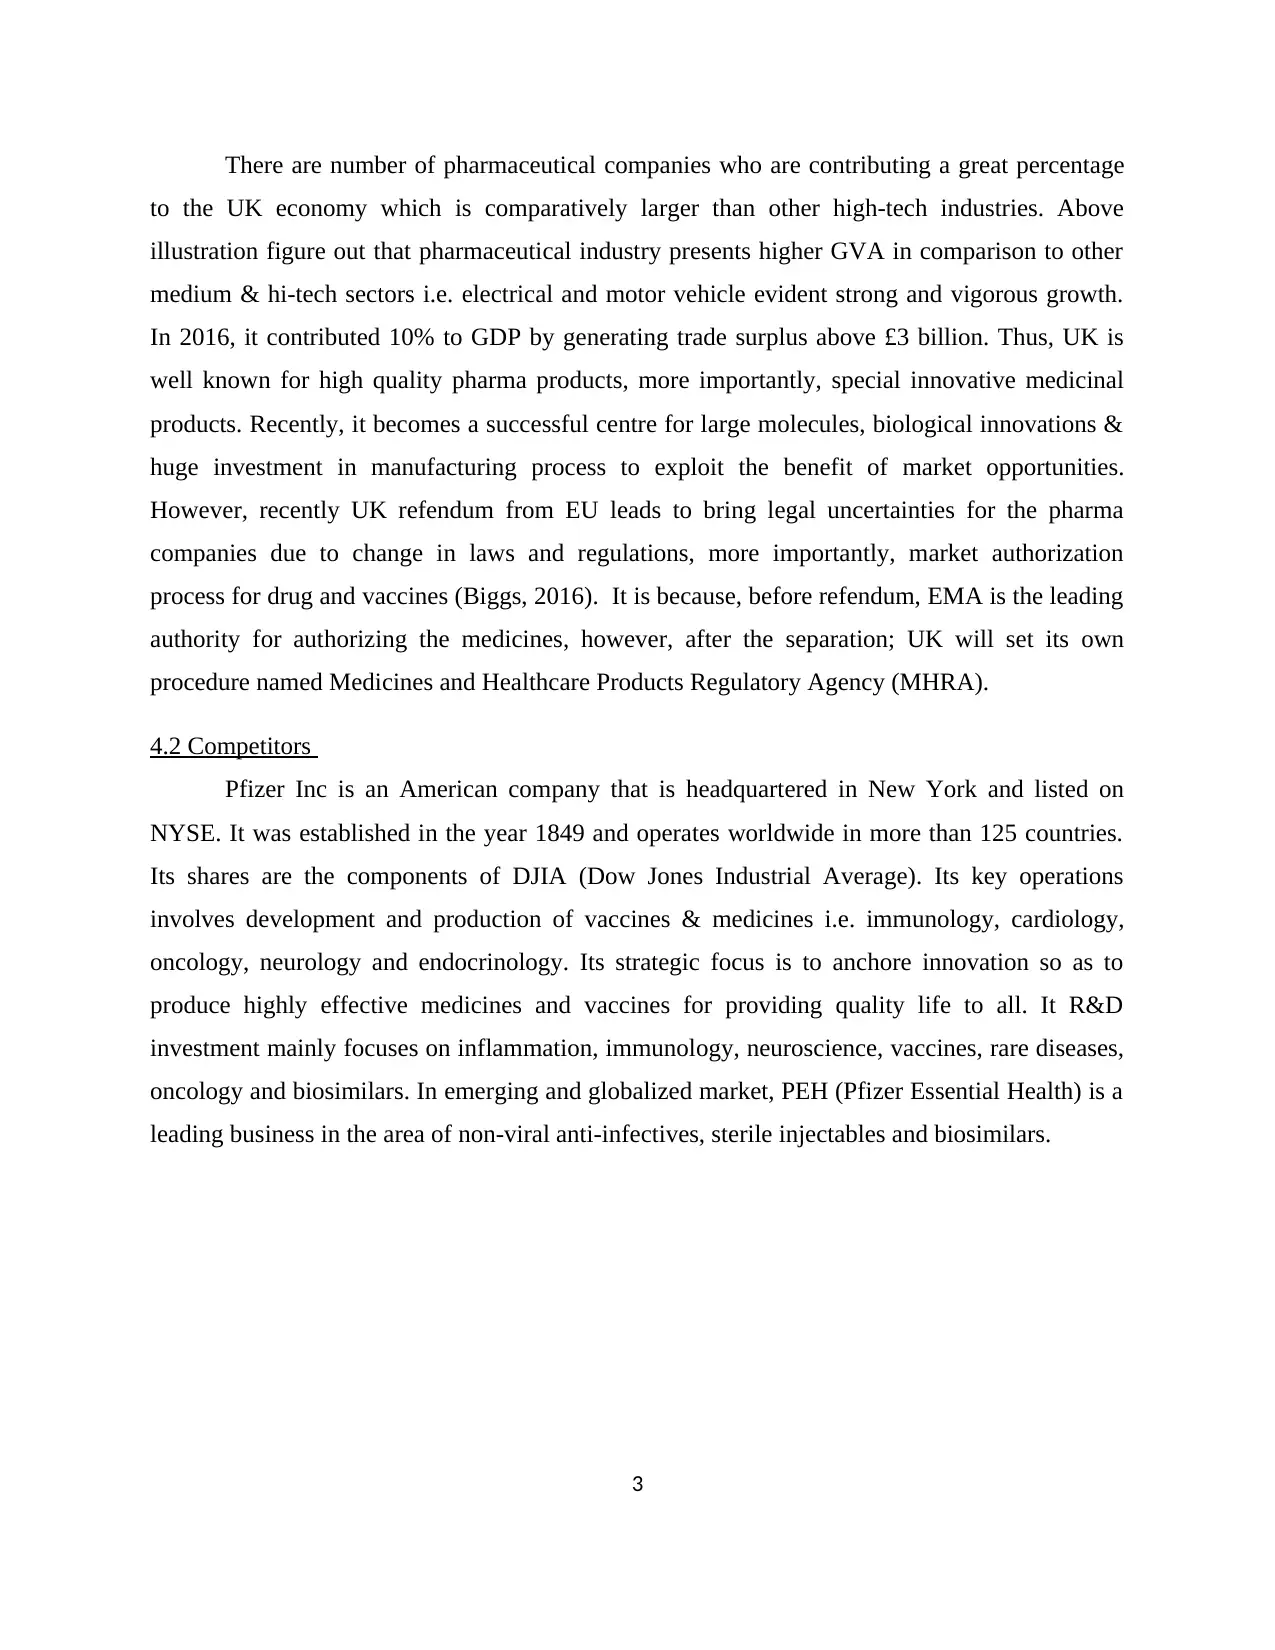
There are number of pharmaceutical companies who are contributing a great percentage
to the UK economy which is comparatively larger than other high-tech industries. Above
illustration figure out that pharmaceutical industry presents higher GVA in comparison to other
medium & hi-tech sectors i.e. electrical and motor vehicle evident strong and vigorous growth.
In 2016, it contributed 10% to GDP by generating trade surplus above £3 billion. Thus, UK is
well known for high quality pharma products, more importantly, special innovative medicinal
products. Recently, it becomes a successful centre for large molecules, biological innovations &
huge investment in manufacturing process to exploit the benefit of market opportunities.
However, recently UK refendum from EU leads to bring legal uncertainties for the pharma
companies due to change in laws and regulations, more importantly, market authorization
process for drug and vaccines (Biggs, 2016). It is because, before refendum, EMA is the leading
authority for authorizing the medicines, however, after the separation; UK will set its own
procedure named Medicines and Healthcare Products Regulatory Agency (MHRA).
4.2 Competitors
Pfizer Inc is an American company that is headquartered in New York and listed on
NYSE. It was established in the year 1849 and operates worldwide in more than 125 countries.
Its shares are the components of DJIA (Dow Jones Industrial Average). Its key operations
involves development and production of vaccines & medicines i.e. immunology, cardiology,
oncology, neurology and endocrinology. Its strategic focus is to anchore innovation so as to
produce highly effective medicines and vaccines for providing quality life to all. It R&D
investment mainly focuses on inflammation, immunology, neuroscience, vaccines, rare diseases,
oncology and biosimilars. In emerging and globalized market, PEH (Pfizer Essential Health) is a
leading business in the area of non-viral anti-infectives, sterile injectables and biosimilars.
3
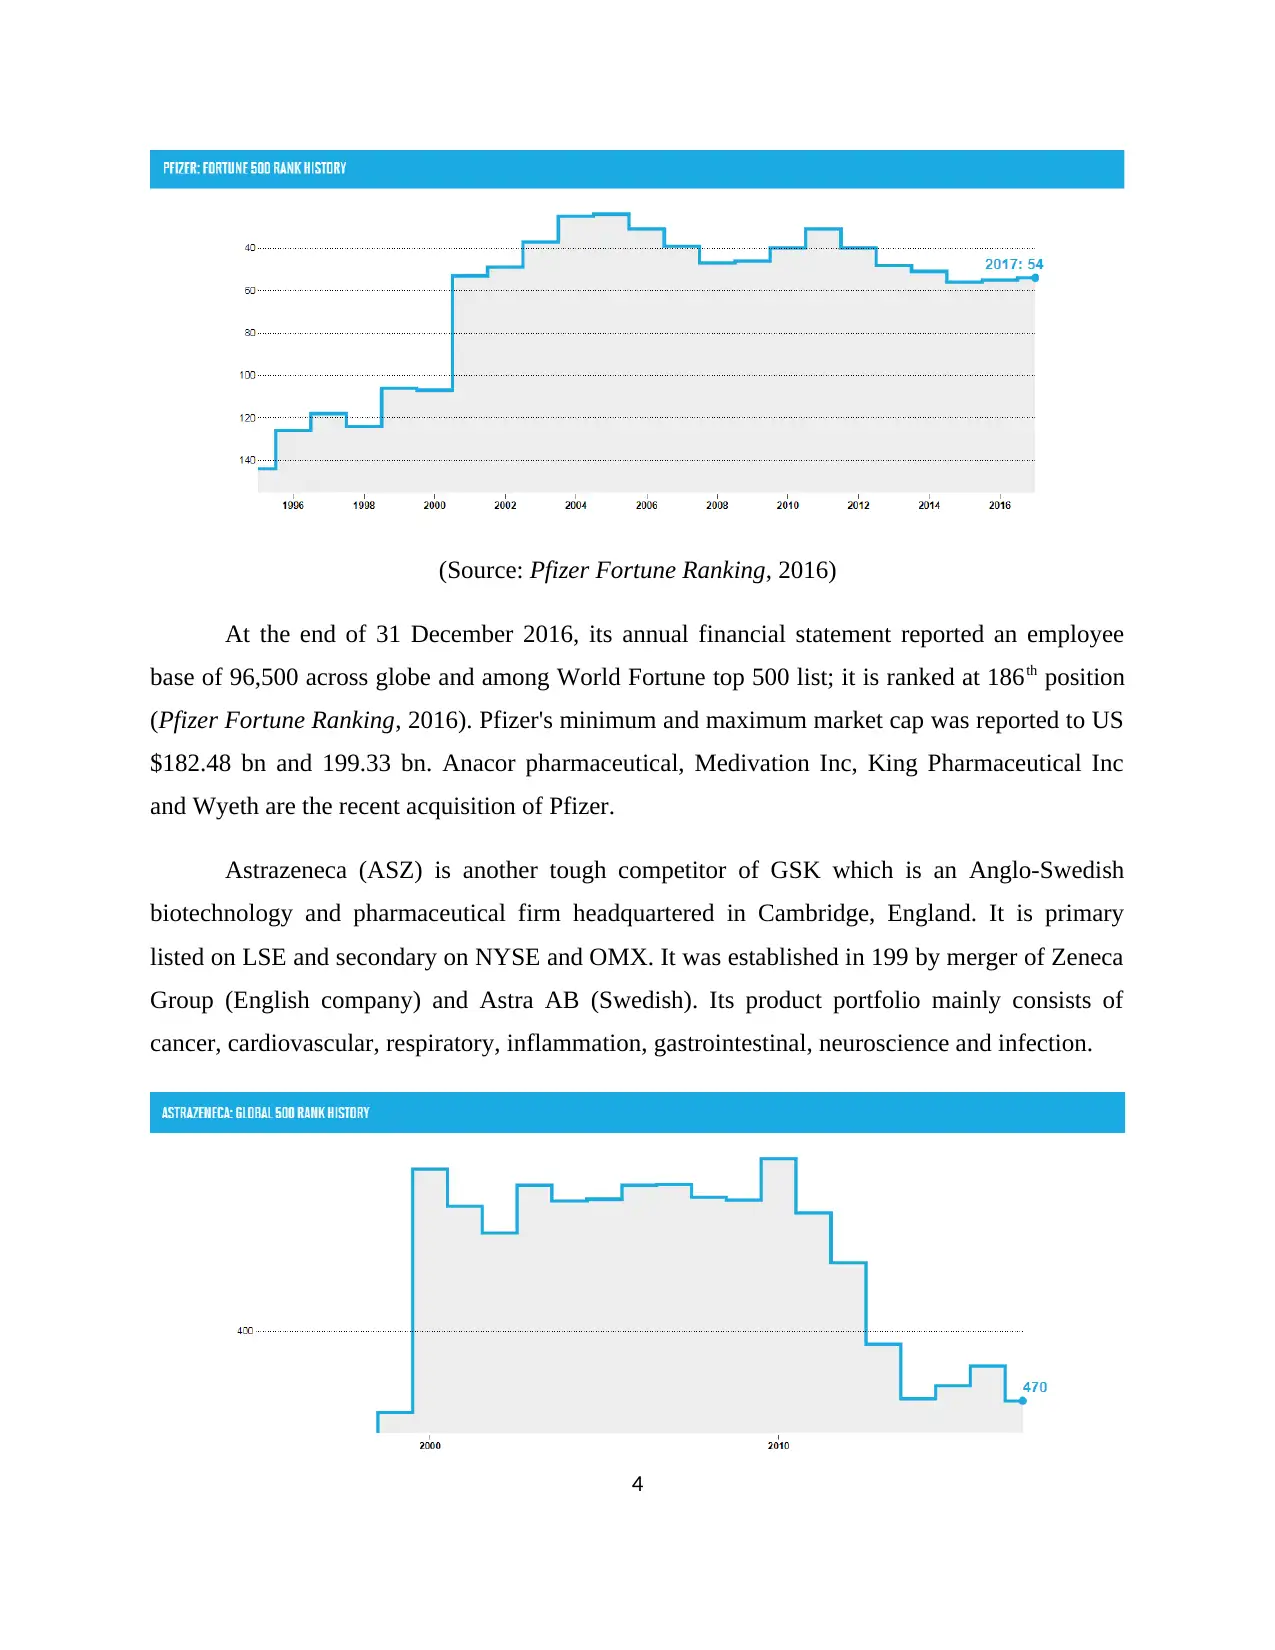
(Source: Pfizer Fortune Ranking, 2016)
At the end of 31 December 2016, its annual financial statement reported an employee
base of 96,500 across globe and among World Fortune top 500 list; it is ranked at 186th position
(Pfizer Fortune Ranking, 2016). Pfizer's minimum and maximum market cap was reported to US
$182.48 bn and 199.33 bn. Anacor pharmaceutical, Medivation Inc, King Pharmaceutical Inc
and Wyeth are the recent acquisition of Pfizer.
Astrazeneca (ASZ) is another tough competitor of GSK which is an Anglo-Swedish
biotechnology and pharmaceutical firm headquartered in Cambridge, England. It is primary
listed on LSE and secondary on NYSE and OMX. It was established in 199 by merger of Zeneca
Group (English company) and Astra AB (Swedish). Its product portfolio mainly consists of
cancer, cardiovascular, respiratory, inflammation, gastrointestinal, neuroscience and infection.
4
⊘ This is a preview!⊘
Do you want full access?
Subscribe today to unlock all pages.
Trusted by 1+ million students worldwide
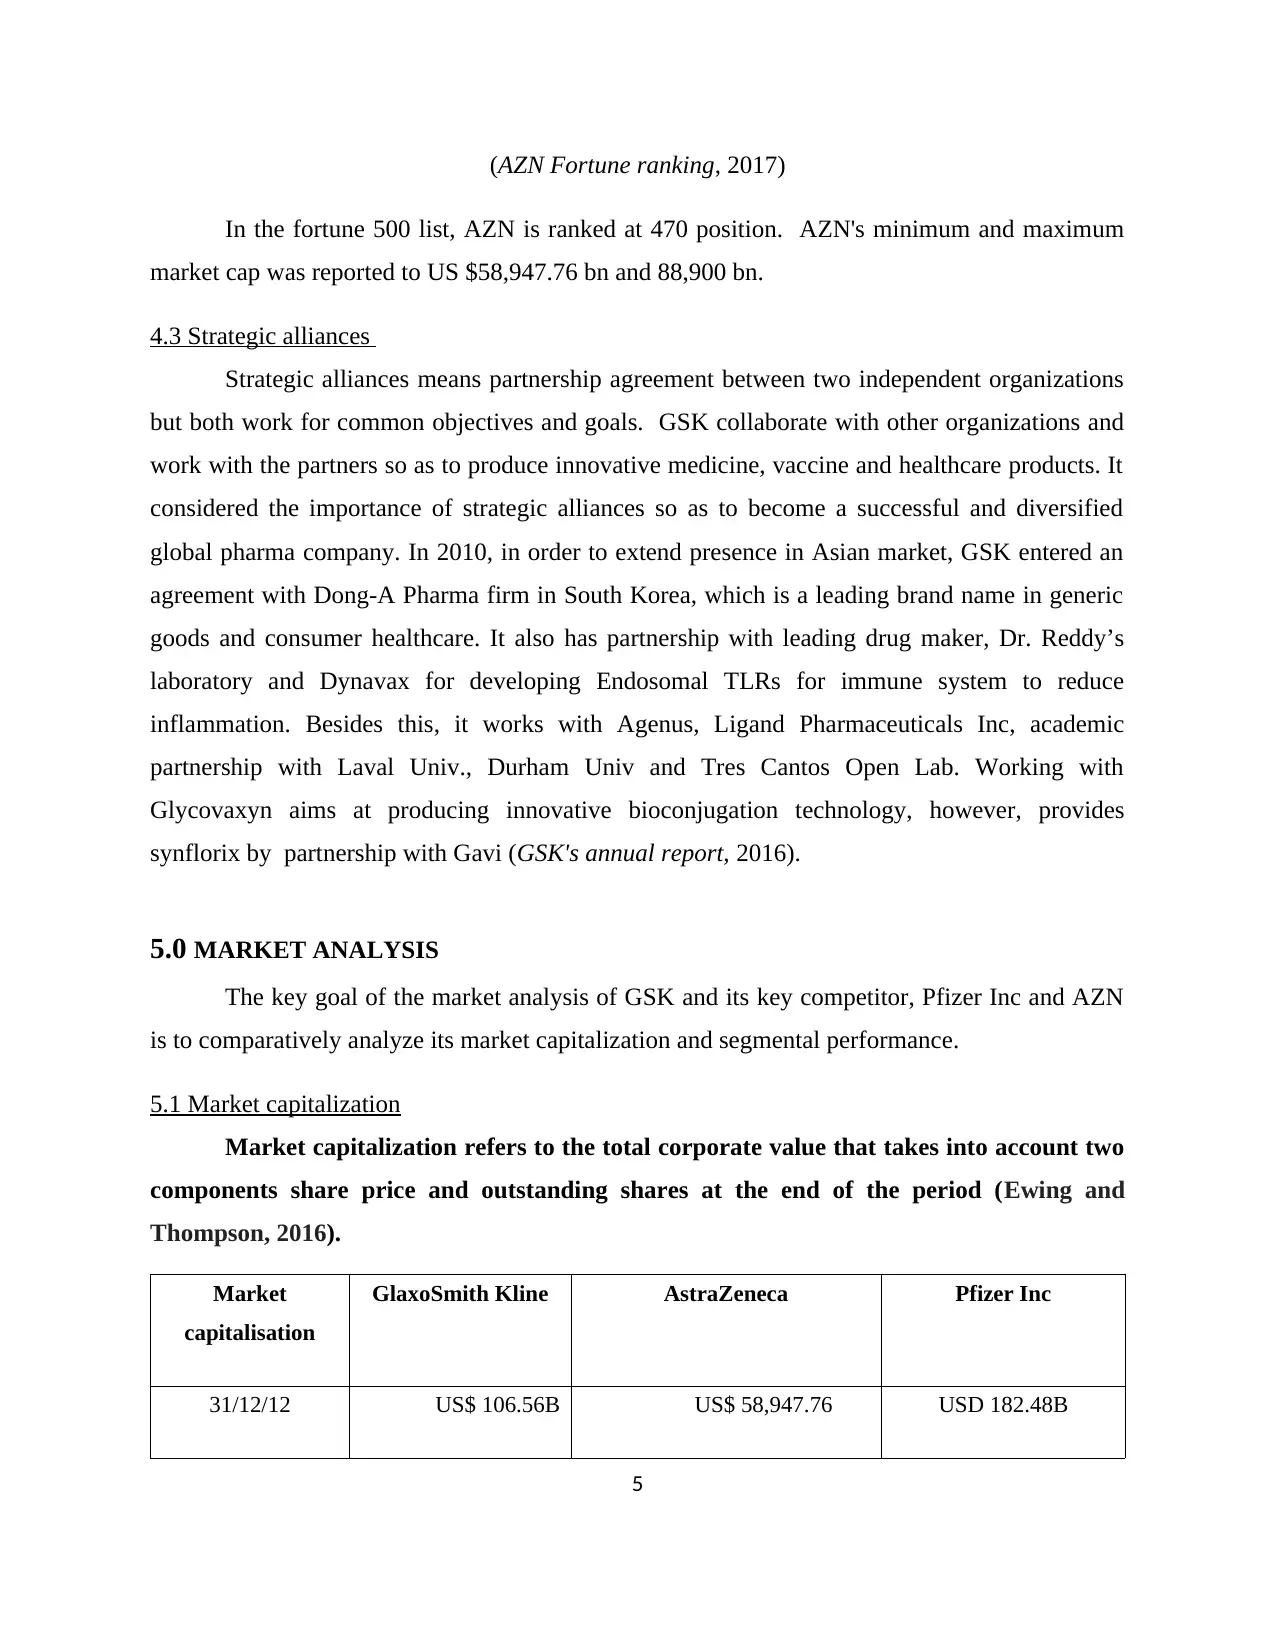
(AZN Fortune ranking, 2017)
In the fortune 500 list, AZN is ranked at 470 position. AZN's minimum and maximum
market cap was reported to US $58,947.76 bn and 88,900 bn.
4.3 Strategic alliances
Strategic alliances means partnership agreement between two independent organizations
but both work for common objectives and goals. GSK collaborate with other organizations and
work with the partners so as to produce innovative medicine, vaccine and healthcare products. It
considered the importance of strategic alliances so as to become a successful and diversified
global pharma company. In 2010, in order to extend presence in Asian market, GSK entered an
agreement with Dong-A Pharma firm in South Korea, which is a leading brand name in generic
goods and consumer healthcare. It also has partnership with leading drug maker, Dr. Reddy’s
laboratory and Dynavax for developing Endosomal TLRs for immune system to reduce
inflammation. Besides this, it works with Agenus, Ligand Pharmaceuticals Inc, academic
partnership with Laval Univ., Durham Univ and Tres Cantos Open Lab. Working with
Glycovaxyn aims at producing innovative bioconjugation technology, however, provides
synflorix by partnership with Gavi (GSK's annual report, 2016).
5.0 MARKET ANALYSIS
The key goal of the market analysis of GSK and its key competitor, Pfizer Inc and AZN
is to comparatively analyze its market capitalization and segmental performance.
5.1 Market capitalization
Market capitalization refers to the total corporate value that takes into account two
components share price and outstanding shares at the end of the period (Ewing and
Thompson, 2016).
Market
capitalisation
GlaxoSmith Kline AstraZeneca Pfizer Inc
31/12/12 US$ 106.56B US$ 58,947.76 USD 182.48B
5
Paraphrase This Document
Need a fresh take? Get an instant paraphrase of this document with our AI Paraphraser
31/12/13 US$ 129.6B US$ 74.650.75 USD 196B
31/12/14 US$ 114.44B US$ 88,900 m USD 195.96B
31/12/15 US$ 98.25B US$ 85834 mil USD 199.33B
31/12/16 US$ 93.82B US$ 69,132 m USD 197.1B
29th August 2017 US$ 96.74B US$ 79.853 bn (AstraZeneca’s
market capital. 2017)
USD 199.18B
6
31/12/14 US$ 114.44B US$ 88,900 m USD 195.96B
31/12/15 US$ 98.25B US$ 85834 mil USD 199.33B
31/12/16 US$ 93.82B US$ 69,132 m USD 197.1B
29th August 2017 US$ 96.74B US$ 79.853 bn (AstraZeneca’s
market capital. 2017)
USD 199.18B
6
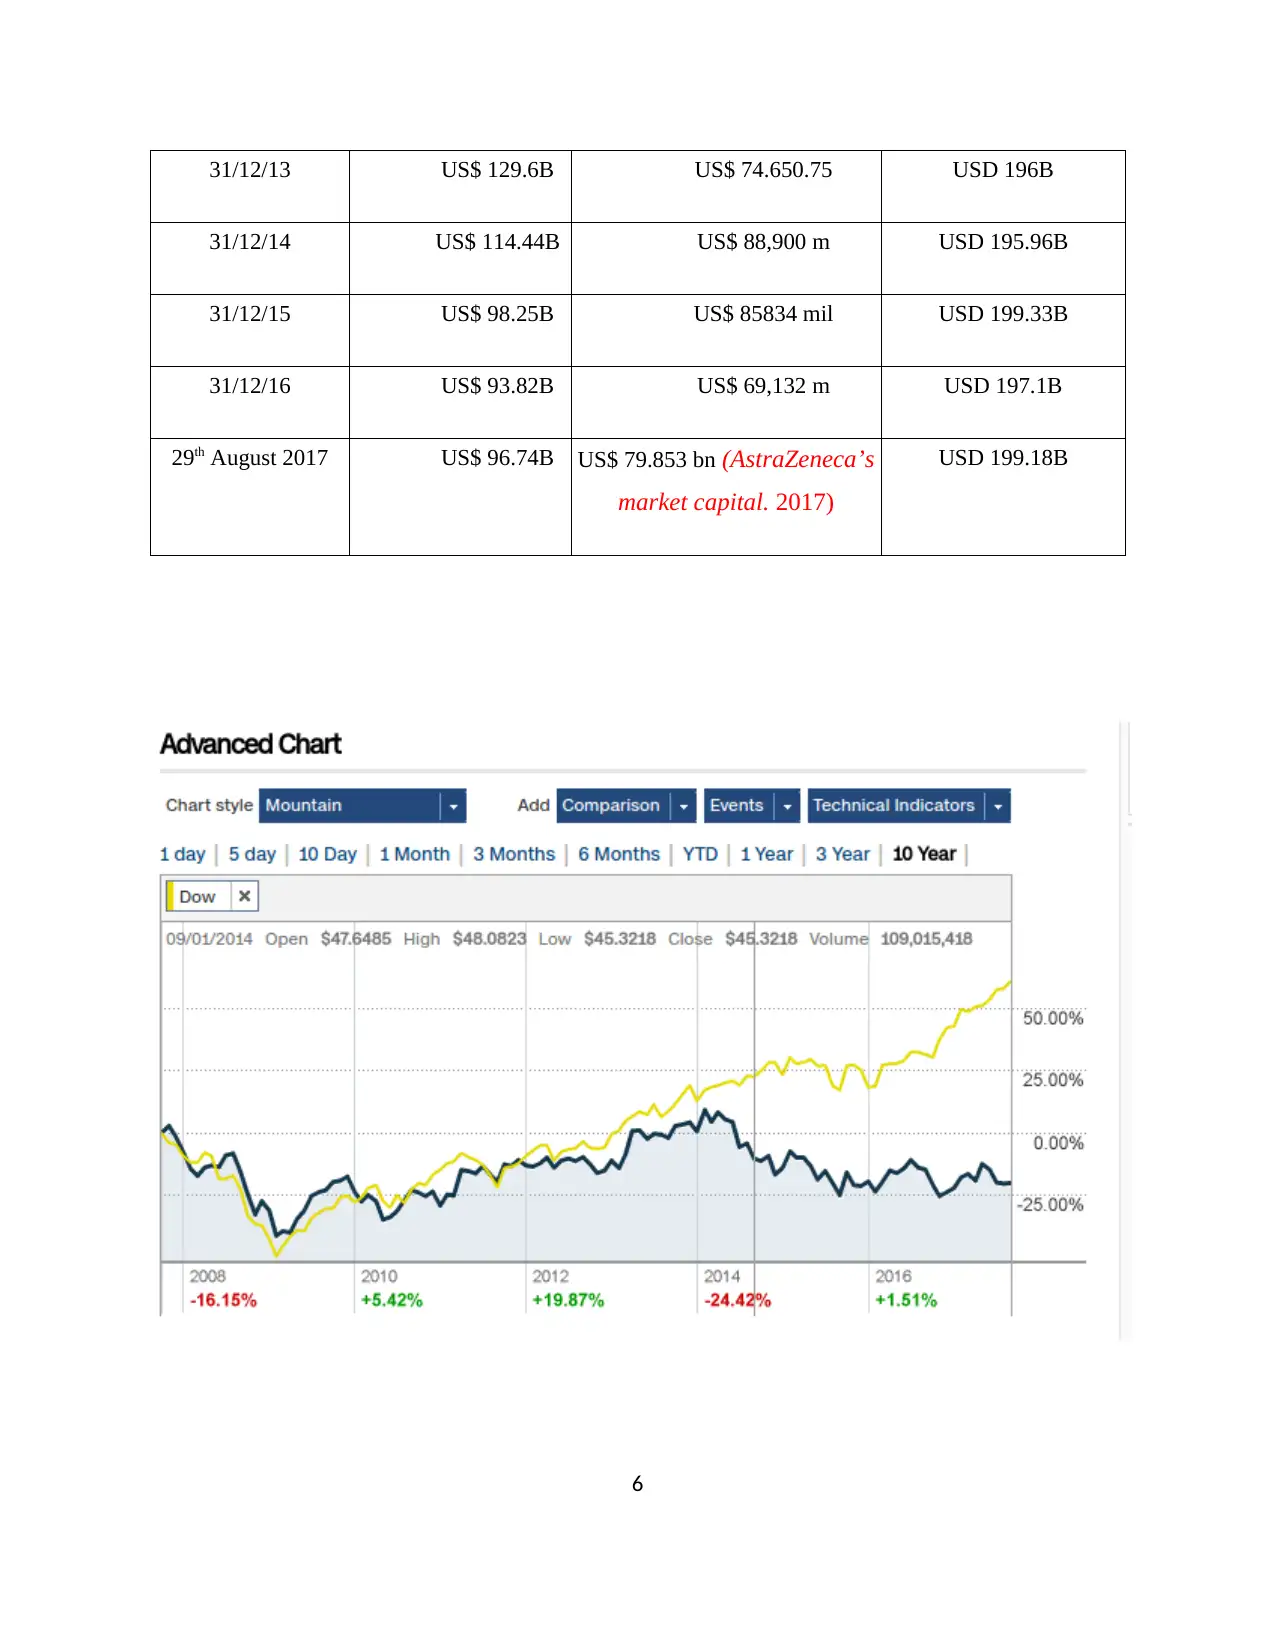
Above chart presents GSK's market cap movement with comparable trend in Dow Jones
Industrial Average. The chart presents that company's market capital shows a fluctuating trend
due to two reasons either more issue of shares/repurchase or volatile stock prices. Company issue
more shares so as to fulfill their capital requirement and Recently, in 2016, its closing share price
has been increased from £13.73 to £15.62 by 13.8% (GSK's annual report, 2016). In 2012, firms
total Market Cap was US$ 106.56 bn which rose to US$ 129.6 bn due to increase in share price
from 13.35 to 16.12. However, in next year, it came down to US$ 114.44 bn because GSK issued
more shares to generate share capital whilst share price resultant decline from £16.12 to £13.76.
In 2015 and 2016, it came to US $98.25 bn and US $ 93.82 bn, although, in 2016, its price gone
up by 13.8%, still, repurchase means buy-back of shares resultant decline in outstanding shares
declined its Market Cap (Ehrhardt and Brigham, 2016).
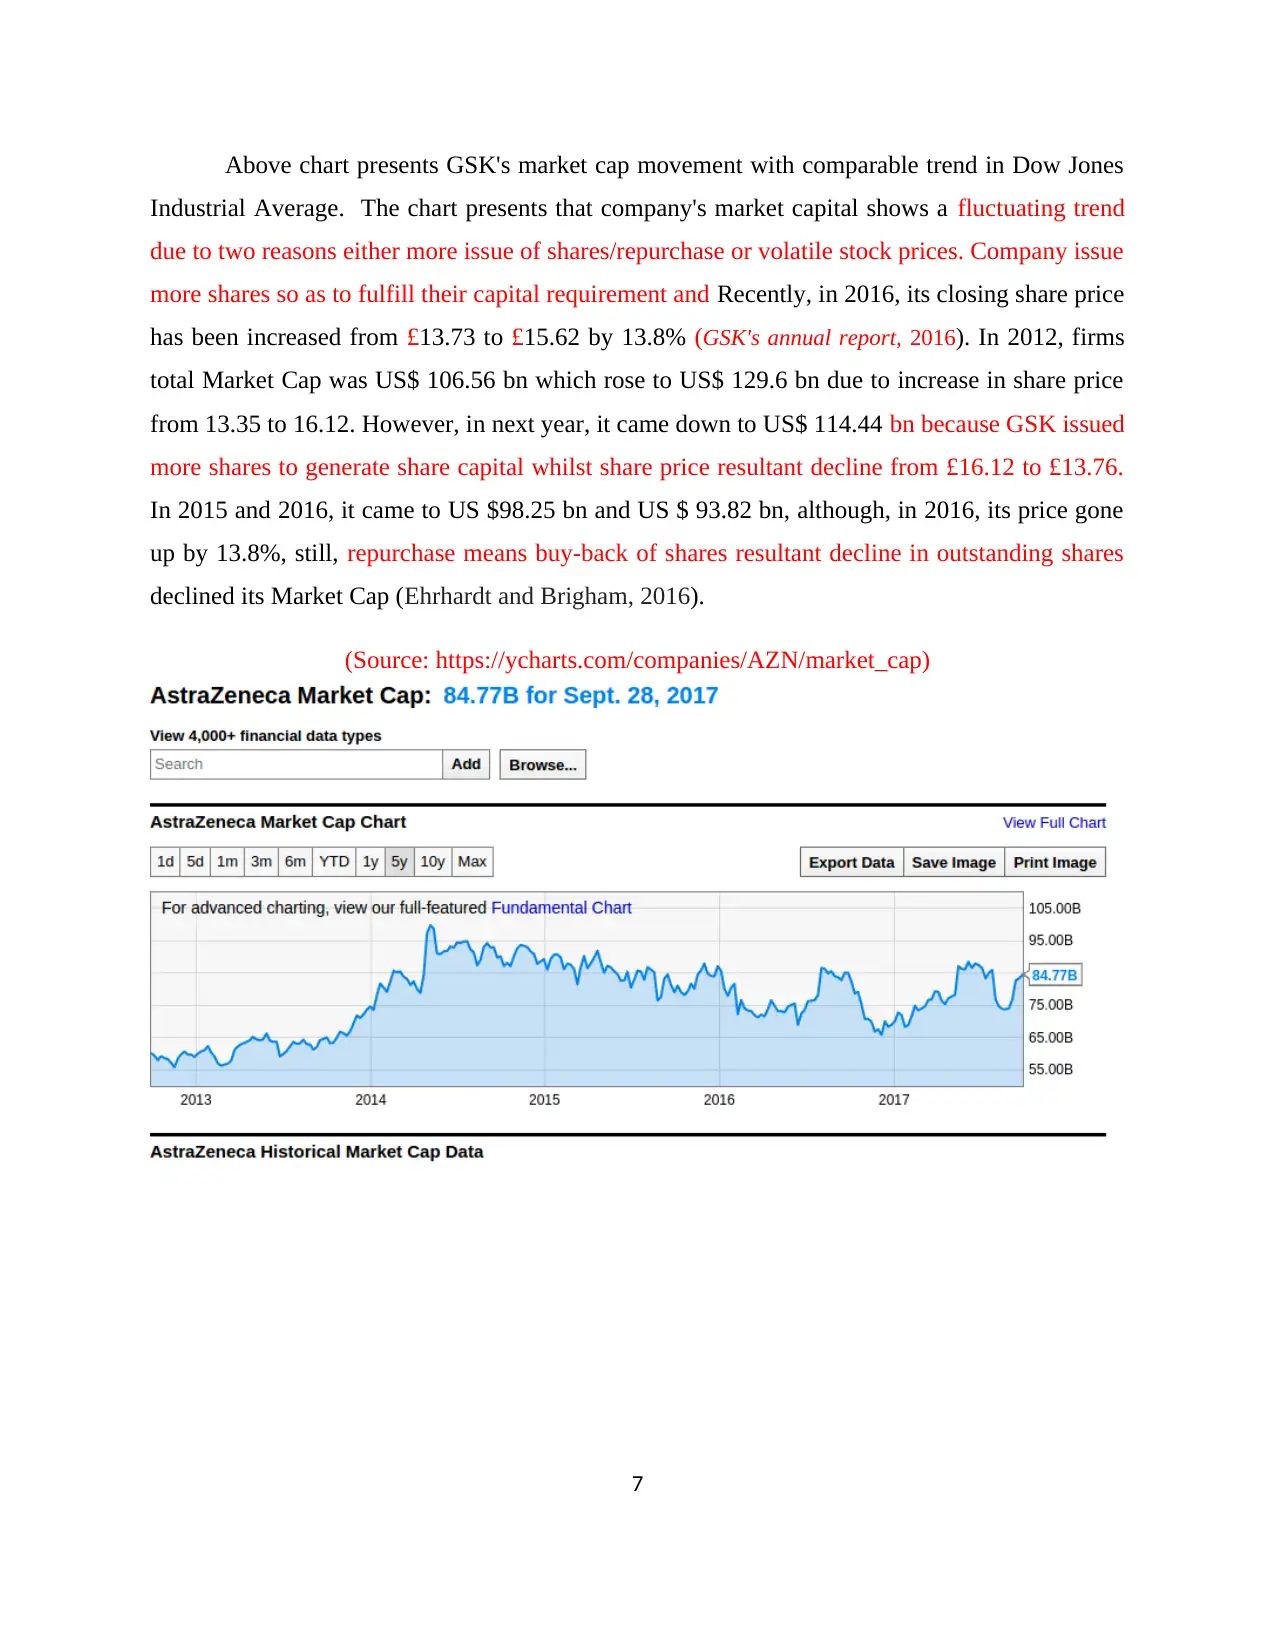
(Source: https://ycharts.com/companies/AZN/market_cap)
7
Industrial Average. The chart presents that company's market capital shows a fluctuating trend
due to two reasons either more issue of shares/repurchase or volatile stock prices. Company issue
more shares so as to fulfill their capital requirement and Recently, in 2016, its closing share price
has been increased from £13.73 to £15.62 by 13.8% (GSK's annual report, 2016). In 2012, firms
total Market Cap was US$ 106.56 bn which rose to US$ 129.6 bn due to increase in share price
from 13.35 to 16.12. However, in next year, it came down to US$ 114.44 bn because GSK issued
more shares to generate share capital whilst share price resultant decline from £16.12 to £13.76.
In 2015 and 2016, it came to US $98.25 bn and US $ 93.82 bn, although, in 2016, its price gone
up by 13.8%, still, repurchase means buy-back of shares resultant decline in outstanding shares
declined its Market Cap (Ehrhardt and Brigham, 2016).
(Source: https://ycharts.com/companies/AZN/market_cap)
7
⊘ This is a preview!⊘
Do you want full access?
Subscribe today to unlock all pages.
Trusted by 1+ million students worldwide
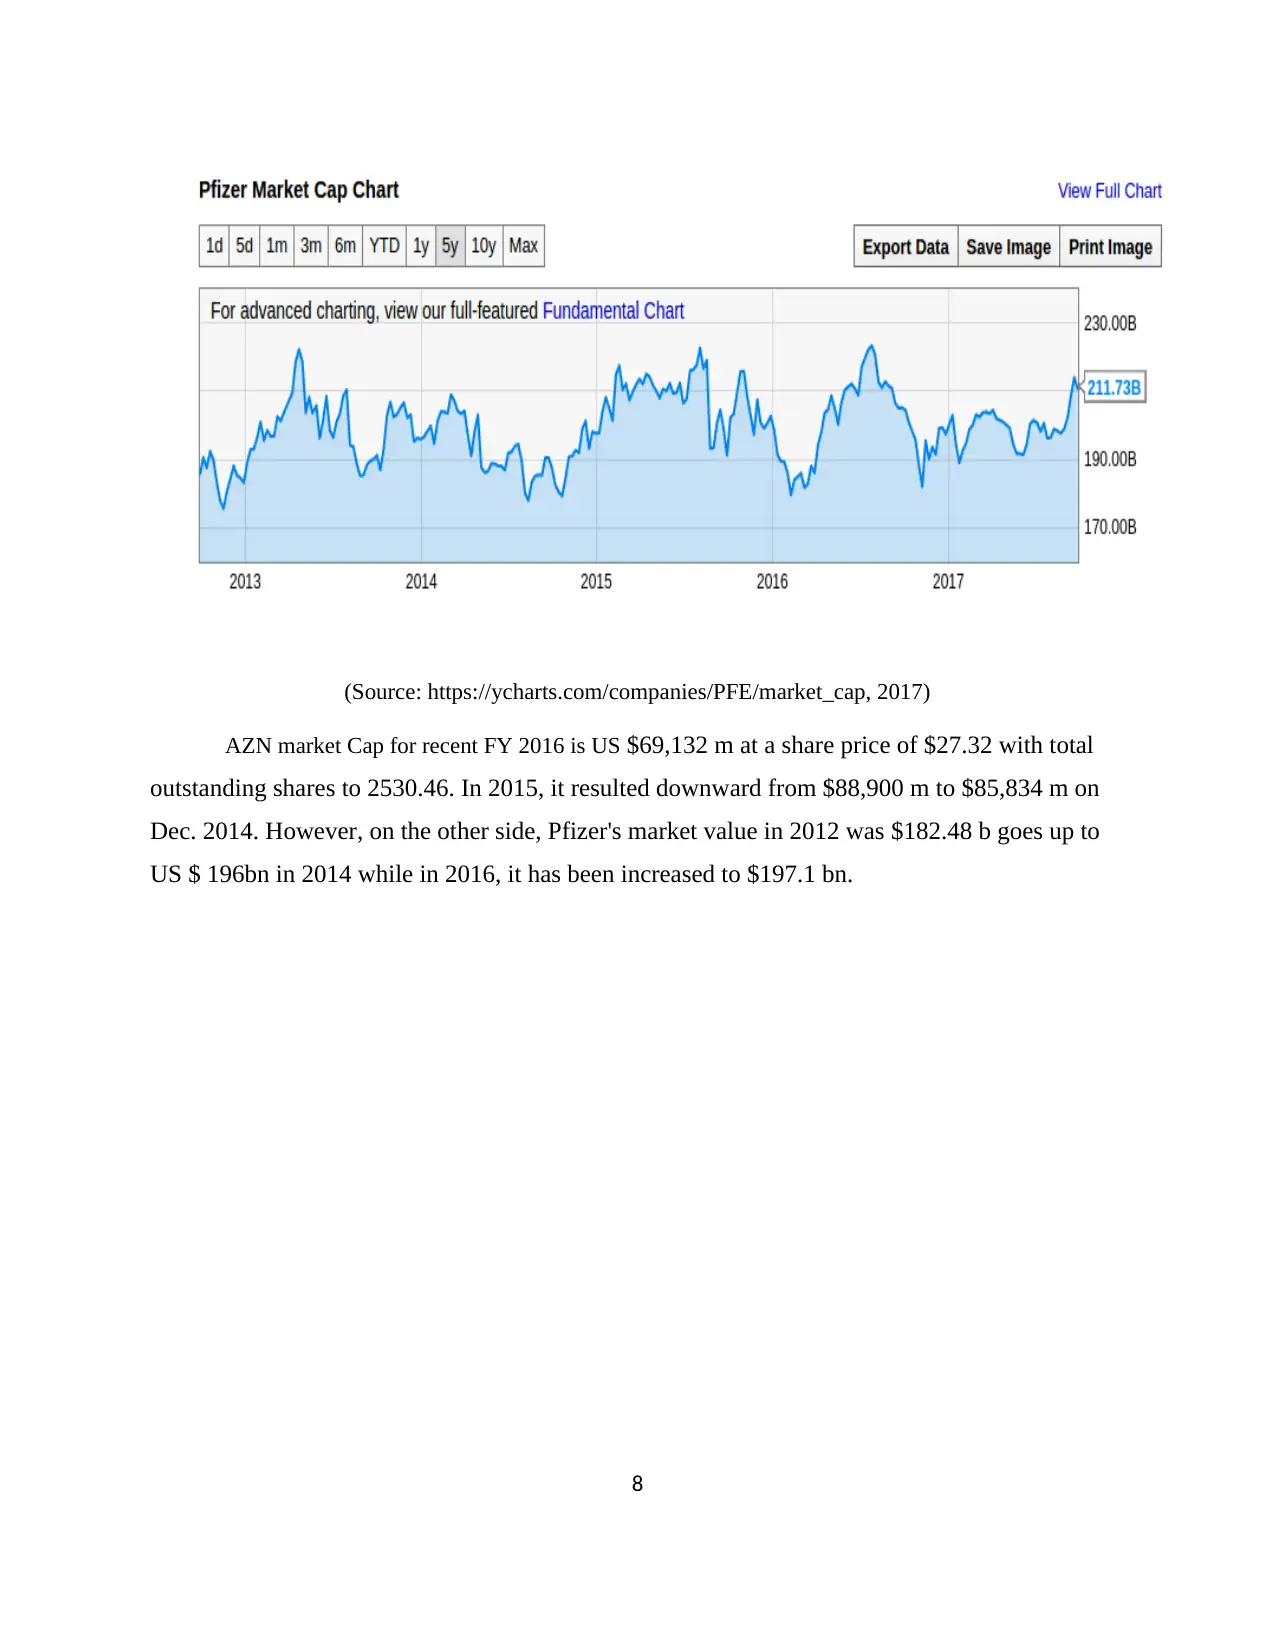
(Source: https://ycharts.com/companies/PFE/market_cap, 2017)
AZN market Cap for recent FY 2016 is US $69,132 m at a share price of $27.32 with total
outstanding shares to 2530.46. In 2015, it resulted downward from $88,900 m to $85,834 m on
Dec. 2014. However, on the other side, Pfizer's market value in 2012 was $182.48 b goes up to
US $ 196bn in 2014 while in 2016, it has been increased to $197.1 bn.
8
Paraphrase This Document
Need a fresh take? Get an instant paraphrase of this document with our AI Paraphraser
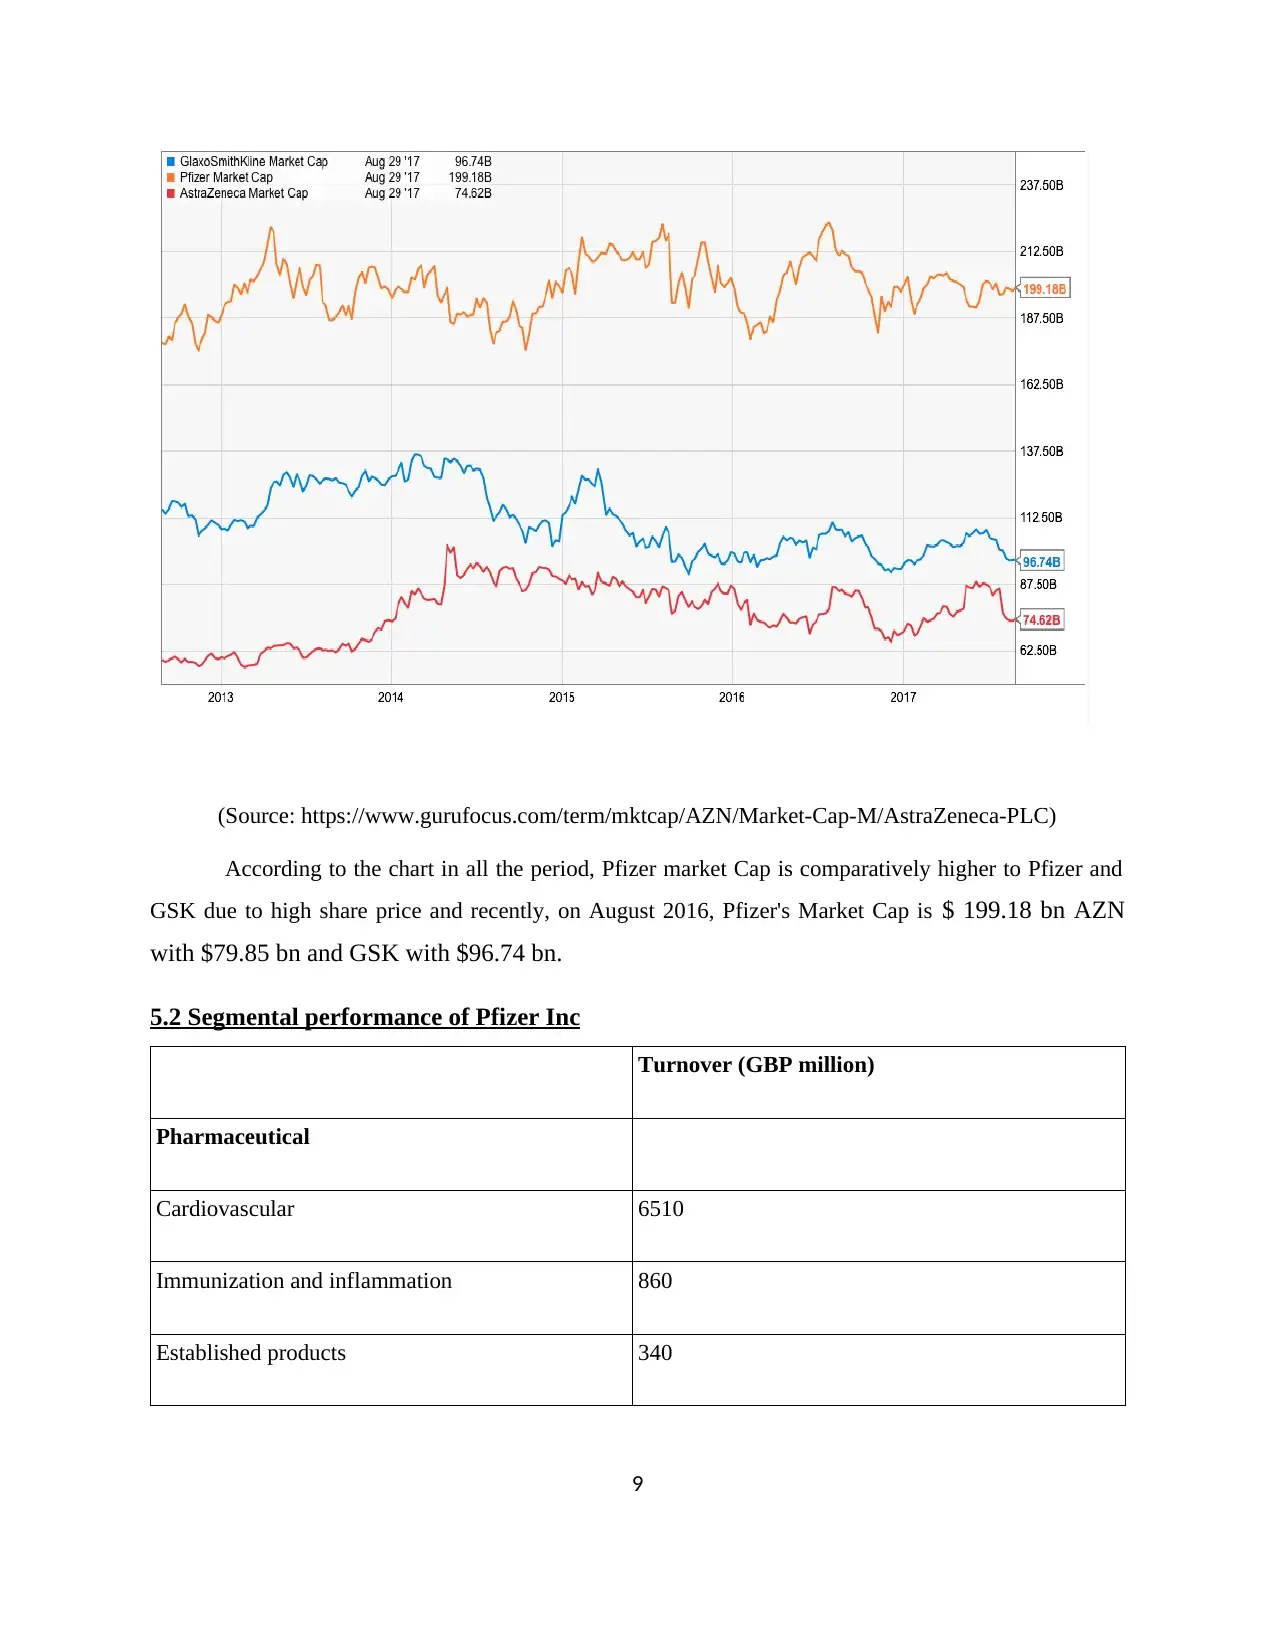
(Source: https://www.gurufocus.com/term/mktcap/AZN/Market-Cap-M/AstraZeneca-PLC)
According to the chart in all the period, Pfizer market Cap is comparatively higher to Pfizer and
GSK due to high share price and recently, on August 2016, Pfizer's Market Cap is $ 199.18 bn AZN
with $79.85 bn and GSK with $96.74 bn.
5.2 Segmental performance of Pfizer Inc
Turnover (GBP million)
Pharmaceutical
Cardiovascular 6510
Immunization and inflammation 860
Established products 340
9
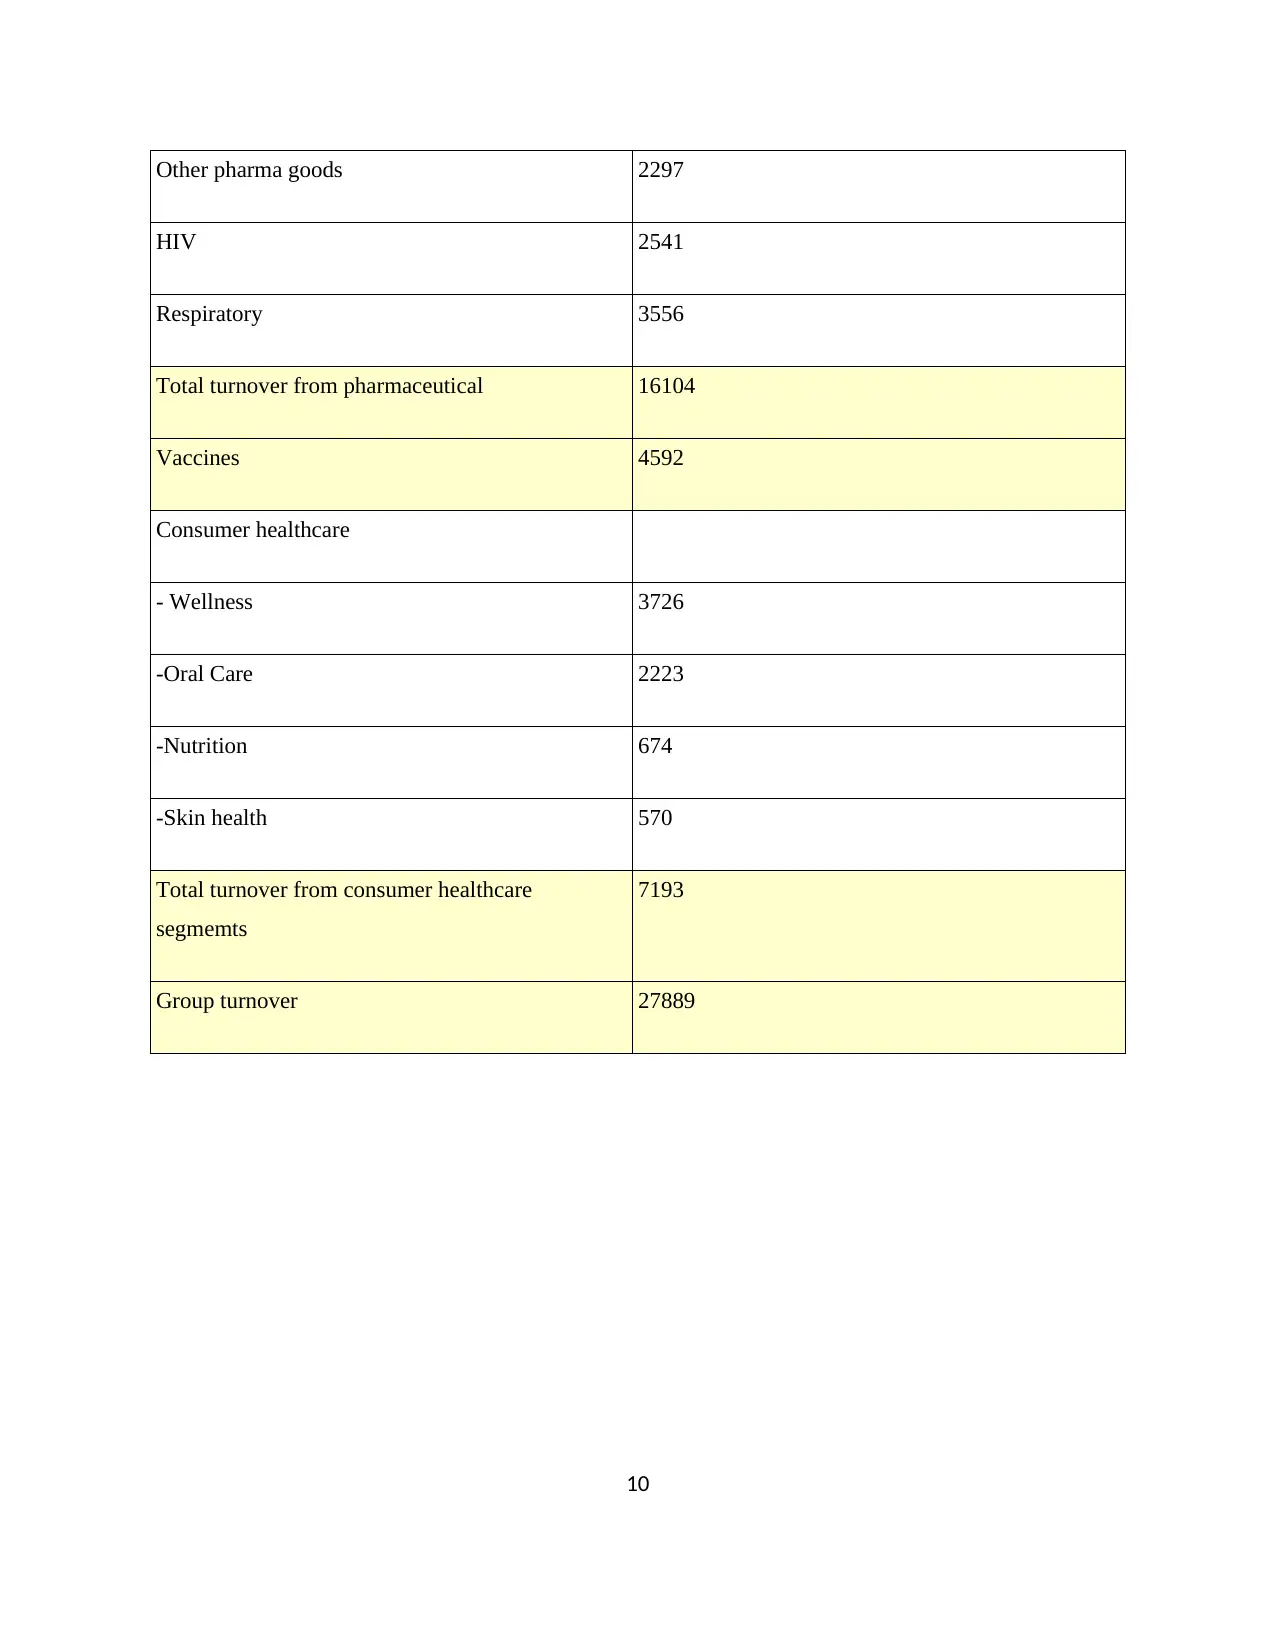
Other pharma goods 2297
HIV 2541
Respiratory 3556
Total turnover from pharmaceutical 16104
Vaccines 4592
Consumer healthcare
- Wellness 3726
-Oral Care 2223
-Nutrition 674
-Skin health 570
Total turnover from consumer healthcare
segmemts
7193
Group turnover 27889
10
HIV 2541
Respiratory 3556
Total turnover from pharmaceutical 16104
Vaccines 4592
Consumer healthcare
- Wellness 3726
-Oral Care 2223
-Nutrition 674
-Skin health 570
Total turnover from consumer healthcare
segmemts
7193
Group turnover 27889
10
⊘ This is a preview!⊘
Do you want full access?
Subscribe today to unlock all pages.
Trusted by 1+ million students worldwide
1 out of 19
Your All-in-One AI-Powered Toolkit for Academic Success.
+13062052269
info@desklib.com
Available 24*7 on WhatsApp / Email
![[object Object]](/_next/static/media/star-bottom.7253800d.svg)
Unlock your academic potential
Copyright © 2020–2026 A2Z Services. All Rights Reserved. Developed and managed by ZUCOL.