Glebe Farm Case Study: Operations, Financial Performance Review
VerifiedAdded on 2023/06/12
|9
|2553
|95
Case Study
AI Summary
This case study solution provides a comprehensive analysis of Glebe Farm's operations and financial management. The operational analysis examines demand variability, buffering strategies (time, inventory, and capacity), and demand management techniques such as chase demand, level capacity, and demand management. It also considers the impact of increasing ice cream flavors on sales and inventory control. The financial analysis includes calculations and interpretations of key financial ratios such as gearing ratio, interest coverage ratio, quick ratio, inventory days, and receivable days. Furthermore, it assesses the gross profit margin, operating profit margin, return on capital employed, operating cash cycle ratio, and provides insights into the company's financial performance and efficiency in utilizing resources. Desklib offers this solution along with a wide range of study tools and past papers for students.

OPEN BOOK EXAM
Paraphrase This Document
Need a fresh take? Get an instant paraphrase of this document with our AI Paraphraser
TASK
Part B: Operations: -
Question 1:
A.
Law of variability: It can be elucidated as a tool that helps to quantity to what extent demand
would vary in associated business. It defines the difference between what one expects to take
place and what actually happens. There are many reasons that are responsible for such
variations and which contribute in degrading the functioning of a system dealing in delivery as
well. Sources of demand variability are described below:
Complexity: In Glebe farm case It can be justified as a complicated function that takes in
account whether what is being planned or predicted would give exact results that are
expected and thus what would be related measure that would help to achieve such goals in
area of ice cream and milking factory.
Uncertainty: It can be stated as a situation that is developed through force and existence of
external factors present in market and which would cause demand to rise or fall
unexpectedly. In Glebe farm area there are many local shops available around that might
attract consumer and thus is not necessary that the demand would rise. In case of milking, it
has to manage number of visitors and in case of ice cream sales it has to increase number of
flavours.
Volatility: It can be explained as a alternation and rapid change observed in rise of
unpredictable demand taking place in business related environment. In relation with Glebe
farm, it is observed that the demand is expected to rise for certain flavours that must be met
by the business for smooth working and carrying out of operations and for milking tour it
must manage related space required for increasing visitors
B.
The variability buffering in the system of delivery happened due to different combination of
inventory, capacity and time. Buffering simply means sudden change in demand of the goods
and services that can be absorbed by holding the buffer system with extra capacity in the
product and services offered by the organisation. There are generally following types of
buffering:
Time Buffering: It is connected with queue of the visitors and customers and occurs at
the time of holiday happened or any other event happened. The batch size is limited to 12
people which can view the process of milk that will result in development of the
inventory and generation of the milk. It could be substituted If the frequency of the batch
is shortened and more than 80 persons could visit and see the cow milking in one hour. It
will be beneficial for the corporation as well as the customer will also attract and the
visiting people will also increase. This could lead to occupy the 100% capacity of the
visitors.
Inventory Buffering: In the case of Glebe Farm, the buffer inventory could be, buffered
from the supply of raw material which are to be process so that the demand of the farm
products could be fulfilled. It could be done by variability in the internal results of the
work – in progress of the goods. In the case, the capacity of the inventory buffering is to
be anticipated as the material and the production output to only be smoothen out if the
capacity requirements can be fulfilled. For this, as can be interpreted from the case study
that the inventory buffering can be minimised by acquiring the large quantity of raw
material and presuming the that the number of visitors during the holidays will be hiked
as per the capacity requirements and the timing.
Capacity Buffering: It depends on the buffering of the inventory variability. As the
decision is required to be produced more quantity of goods depends on the batch which is
to be manufactured more. In this case, the variability in the capacity is related to the
inventory buffering which means that to avoid the capacity buffering the inventory
should be diminishing.
⊘ This is a preview!⊘
Do you want full access?
Subscribe today to unlock all pages.
Trusted by 1+ million students worldwide
C.
Chase demand: It explains where the capacity is required to be adjusted according to
variation observed in demand cycle. It is useful mainly in service-related industries such
as construction or tourism. Thus, in case of Glebe farm products such as ice cream and
milk factories it is not a beneficial option that can be considered.
Level capacity: It is described as a situation where the decision maker has to decide ways
to meet requirements of consumers at the time of peak durations. Applying it in situation
of Glebe farm it would prove to be fruitful as Gill has to manage visitor place of 80 in
peak hours at peak days and produce a greater number of flavours for expected rise in
scale of consumers & to increase profit, sale. Thus, it can be considered as a better option
that would help in reconciling capacity in relation with demand variation. It would help
to engage more customers in other areas as well and attract them for increasing
profitability of the business.
Demand management: It is helpful where the demand deals in seasonal products such as
ice cream flavours being produced in Glebe farm that would help to manage demand &
balance its associated customers. Whereas in case of Milking area Gill is expected to
make best use of available resources and manage increasing visitors in peak hours for the
milking tour. It would be helpful in long run and to better fulfil unpredictable needs and
expectations of consumers. Demand can be managed by proper planning and production
in the factory and making best use of available resources.
D.
While increasing the number of ice cream flavours to promote sales is a good idea, the amount of
every flavour to also be created is uncertain, and whether or not comparable amounts of all
varieties should be produced can really be determined without understanding the buying patterns.
If an unexpected demand for a certain flavour arises, and Glebe Farm refuses to offer it, the
consumers will be dissatisfied. Glebe Farm, on the other hand, would be at a loss unless there are
varieties which are infrequently requested yet over processed. Another issue to consider is
whether the manufacturer has enough workers and whether the cost of flavouring is now within
the budget. Finally, the presumption that increasing the number of flavours will improve sales is
just that. If revenues do not grow, inventory control may be less likely, and flavours would be
retained for extended periods of time. However, if carefully planned and handled, the suggestion
Paraphrase This Document
Need a fresh take? Get an instant paraphrase of this document with our AI Paraphraser
to boost the amount of varieties is still doable, requiring only the investment of flavouring
ingredients and no additional staff.
Part C: Financial management: -
Question 2:
A.
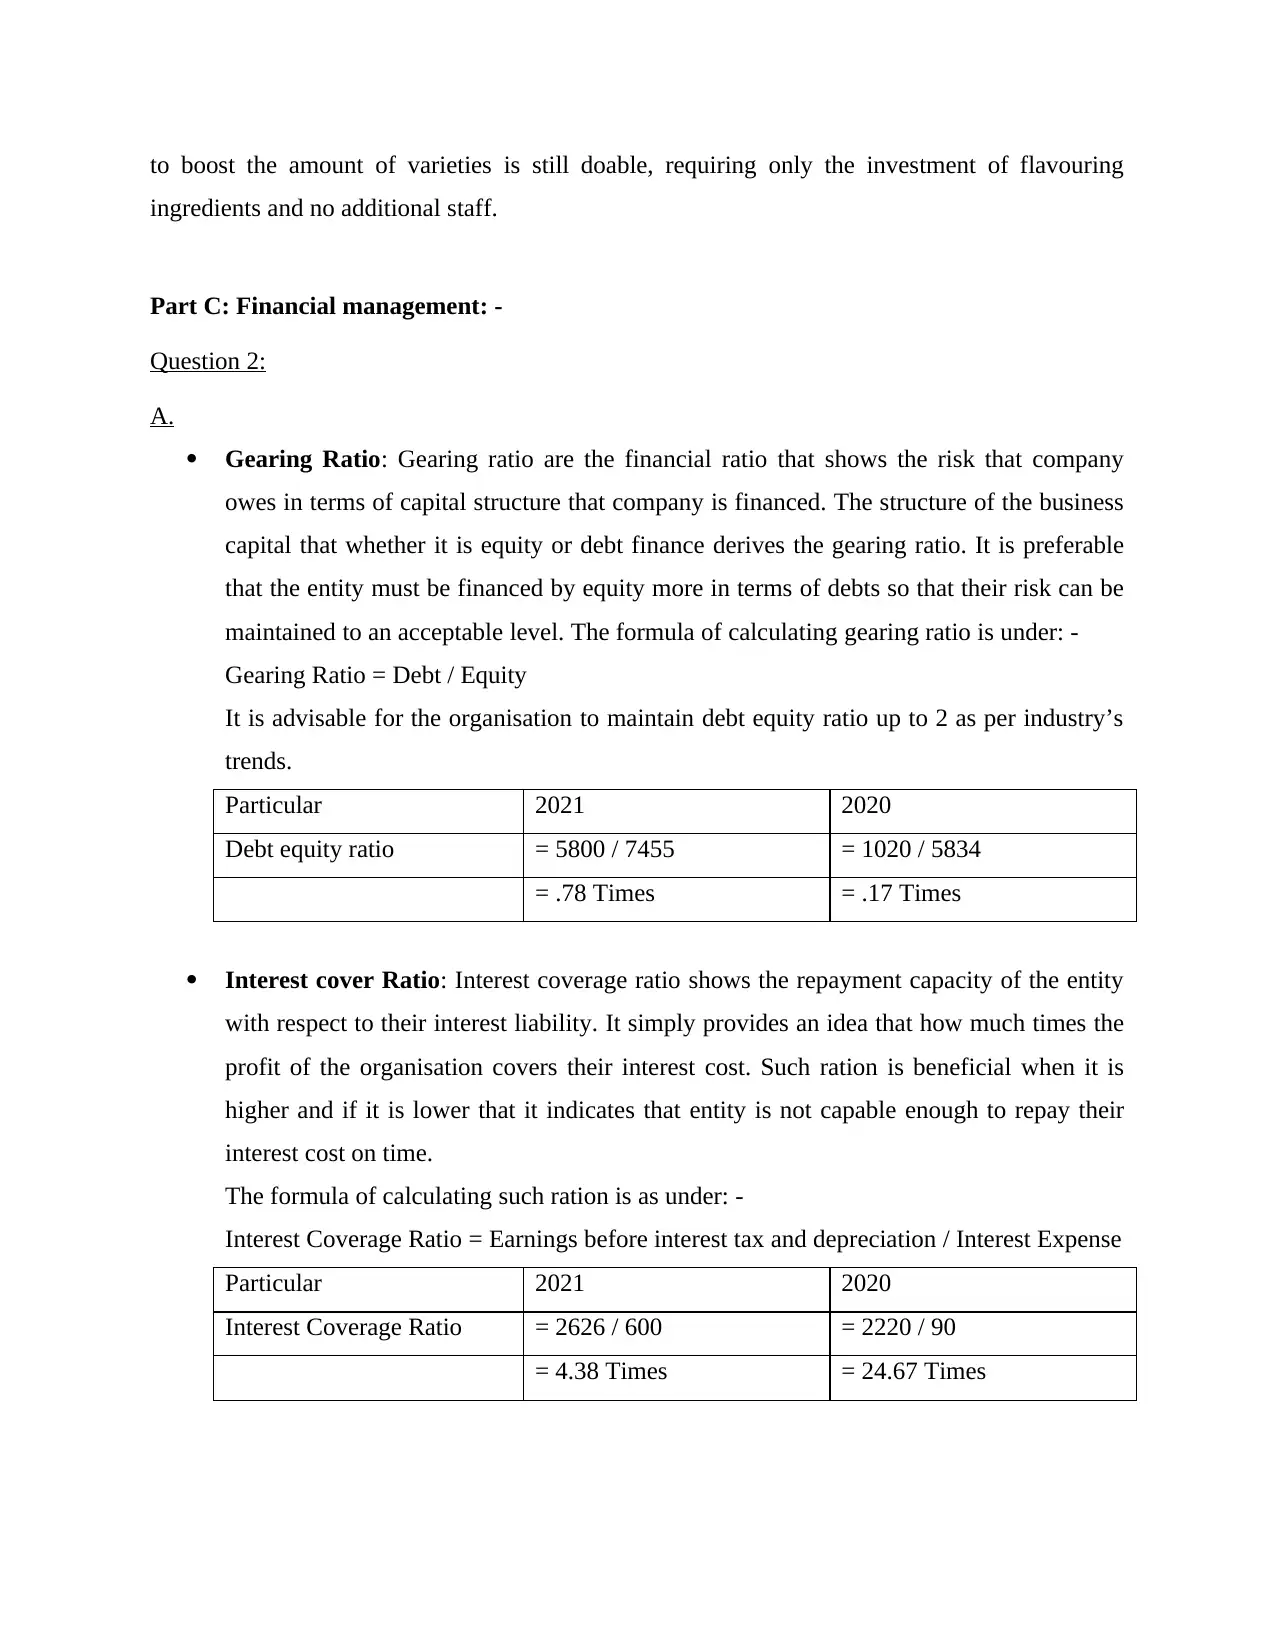
Gearing Ratio: Gearing ratio are the financial ratio that shows the risk that company
owes in terms of capital structure that company is financed. The structure of the business
capital that whether it is equity or debt finance derives the gearing ratio. It is preferable
that the entity must be financed by equity more in terms of debts so that their risk can be
maintained to an acceptable level. The formula of calculating gearing ratio is under: -
Gearing Ratio = Debt / Equity
It is advisable for the organisation to maintain debt equity ratio up to 2 as per industry’s
trends.
Particular 2021 2020
Debt equity ratio = 5800 / 7455 = 1020 / 5834
= .78 Times = .17 Times
Interest cover Ratio: Interest coverage ratio shows the repayment capacity of the entity
with respect to their interest liability. It simply provides an idea that how much times the
profit of the organisation covers their interest cost. Such ration is beneficial when it is
higher and if it is lower that it indicates that entity is not capable enough to repay their
interest cost on time.
The formula of calculating such ration is as under: -
Interest Coverage Ratio = Earnings before interest tax and depreciation / Interest Expense
Particular 2021 2020
Interest Coverage Ratio = 2626 / 600 = 2220 / 90
= 4.38 Times = 24.67 Times
ingredients and no additional staff.
Part C: Financial management: -
Question 2:
A.
Gearing Ratio: Gearing ratio are the financial ratio that shows the risk that company
owes in terms of capital structure that company is financed. The structure of the business
capital that whether it is equity or debt finance derives the gearing ratio. It is preferable
that the entity must be financed by equity more in terms of debts so that their risk can be
maintained to an acceptable level. The formula of calculating gearing ratio is under: -
Gearing Ratio = Debt / Equity
It is advisable for the organisation to maintain debt equity ratio up to 2 as per industry’s
trends.
Particular 2021 2020
Debt equity ratio = 5800 / 7455 = 1020 / 5834
= .78 Times = .17 Times
Interest cover Ratio: Interest coverage ratio shows the repayment capacity of the entity
with respect to their interest liability. It simply provides an idea that how much times the
profit of the organisation covers their interest cost. Such ration is beneficial when it is
higher and if it is lower that it indicates that entity is not capable enough to repay their
interest cost on time.
The formula of calculating such ration is as under: -
Interest Coverage Ratio = Earnings before interest tax and depreciation / Interest Expense
Particular 2021 2020
Interest Coverage Ratio = 2626 / 600 = 2220 / 90
= 4.38 Times = 24.67 Times
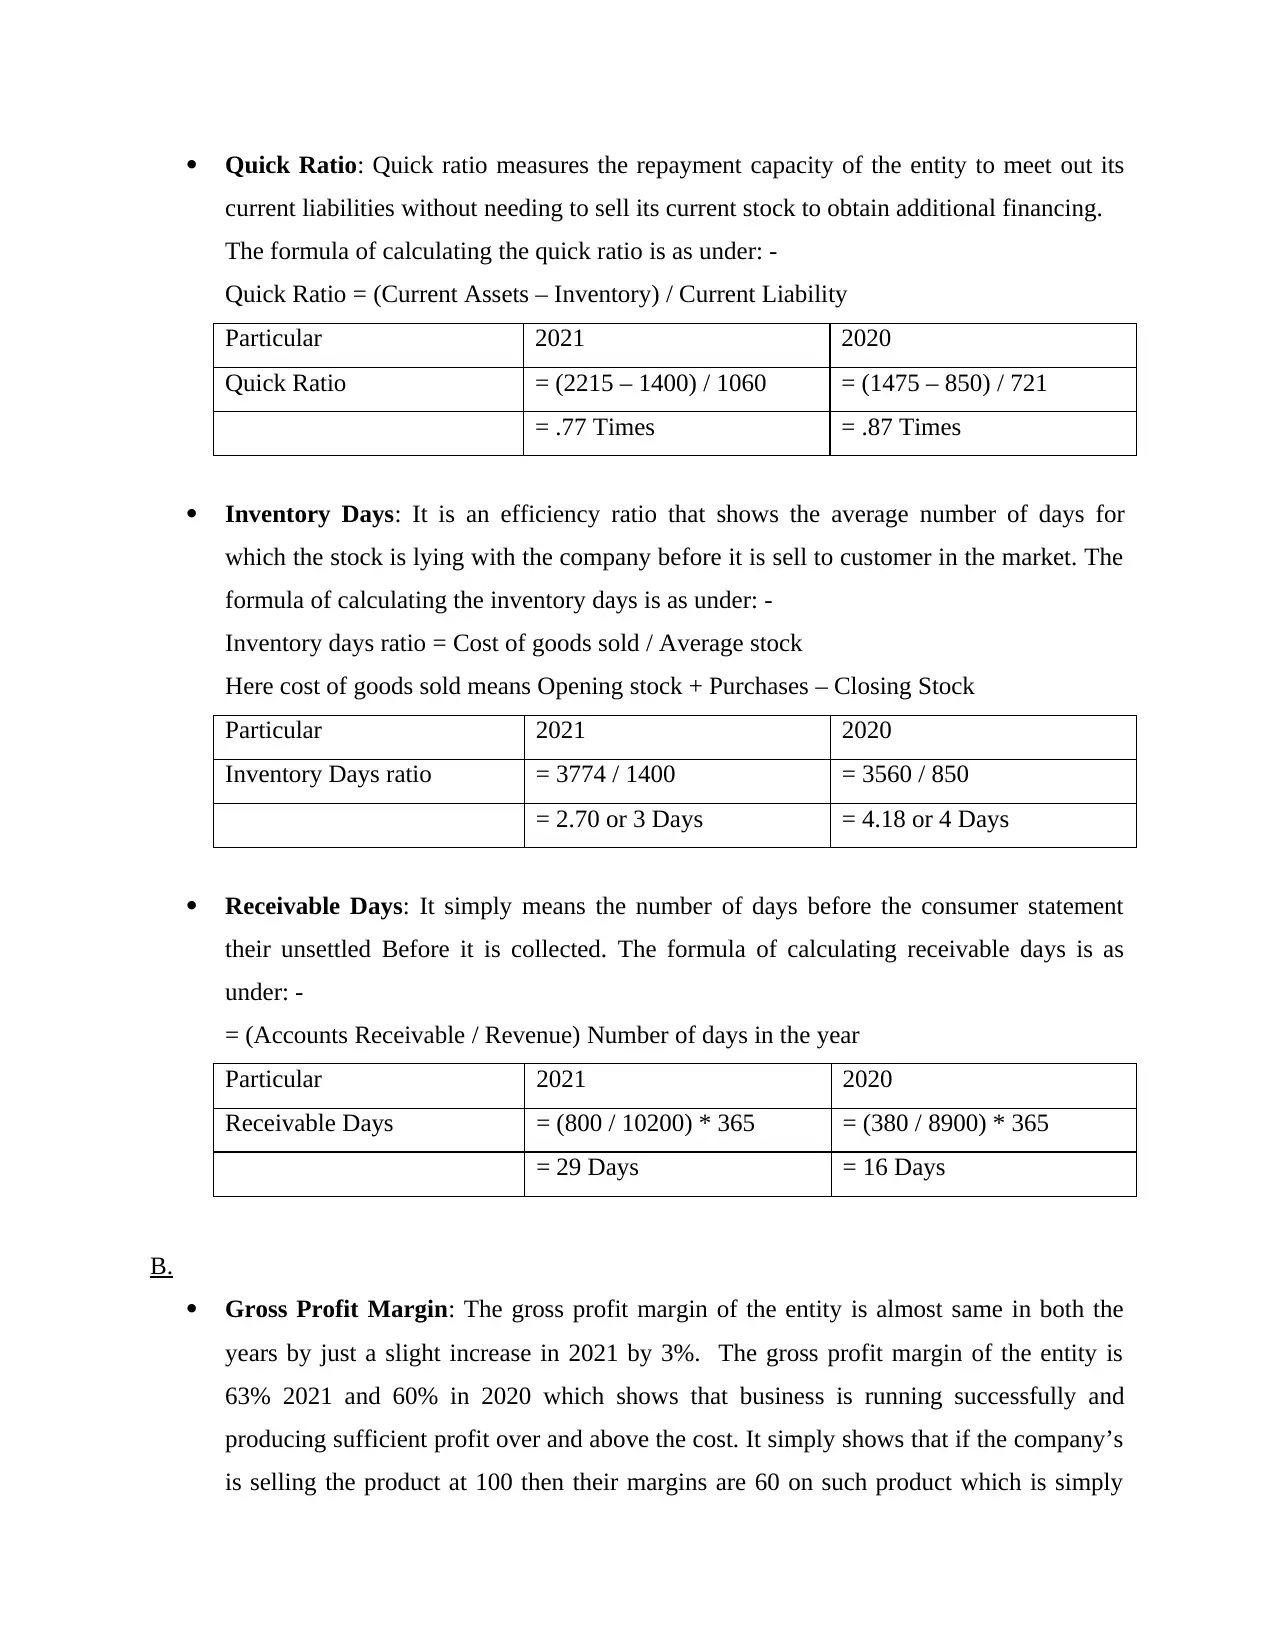
Quick Ratio: Quick ratio measures the repayment capacity of the entity to meet out its
current liabilities without needing to sell its current stock to obtain additional financing.
The formula of calculating the quick ratio is as under: -
Quick Ratio = (Current Assets – Inventory) / Current Liability
Particular 2021 2020
Quick Ratio = (2215 – 1400) / 1060 = (1475 – 850) / 721
= .77 Times = .87 Times
Inventory Days: It is an efficiency ratio that shows the average number of days for
which the stock is lying with the company before it is sell to customer in the market. The
formula of calculating the inventory days is as under: -
Inventory days ratio = Cost of goods sold / Average stock
Here cost of goods sold means Opening stock + Purchases – Closing Stock
Particular 2021 2020
Inventory Days ratio = 3774 / 1400 = 3560 / 850
= 2.70 or 3 Days = 4.18 or 4 Days
Receivable Days: It simply means the number of days before the consumer statement
their unsettled Before it is collected. The formula of calculating receivable days is as
under: -
= (Accounts Receivable / Revenue) Number of days in the year
Particular 2021 2020
Receivable Days = (800 / 10200) * 365 = (380 / 8900) * 365
= 29 Days = 16 Days
B.
Gross Profit Margin: The gross profit margin of the entity is almost same in both the
years by just a slight increase in 2021 by 3%. The gross profit margin of the entity is
63% 2021 and 60% in 2020 which shows that business is running successfully and
producing sufficient profit over and above the cost. It simply shows that if the company’s
is selling the product at 100 then their margins are 60 on such product which is simply
⊘ This is a preview!⊘
Do you want full access?
Subscribe today to unlock all pages.
Trusted by 1+ million students worldwide
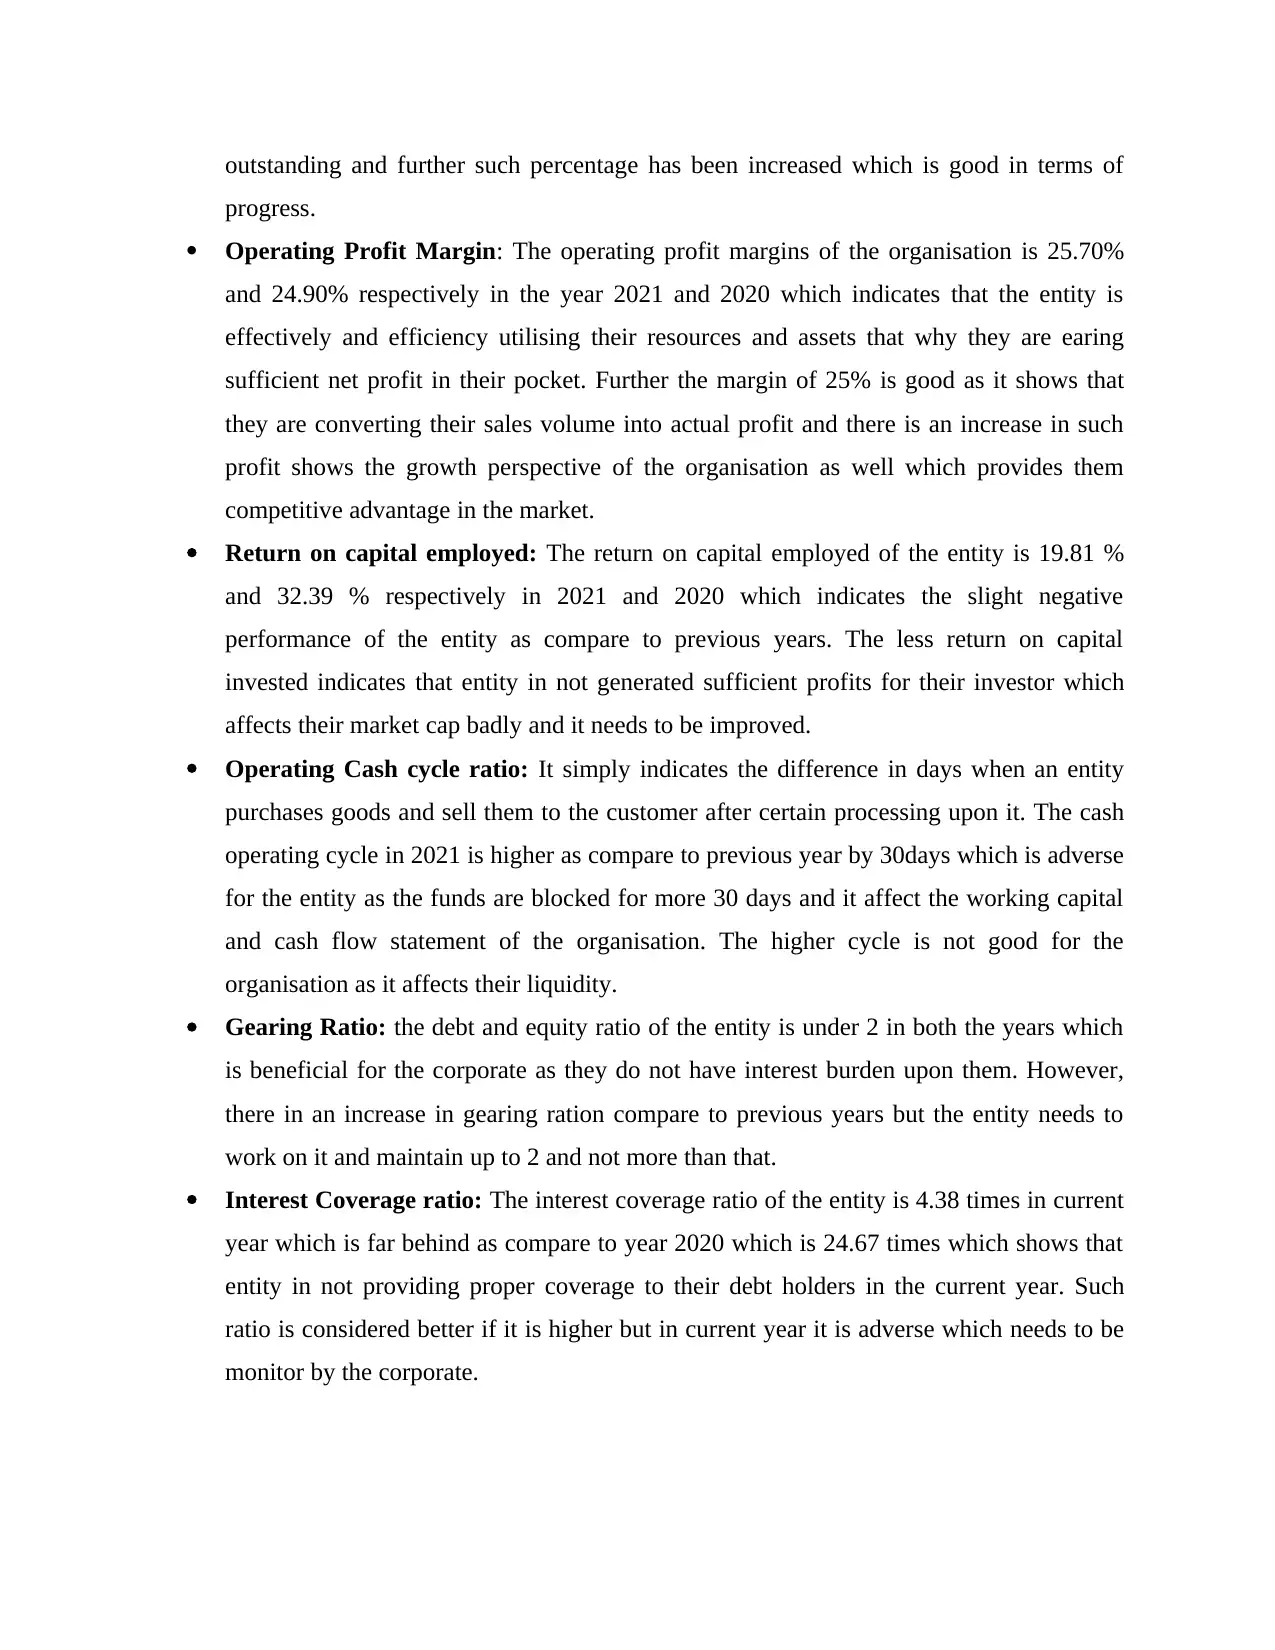
outstanding and further such percentage has been increased which is good in terms of
progress.
Operating Profit Margin: The operating profit margins of the organisation is 25.70%
and 24.90% respectively in the year 2021 and 2020 which indicates that the entity is
effectively and efficiency utilising their resources and assets that why they are earing
sufficient net profit in their pocket. Further the margin of 25% is good as it shows that
they are converting their sales volume into actual profit and there is an increase in such
profit shows the growth perspective of the organisation as well which provides them
competitive advantage in the market.
Return on capital employed: The return on capital employed of the entity is 19.81 %
and 32.39 % respectively in 2021 and 2020 which indicates the slight negative
performance of the entity as compare to previous years. The less return on capital
invested indicates that entity in not generated sufficient profits for their investor which
affects their market cap badly and it needs to be improved.
Operating Cash cycle ratio: It simply indicates the difference in days when an entity
purchases goods and sell them to the customer after certain processing upon it. The cash
operating cycle in 2021 is higher as compare to previous year by 30days which is adverse
for the entity as the funds are blocked for more 30 days and it affect the working capital
and cash flow statement of the organisation. The higher cycle is not good for the
organisation as it affects their liquidity.
Gearing Ratio: the debt and equity ratio of the entity is under 2 in both the years which
is beneficial for the corporate as they do not have interest burden upon them. However,
there in an increase in gearing ration compare to previous years but the entity needs to
work on it and maintain up to 2 and not more than that.
Interest Coverage ratio: The interest coverage ratio of the entity is 4.38 times in current
year which is far behind as compare to year 2020 which is 24.67 times which shows that
entity in not providing proper coverage to their debt holders in the current year. Such
ratio is considered better if it is higher but in current year it is adverse which needs to be
monitor by the corporate.
Paraphrase This Document
Need a fresh take? Get an instant paraphrase of this document with our AI Paraphraser
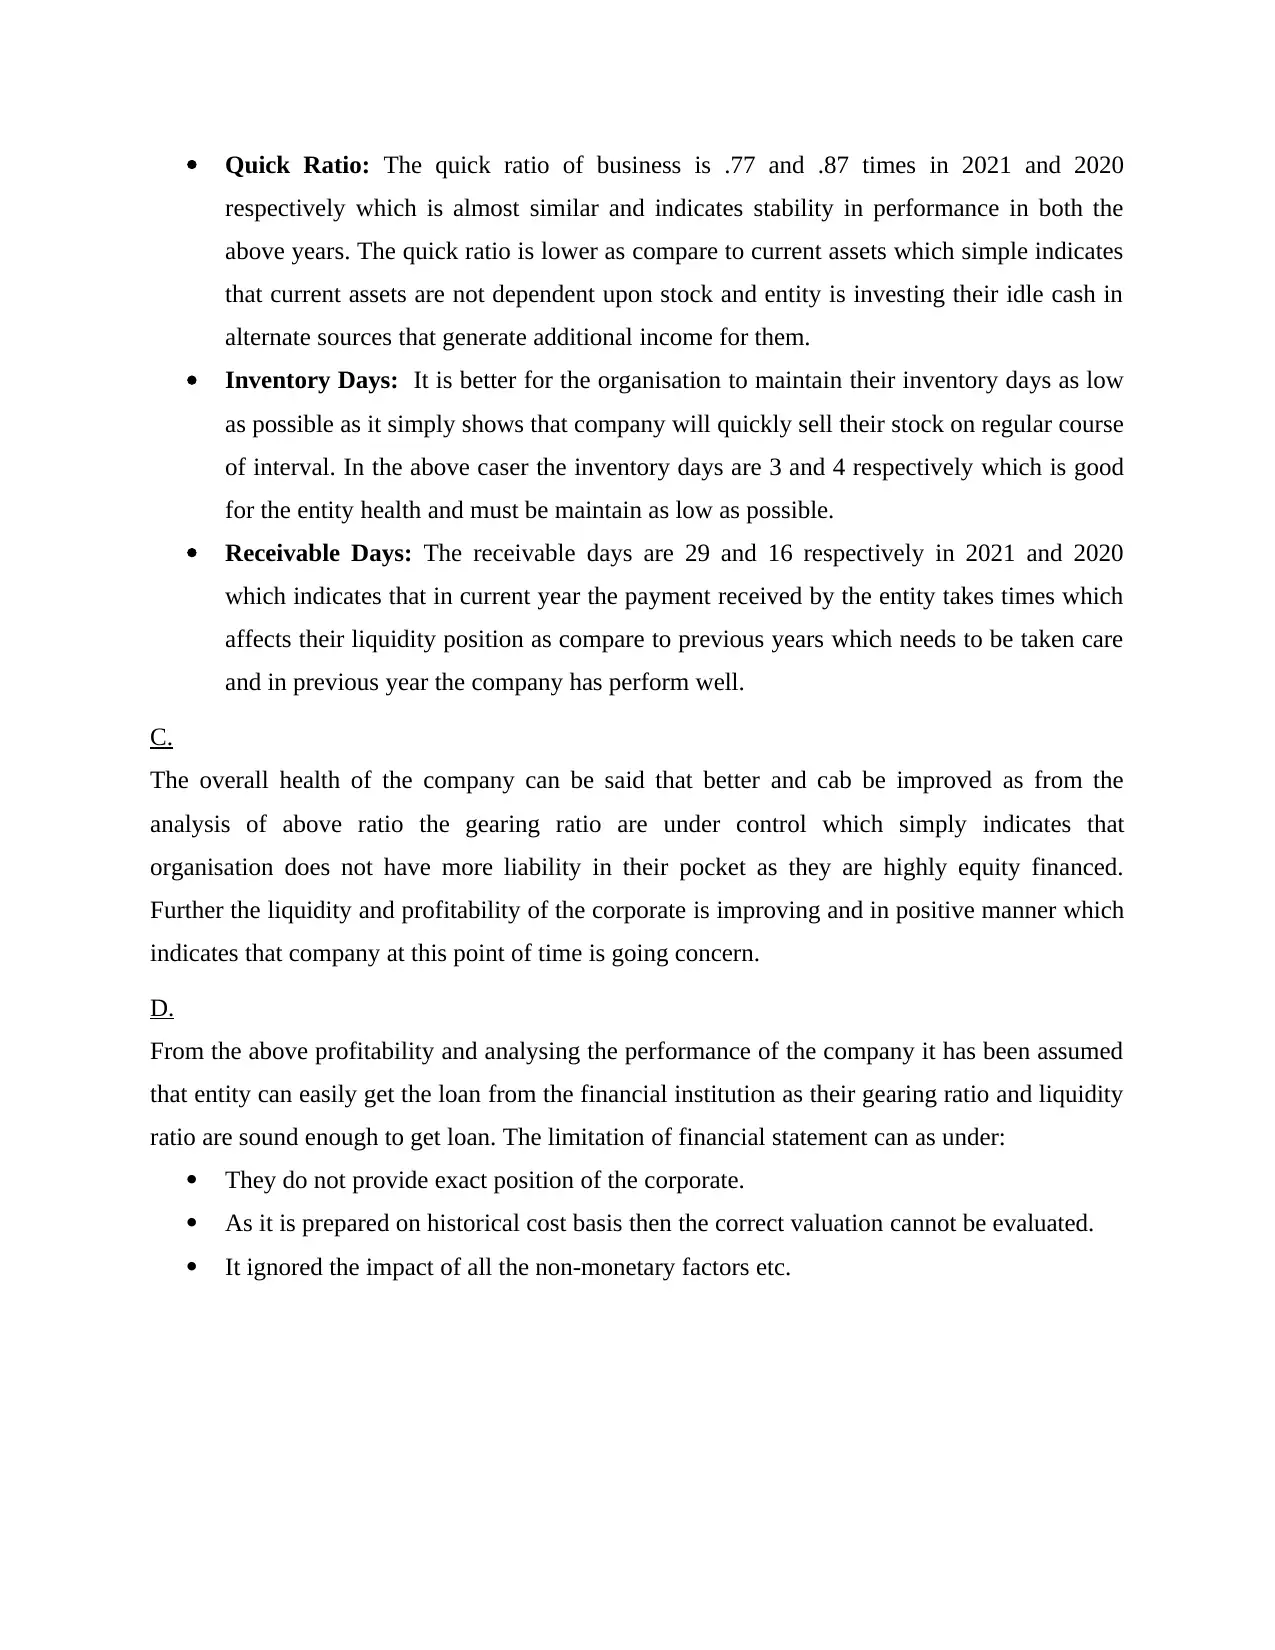
Quick Ratio: The quick ratio of business is .77 and .87 times in 2021 and 2020
respectively which is almost similar and indicates stability in performance in both the
above years. The quick ratio is lower as compare to current assets which simple indicates
that current assets are not dependent upon stock and entity is investing their idle cash in
alternate sources that generate additional income for them.
Inventory Days: It is better for the organisation to maintain their inventory days as low
as possible as it simply shows that company will quickly sell their stock on regular course
of interval. In the above caser the inventory days are 3 and 4 respectively which is good
for the entity health and must be maintain as low as possible.
Receivable Days: The receivable days are 29 and 16 respectively in 2021 and 2020
which indicates that in current year the payment received by the entity takes times which
affects their liquidity position as compare to previous years which needs to be taken care
and in previous year the company has perform well.
C.
The overall health of the company can be said that better and cab be improved as from the
analysis of above ratio the gearing ratio are under control which simply indicates that
organisation does not have more liability in their pocket as they are highly equity financed.
Further the liquidity and profitability of the corporate is improving and in positive manner which
indicates that company at this point of time is going concern.
D.
From the above profitability and analysing the performance of the company it has been assumed
that entity can easily get the loan from the financial institution as their gearing ratio and liquidity
ratio are sound enough to get loan. The limitation of financial statement can as under:
They do not provide exact position of the corporate.
As it is prepared on historical cost basis then the correct valuation cannot be evaluated.
It ignored the impact of all the non-monetary factors etc.

REFERENCES
Books and Journals
Books and Journals
⊘ This is a preview!⊘
Do you want full access?
Subscribe today to unlock all pages.
Trusted by 1+ million students worldwide
1 out of 9

Your All-in-One AI-Powered Toolkit for Academic Success.
+13062052269
info@desklib.com
Available 24*7 on WhatsApp / Email
![[object Object]](/_next/static/media/star-bottom.7253800d.svg)
Unlock your academic potential
Copyright © 2020–2026 A2Z Services. All Rights Reserved. Developed and managed by ZUCOL.