Comprehensive Financial Analysis Report: Glession PLC
VerifiedAdded on  2022/08/25
|10
|1754
|20
Report
AI Summary
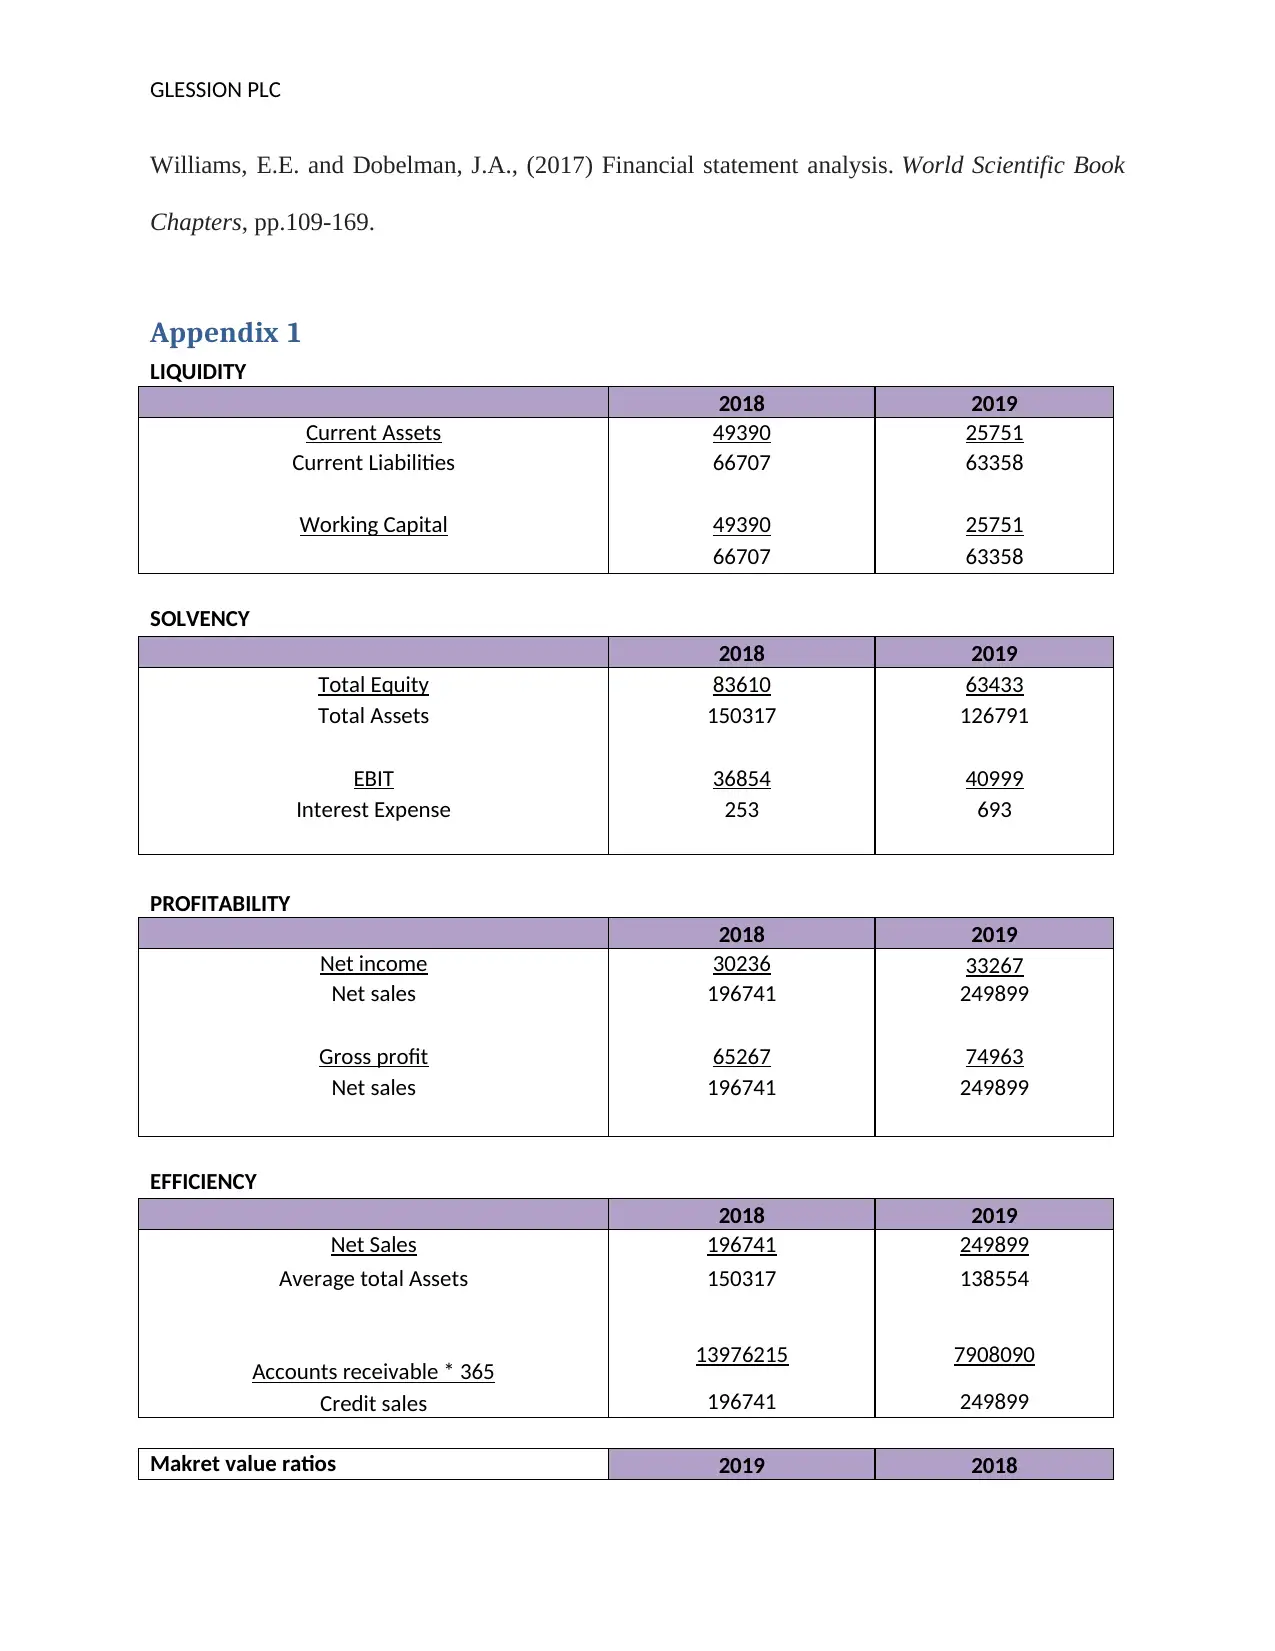
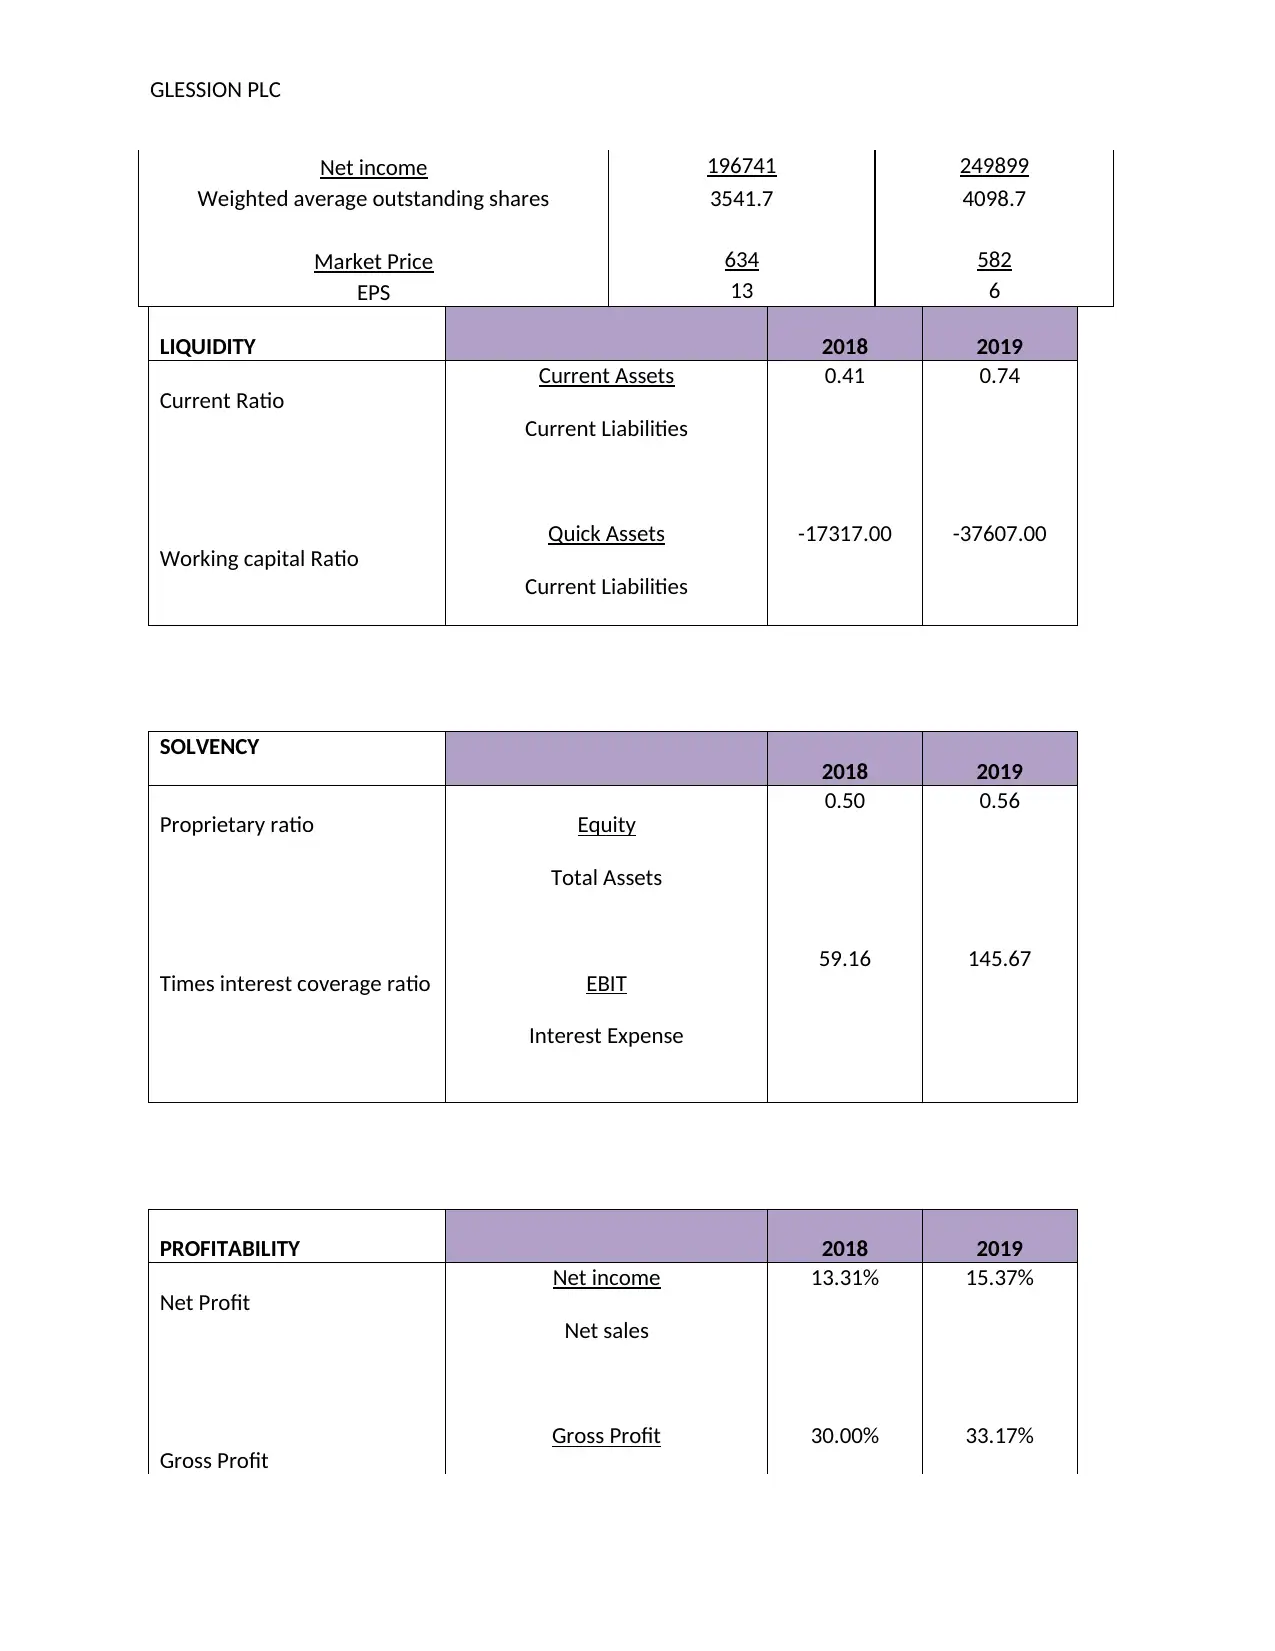
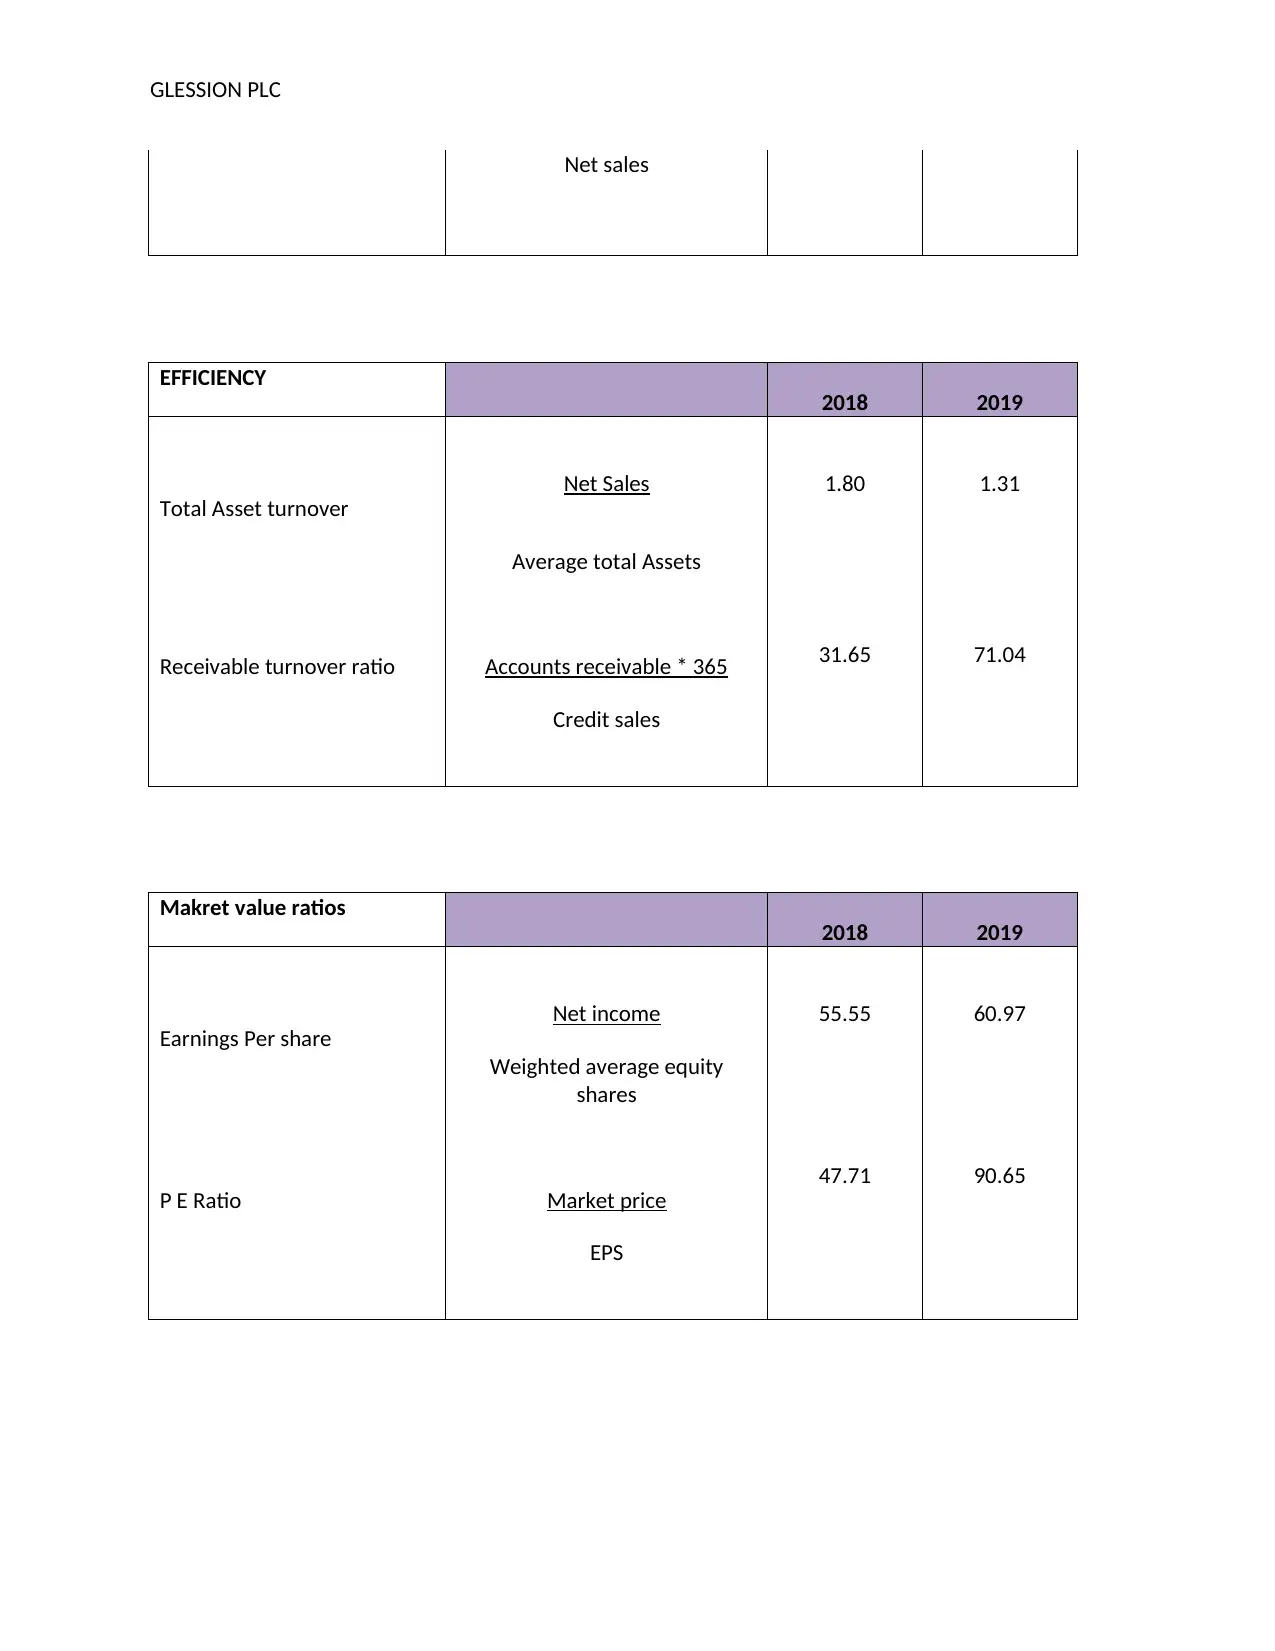
This report offers a comprehensive financial analysis of Glession PLC, a company specializing in urban regeneration and land development. The analysis delves into key financial ratios, including profitability ratios (net profit margin, gross margin), liquidity ratios (current ratio), solvency ratios (proprietary ratio, times interest coverage ratio), shareholder return (earnings per share, P/E ratio), and efficiency ratios (net asset turnover ratio, receivables turnover ratio). The report assesses the company's performance in each of these areas, highlighting strengths, weaknesses, and areas for improvement. The analysis reveals that Glession PLC demonstrates strong performance in profitability and shareholder returns, while areas like liquidity and efficiency require attention. Recommendations are provided, such as improving the accounts receivable ratio and focusing on working capital management. Overall, the report concludes that Glession PLC is a good investment, emphasizing the need for strategic initiatives to optimize its financial health. The report includes financial data from 2018 and 2019 to support the analysis.

Running Head: GLESSION PLC 1
GLESSION PLC
Sabiha Saiyed
500566821
GLESSION PLC
Sabiha Saiyed
500566821
Secure Best Marks with AI Grader
Need help grading? Try our AI Grader for instant feedback on your assignments.

GLESSION PLC
Table of Contents
Introduction.................................................................................................................................................3
Overview of company.................................................................................................................................3
Analysis and Interpretation..........................................................................................................................3
Profitability ratios....................................................................................................................................3
Liquidity ratios........................................................................................................................................4
Working capital.......................................................................................................................................4
Solvency..................................................................................................................................................5
Shareholder return...................................................................................................................................5
Efficiency ratios..........................................................................................................................................6
Overall performance................................................................................................................................6
Conclusion and Recommendations..............................................................................................................6
References...................................................................................................................................................7

GLESSION PLC
Introduction
Financial analysis which is also termed as accounting analysis is a process under which there is a
full assessment of profitability, stability and overall performance of the business. This process is
handled by people apply ratio analysis techniques to get an insight of how well the company is
performing and what measures shall be taken to improve and enhance the performance.
Extracting the information is necessary as the users of the financial statements access the
financial statement to make necessary viable business decisions. In this report, an in-depth
analysis is undertaken of MJ Glession Plc (Ehrhardt and Brigham, 2016).
Overview of company
Founded In the year 1903, one of the most renowned companies specializes in urban
regeneration and land development. This company is listed on London Stock Exchange and since
company was founded by Michael Joseph Gleeson, hence, the name of the company has been
decided as same. The headquarters of the company are situated in Sheffield, South Yorkshire
(Glession Plc, 2019).
Analysis and Interpretation
The financial analysis has been undertaken with respect to different areas and the areas that have
been scrutinized are given below.
Profitability ratios
The profitability ratios are the ratios that help in analyzing the ability of the company to generate
income relative to revenue and settle down the operating costs. The left over are given to the
shareholders and in that case the profitability is analyzed in detail. The ratios that have been

GLESSION PLC
calculated under this category are net profit margin and gross margin. The net profit margin has
been increased from 13.31% to 15.37% and this defines that net profit position of the company
has been increasing. On the other hand, the gross profit ratio is the ratio that defines how well the
company is performing at trading level (Edem, 2017). The gross profit margin have also
increased from 30% to 33.17% and this implies that gross margins if are higher is more efficient
in covering all the costs and hence, overall profitability can be said as smooth and outstanding
and company shall maintain the consistency of the same (Haga, Ittonen, Tronnes and Wong,
2018).
Liquidity ratios
The liquidity ratios are the ratios defines the ability of the company to settle the obligations and
pay back as soon as possible. The liquidity ratios are assessed with the help of the current ratio.
As per the current ratio, it is that metric which is helpful in determining the speed with which the
cash is converted and paid back for the liabilities incurred. The current ratio of Glession PLC it
was 0.41 times and the same increased to 0.74 times and this indicates that company is not able
to meet the target however, the ratio is improving and the company must work on it to make it
even more better by getting rid of the obsolete asset (Uechi, et al 2015).
Working capital
The working capital is the capital that can be understood as a business strategy which is designed
to ensure that a company must focus on supervising current assets and current liabilities. The
current assets of the company are less than the current liabilities and this implies that working
capital requirement is higher for Glession as the working capital tends to be negative. The fact
that current liabilities are higher suggests that company is not able to convert the cash faster and
hence, the liabilities are not able to be settled. In the financial year 2018, the working capital
Secure Best Marks with AI Grader
Need help grading? Try our AI Grader for instant feedback on your assignments.

GLESSION PLC
increased from -17317 to 37607. Hence, the working capital is required for running the normal
business operations (Williams and Dobelman, 2017).
Solvency
Solvency ratios are the ratios that help in measuring the ability of the company to meet debt
obligations and is used by most prospective leaders of the business. The solvency ratio defines
the ability of the cash flow to meet the current liabilities. As per the current scenario it can be
ascertained that proprietary ratios are the ratios that defines how much equity has been acquired
by the business to finance the total assets. The proprietary ratios have increased from 0.50 times
to 0.56 times as the total assets have decreased from and the total equity has been decreased as
well. Times interest coverage ratio has also been identified as the metric to identify solvency as
the ability of the company to settle the financial costs have increased from 59.16 times to 145.67
times as the company has transformed itself to equity based financing (Bornholt, 2017).
Shareholder return
Shareholder returns is one of the important elements to measure the overall performance of the
business as the shareholder’s returns is the ultimate answer to what remains with the company
and how much it can cater to its investors and shareholders as they are the ultimate promoters of
Glession PLC. Earnings per share has been the best measure to figure out how much
shareholders can per share and from the results it is evident that earnings per share have also
increased stating the shareholders will get 660.97 per share in the year 2019, rather than 55.55 as
it was last year. P/E ratio also adds to the shareholder’s return and higher the ratio the more
efficient the Glession will be and therefore, overall in terms of shareholder returns, company is
performing well (Boyas and Teeter, 2017).

GLESSION PLC
Efficiency ratios
The efficiency ratios are also crucial as they give knowledge about the conversion of cash and
accounts receivable ratio and net asset turnover ratio have been analyzed for the same
perspective. The net asset turnover ratio decreased from 1.80 times to 1.31 times as the assets are
being utilized, but not effectively. Receivables turnover ratio has also been increased which is
not a good sign as earlier only 31.65 days were taken to collect cash and now the situation is
more than double at 71.04 days. This implies that Glession PLC must focus on being efficient
and effective as well.
Overall performance
Above analysis determines that Glession PLC, is operating well and can improve areas like
liquidity and efficiency to cover all the weaknesses and strengthen itself with the help of some
initiatives and strategies.
Conclusion and Recommendations
The above situation simply states that Glession PLC is a good share to invest in and it is also
recommend to the company to improve accounts receivable ratio by reducing the credit terms,
and can also improve working capital by increasing the cash collection and focusing on long
term liabilities more so that it can cover the working capital scenario easily. Glession must make
use of new technology and shall focus on diversifying the services to attract more income.
Overall profitability, solvency and shareholders returns are the top notch areas which are plus
point of Glession. Henceforth, company must take initiative to be secured and strong from all
areas.

GLESSION PLC
References
Bornholt, G. (2017) What is an Investment Project's Implied Rate of Return?. Abacus, 53(4), pp
513-526.
Boyas, E., and Teeter, R. (2017) Teaching Financial Ratio Analysis using XBRL. In
Developments in Business Simulation and Experiential Learning: Proceedings of the Annual
ABSEL conference (Vol. 44, No. 1).
Edem, D. B. (2017) Liquidity Management and Performance of Deposit Money Banks in Nigeria
(1986–2011): An Investigation. International Journal of Economics, Finance and Management
Sciences, 5(3), pp 146-161.
Ehrhardt, M.C. and Brigham, E.F., (2016) Corporate finance: A focused approach. Cengage
learning.
Glession Plc, (2019) Annual report [Online] Available from https://www.mjgleesonplc.com/wp-
content/themes/mj-gleeson/img/report-and-accounts-home-2019.pdf [Accessed on 21st March
2020]
Haga, J., Ittonen, K., Tronnes, P.C. and Wong, L., (2018) Is earnings management sensitive to
discount rates?. Journal of Accounting Literature, 41, pp.75-88.
Uechi, L., Akutsu, T., Stanley, H.E., Marcus, A.J. and Kenett, D.Y., (2015) Sector dominance
ratio analysis of financial markets. Physica A: Statistical Mechanics and its Applications, 421,
pp.488-509.
Paraphrase This Document
Need a fresh take? Get an instant paraphrase of this document with our AI Paraphraser

GLESSION PLC
Williams, E.E. and Dobelman, J.A., (2017) Financial statement analysis. World Scientific Book
Chapters, pp.109-169.
Appendix 1
LIQUIDITY
2018 2019
Current Assets 49390 25751
Current Liabilities 66707 63358
Working Capital 49390 25751
66707 63358
SOLVENCY
2018 2019
Total Equity 83610 63433
Total Assets 150317 126791
EBIT 36854 40999
Interest Expense 253 693
PROFITABILITY
2018 2019
Net income 30236 33267
Net sales 196741 249899
Gross profit 65267 74963
Net sales 196741 249899
EFFICIENCY
2018 2019
Net Sales 196741 249899
Average total Assets 150317 138554
Accounts receivable * 365 13976215 7908090
Credit sales 196741 249899
Makret value ratios 2019 2018

GLESSION PLC
Net income 196741 249899
Weighted average outstanding shares 3541.7 4098.7
Market Price 634 582
EPS 13 6
LIQUIDITY 2018 2019
Current Ratio
Current Assets 0.41 0.74
Current Liabilities
Working capital Ratio
Quick Assets -17317.00 -37607.00
Current Liabilities
SOLVENCY
2018 2019
Proprietary ratio Equity
0.50 0.56
Total Assets
Times interest coverage ratio EBIT
59.16 145.67
Interest Expense
PROFITABILITY 2018 2019
Net Profit
Net income 13.31% 15.37%
Net sales
Gross Profit
Gross Profit 30.00% 33.17%

GLESSION PLC
Net sales
EFFICIENCY
2018 2019
Total Asset turnover
Net Sales 1.80 1.31
Average total Assets
Receivable turnover ratio Accounts receivable * 365 31.65 71.04
Credit sales
Makret value ratios
2018 2019
Earnings Per share
Net income 55.55 60.97
Weighted average equity
shares
P E Ratio Market price
47.71 90.65
EPS
1 out of 10
Related Documents

Your All-in-One AI-Powered Toolkit for Academic Success.
 +13062052269
info@desklib.com
Available 24*7 on WhatsApp / Email
Unlock your academic potential
© 2024  |  Zucol Services PVT LTD  |  All rights reserved.