BI4141 Assignment: Analyzing Global Biodiversity Concepts and Threats
VerifiedAdded on 2023/04/21
|14
|2774
|68
Homework Assignment
AI Summary
This assignment is a completed worksheet that delves into the concepts and threats associated with global biodiversity. The student addresses questions on species conservation status, the rarity of species, extinction events (like the trilobites), endemic species in Mexico, and global biodiversity hotspots. The assignment further explores ecosystem valuation, oceanic islands, and speciation processes (sympatric, allopatric, and parapatric). Additionally, it examines invasive species and anthropogenic extinction, followed by an analysis of species richness and diversity on Hilbre Island and Caerlaverock, and a comparison of bird species richness between Mu and Marunga islands using statistical tests. The document also includes regression analyses to explain the difference in the number of bird species across the Caribbean and North and Central America, considering factors like latitude and area, and references relevant research papers to support the findings.
RUNNING HEADER: GLOBAL BIODIVERSITY: CONCEPTS AND THREATS 1
Global Biodiversity: Concepts and Threats
Student’s name:
Student’s ID:
Institution:
Global Biodiversity: Concepts and Threats
Student’s name:
Student’s ID:
Institution:
Paraphrase This Document
Need a fresh take? Get an instant paraphrase of this document with our AI Paraphraser
Global Biodiversity: Concepts and Threats 2
Section 1
1)
According to Butchart et al., (2018) the Madagascar Pochard (Aythya innotata) which was
assumed to be extinct in the late 1990s, is an extremely rare diving duck of the genus Aythya
which lives in the wetlands of Madagascar specifically at Lake Sofia and Lake Matsaborimena.
According to the International Union for Conservation of Nature (IUCN), the bird species is
classified as critically endangered.
2)
The statement that most species are rare is true. Novotny & Basset (2000) suggest that the
appearance of rare species is as a result of a combination of locally and globally rare effects.
Case in point, one can see each species in abundance in one particular niche but in low
abundance in another niche. This can be attributed to dispersal. Thus, on a larger scale, there are
some dominant species but the majority of the species are at a low abundance overall.
3)
Trilobites are one of the earliest known groups of arthropods. At the end of the Permian, during
the mass extinction (about 252 million years ago), they became extinct (Zhu et al., 2004).
4)
The climate of Mexico has enabled the country to be hospitable for all kinds of varied species
(Eades et al., 2010). Three species that are endemic to Mexico are Flat-headed Myotis, Cozumel
Thrasher, and Great Peeing Frog.
Global Biodiversity: Concepts and Threats 3
5)
A biodiversity hotspot is a region that has vascular plants of at least 1,500 which are endemic
and must have its original natural vegetation at 30% or less (Renema et al., 2008). Globally,
there are 35 areas which qualify as biodiversity hotspots. Three examples include the East
Melanesian Islands, Indo-Burma and Guinean Forests of West Africa.
6)
A team of researchers together with ecologist Robert Constanza conducted a research in 1997
which showed that the Earth’s ecosystem service is worth around $33 trillion (valued at $48.7
trillion dollars curently) (Farber, Constanza & Wilson, 2002). However, the team came back
with new finding and placed the estimate at $142.7 trillion annually (Rosen, 2014).
7)
Oceanic Islands are those islands which rise to the surface from the floors of the ocean basins
(Carvajal-Endara et al., 2017). An example of an oceanic island is the Tristan da Cunha. An
endemic species found in this island is the Tristan rock lobster.
8)
Sympatric speciation is a speciation which happens when two groups of the same species evolve
differently though they live in the same geographic location to a point where they are considered
different species since they cannot interbreed (Cooney et al., 2017). This speciation has been
observed in bacteria, namely between Synechococcus and Bacillus species of bacteria.
Allopatric speciation occurs when two populations of the same species become isolated from
each other as a result of geographic changes (Cooney et al., 2017). An example of this speciation
⊘ This is a preview!⊘
Do you want full access?
Subscribe today to unlock all pages.
Trusted by 1+ million students worldwide
Global Biodiversity: Concepts and Threats 4
is the speciation which occurred in the Galapagos finches which were studied by Charles
Darwin.
Parapatric speciation happens when a smaller population is isolated usually to the periphery of
the large group thereby becoming differentiated to the point of becoming a new species (Cooney
et al., 2017). An example is the population of the grass Agrostis tenuis which span normal soils
and mine tailings.
9)
An invasive species is any kind of living organisms which are not native to an ecosystem and
causes harm (Stricker et al., 2016). An example is the water hyacinth. It forms a dense mat in the
wild thereby reducing sunlight for aquatic animals and submerged plants hence crowding out
native aquatic plants, and clogging intake pipes and waterways.
10)
Anthropogenic extinction of species is the extinction of species due to human activity (Ceballos
et al., 2015). The primary causes of anthropogenic extinction of species are overexploitation,
pollution, land development, introduction and species translocations.
Section 2
Hilbre Island and Caerlaverock
Species richness is the species count and does not take into account the richness of the species or
their relative distributions in abundance. The richness in species for Hilbre Island and
Paraphrase This Document
Need a fresh take? Get an instant paraphrase of this document with our AI Paraphraser
Global Biodiversity: Concepts and Threats 5
Caerlaverock is 95 and 91 respectively. On the other hand, species diversity takes into account
both species evenness and species richness. To determine species diversity, the Simpsons
diversity index is used. The formula used is:
D = ∑(n/N)2
The bird species chosen is the Eurasian Oystercatcher with a population of 5,000 in Hilbre Island
and 1,000 at Caerlaverock. The species diversity for this bird in the two islands are;
Hilbre Island = (5000/9370)2 = 0.285
Caerlaverock = (1000/25073)2 = 0.002
Since the species diversity index is close to 0 in the two islands, then it can be concluded that
there is infinite diversity for Eurasian Oystercatcher especially in Caerlavrock island.
It should be noted that the Simpsons diversity index was used since it undertakes that the
proportion of individuals in an area is an indication of their diversity importance (Ke et al.,
2017).
Hornbills in Papua New Guinea
A t-test (dependent sample t-test) was conducted to establish if there was a difference in richness
of species between two islands. The islands were Mu and Marunga. A t-test was the most
appropriate since it is used in determining whether the mean difference between two sets of
observations is zero. The following hypothesis was developed.
H0: There is no difference in species richness between the two islands
H1: There is a difference in species richness between the two islands
Global Biodiversity: Concepts and Threats 6
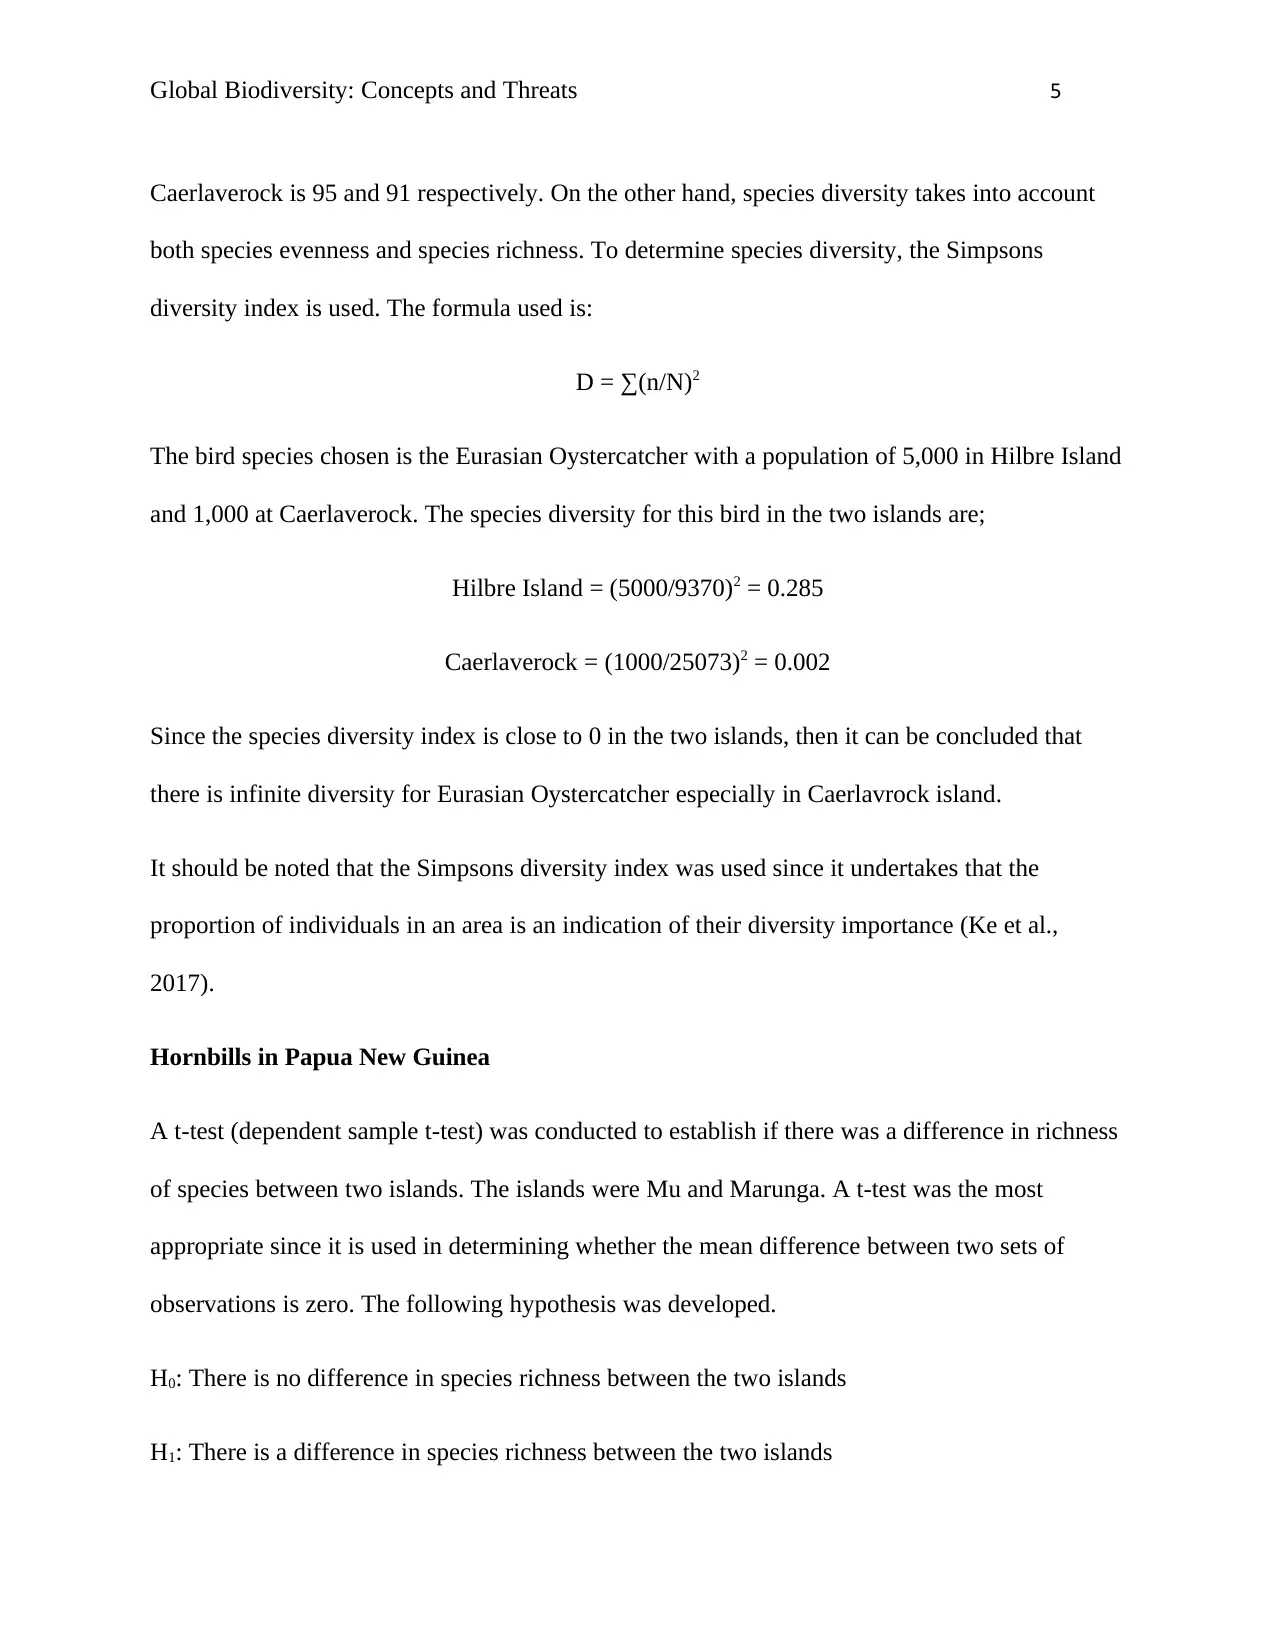
The assumption made when carrying out the dependent sample t-test is that the dependent
variable were continuous, the dependent variables did not contain any outliers, the observations
were independent of one another, and that the dependent variables were approximately normally
distributed. It is evident that the data is numeric and continuous since they take a value between
1 and 20. Since it can be safely assumed that the data was collected randomly without
replacement, then there is the independence of observations.
Figure 1: Mu histogram
⊘ This is a preview!⊘
Do you want full access?
Subscribe today to unlock all pages.
Trusted by 1+ million students worldwide
Global Biodiversity: Concepts and Threats 7
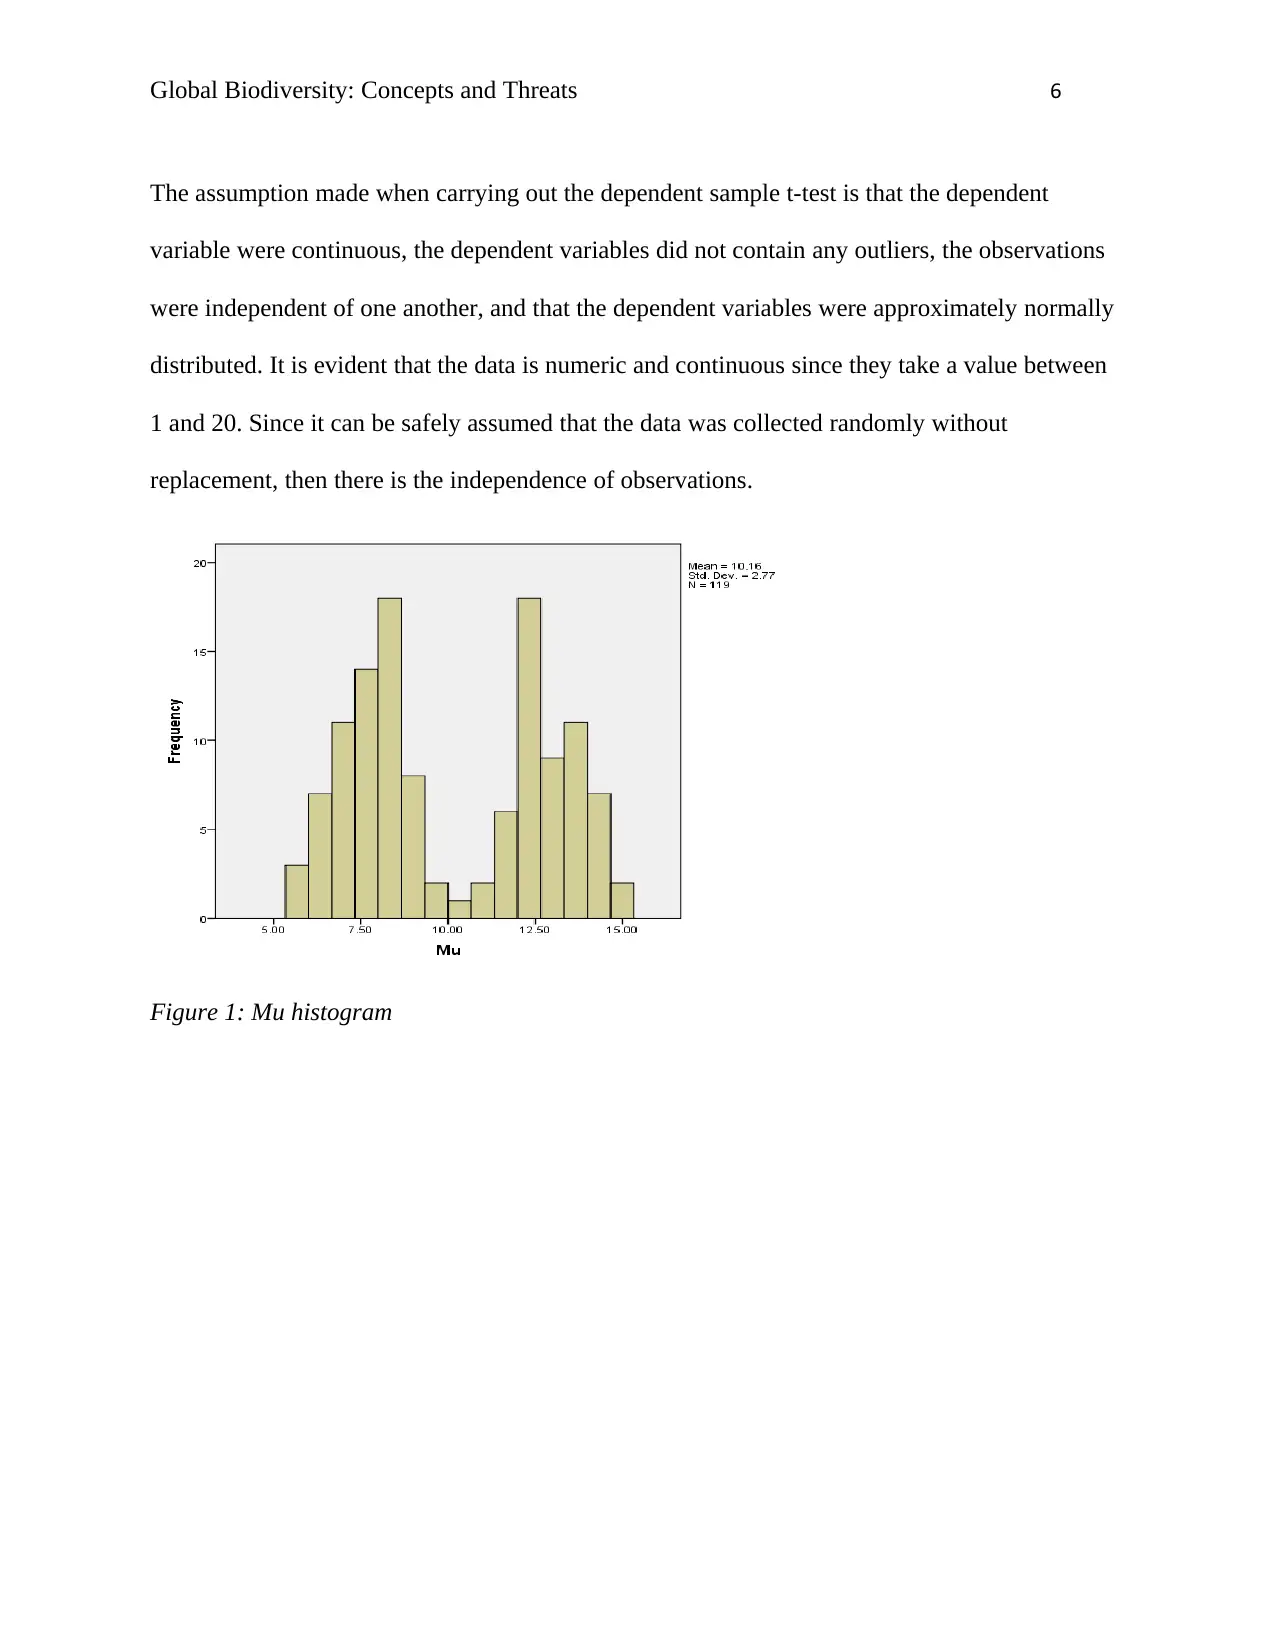
Figure 2: Marunga histogram
From figure 1 and 2, it can be seen that the data for Mu and Marunga are not normally
distributed. Though this violates the assumption that the data should be normally distributed, the
t-test was still carried out.
Mu Marunga
0
10
20
30
40
50
60
70
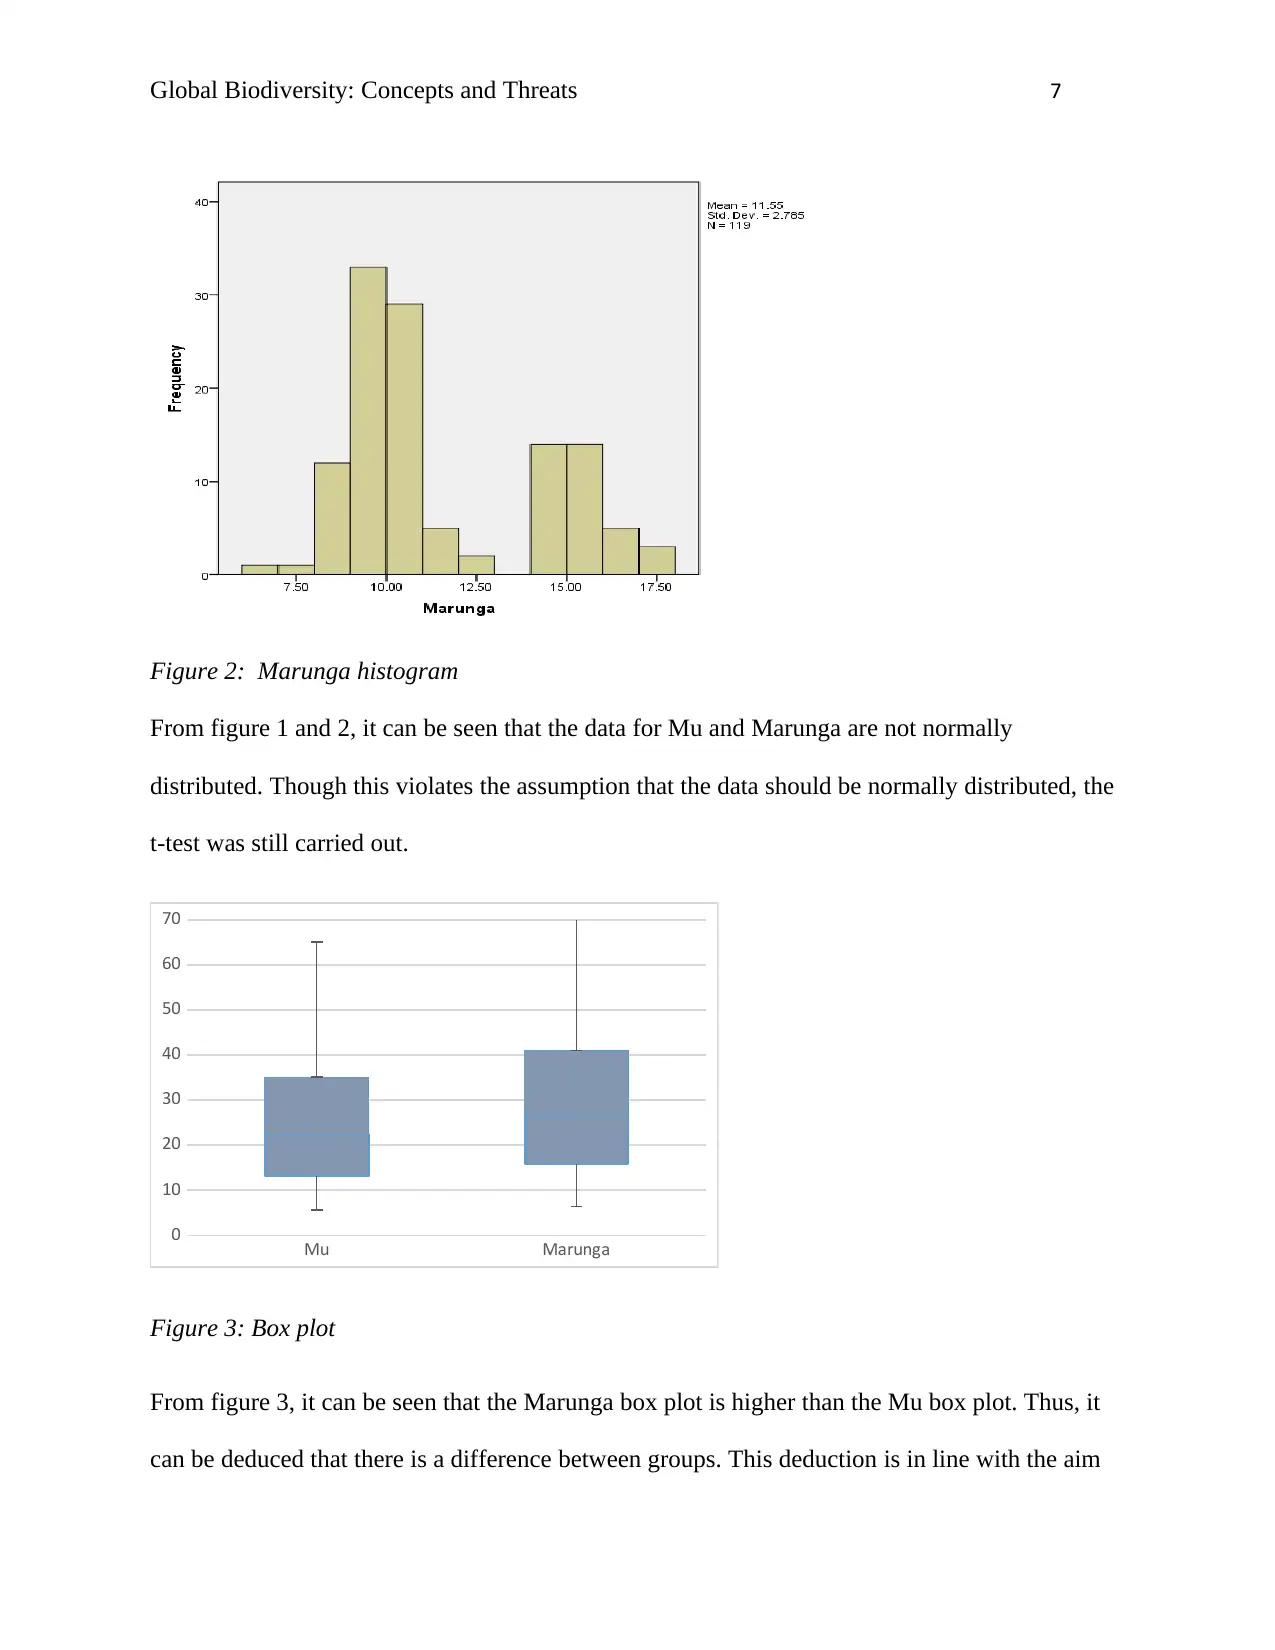
Figure 3: Box plot
From figure 3, it can be seen that the Marunga box plot is higher than the Mu box plot. Thus, it
can be deduced that there is a difference between groups. This deduction is in line with the aim
Figure 2: Marunga histogram
From figure 1 and 2, it can be seen that the data for Mu and Marunga are not normally
distributed. Though this violates the assumption that the data should be normally distributed, the
t-test was still carried out.
Mu Marunga
0
10
20
30
40
50
60
70
Figure 3: Box plot
From figure 3, it can be seen that the Marunga box plot is higher than the Mu box plot. Thus, it
can be deduced that there is a difference between groups. This deduction is in line with the aim
Paraphrase This Document
Need a fresh take? Get an instant paraphrase of this document with our AI Paraphraser
Global Biodiversity: Concepts and Threats 8
of the dependent sample t-test of determining whether there was a difference in species richness
between two islands.
The paired sample t-test was carried out using SPSS. The results are as shown below:
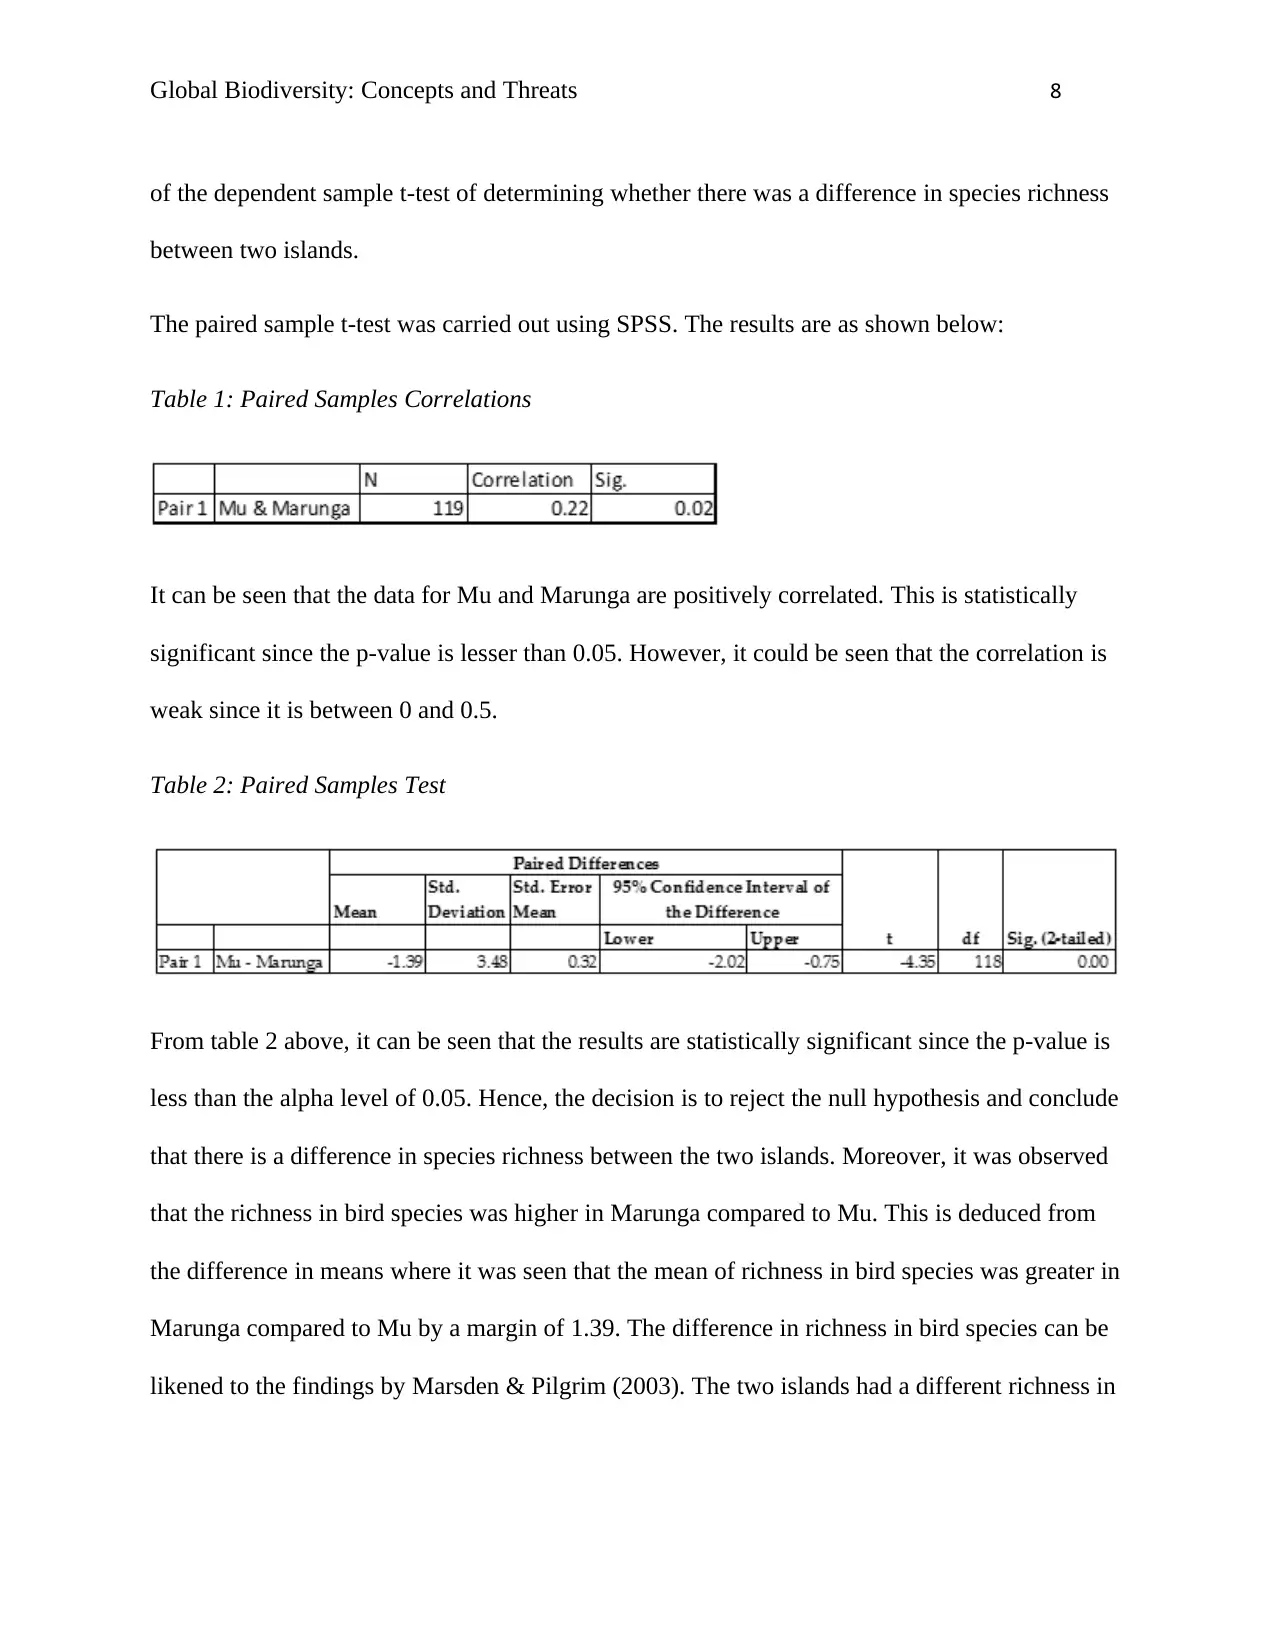
Table 1: Paired Samples Correlations
It can be seen that the data for Mu and Marunga are positively correlated. This is statistically
significant since the p-value is lesser than 0.05. However, it could be seen that the correlation is
weak since it is between 0 and 0.5.
Table 2: Paired Samples Test
From table 2 above, it can be seen that the results are statistically significant since the p-value is
less than the alpha level of 0.05. Hence, the decision is to reject the null hypothesis and conclude
that there is a difference in species richness between the two islands. Moreover, it was observed
that the richness in bird species was higher in Marunga compared to Mu. This is deduced from
the difference in means where it was seen that the mean of richness in bird species was greater in
Marunga compared to Mu by a margin of 1.39. The difference in richness in bird species can be
likened to the findings by Marsden & Pilgrim (2003). The two islands had a different richness in
of the dependent sample t-test of determining whether there was a difference in species richness
between two islands.
The paired sample t-test was carried out using SPSS. The results are as shown below:
Table 1: Paired Samples Correlations
It can be seen that the data for Mu and Marunga are positively correlated. This is statistically
significant since the p-value is lesser than 0.05. However, it could be seen that the correlation is
weak since it is between 0 and 0.5.
Table 2: Paired Samples Test
From table 2 above, it can be seen that the results are statistically significant since the p-value is
less than the alpha level of 0.05. Hence, the decision is to reject the null hypothesis and conclude
that there is a difference in species richness between the two islands. Moreover, it was observed
that the richness in bird species was higher in Marunga compared to Mu. This is deduced from
the difference in means where it was seen that the mean of richness in bird species was greater in
Marunga compared to Mu by a margin of 1.39. The difference in richness in bird species can be
likened to the findings by Marsden & Pilgrim (2003). The two islands had a different richness in
Global Biodiversity: Concepts and Threats 9
species due to different food sources such as fruits and flowers, forest densities, the density of
nest cavities, forest alteration (Marsden & Pilgrim, 2003).
Bird species in the Americas
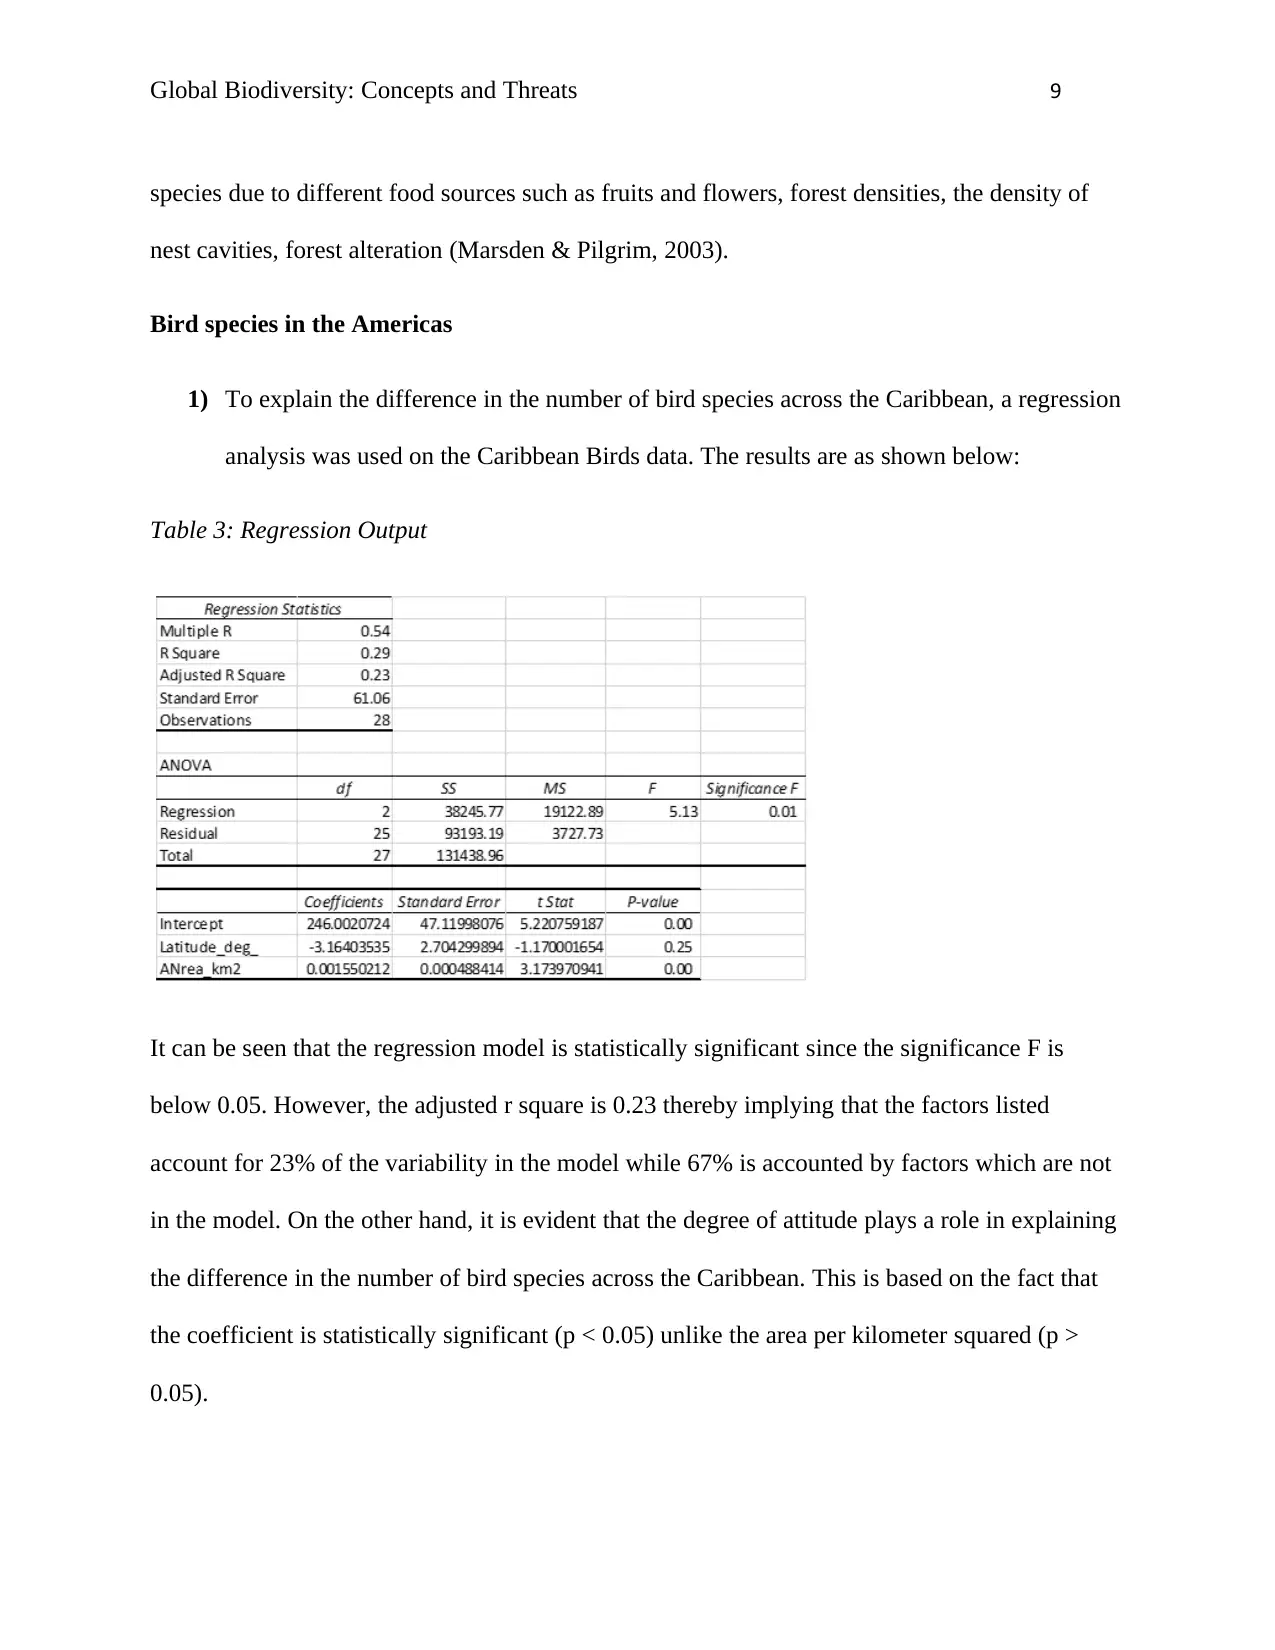
1) To explain the difference in the number of bird species across the Caribbean, a regression
analysis was used on the Caribbean Birds data. The results are as shown below:
Table 3: Regression Output
It can be seen that the regression model is statistically significant since the significance F is
below 0.05. However, the adjusted r square is 0.23 thereby implying that the factors listed
account for 23% of the variability in the model while 67% is accounted by factors which are not
in the model. On the other hand, it is evident that the degree of attitude plays a role in explaining
the difference in the number of bird species across the Caribbean. This is based on the fact that
the coefficient is statistically significant (p < 0.05) unlike the area per kilometer squared (p >
0.05).
species due to different food sources such as fruits and flowers, forest densities, the density of
nest cavities, forest alteration (Marsden & Pilgrim, 2003).
Bird species in the Americas
1) To explain the difference in the number of bird species across the Caribbean, a regression
analysis was used on the Caribbean Birds data. The results are as shown below:
Table 3: Regression Output
It can be seen that the regression model is statistically significant since the significance F is
below 0.05. However, the adjusted r square is 0.23 thereby implying that the factors listed
account for 23% of the variability in the model while 67% is accounted by factors which are not
in the model. On the other hand, it is evident that the degree of attitude plays a role in explaining
the difference in the number of bird species across the Caribbean. This is based on the fact that
the coefficient is statistically significant (p < 0.05) unlike the area per kilometer squared (p >
0.05).
⊘ This is a preview!⊘
Do you want full access?
Subscribe today to unlock all pages.
Trusted by 1+ million students worldwide
Global Biodiversity: Concepts and Threats 10
Hence, a unit increase in the degree of latitude leads to a 3.16 decrease in the number of bird
species across the Caribbean. Thus, low latitude areas have the highest number of birds
compared to the high areas.
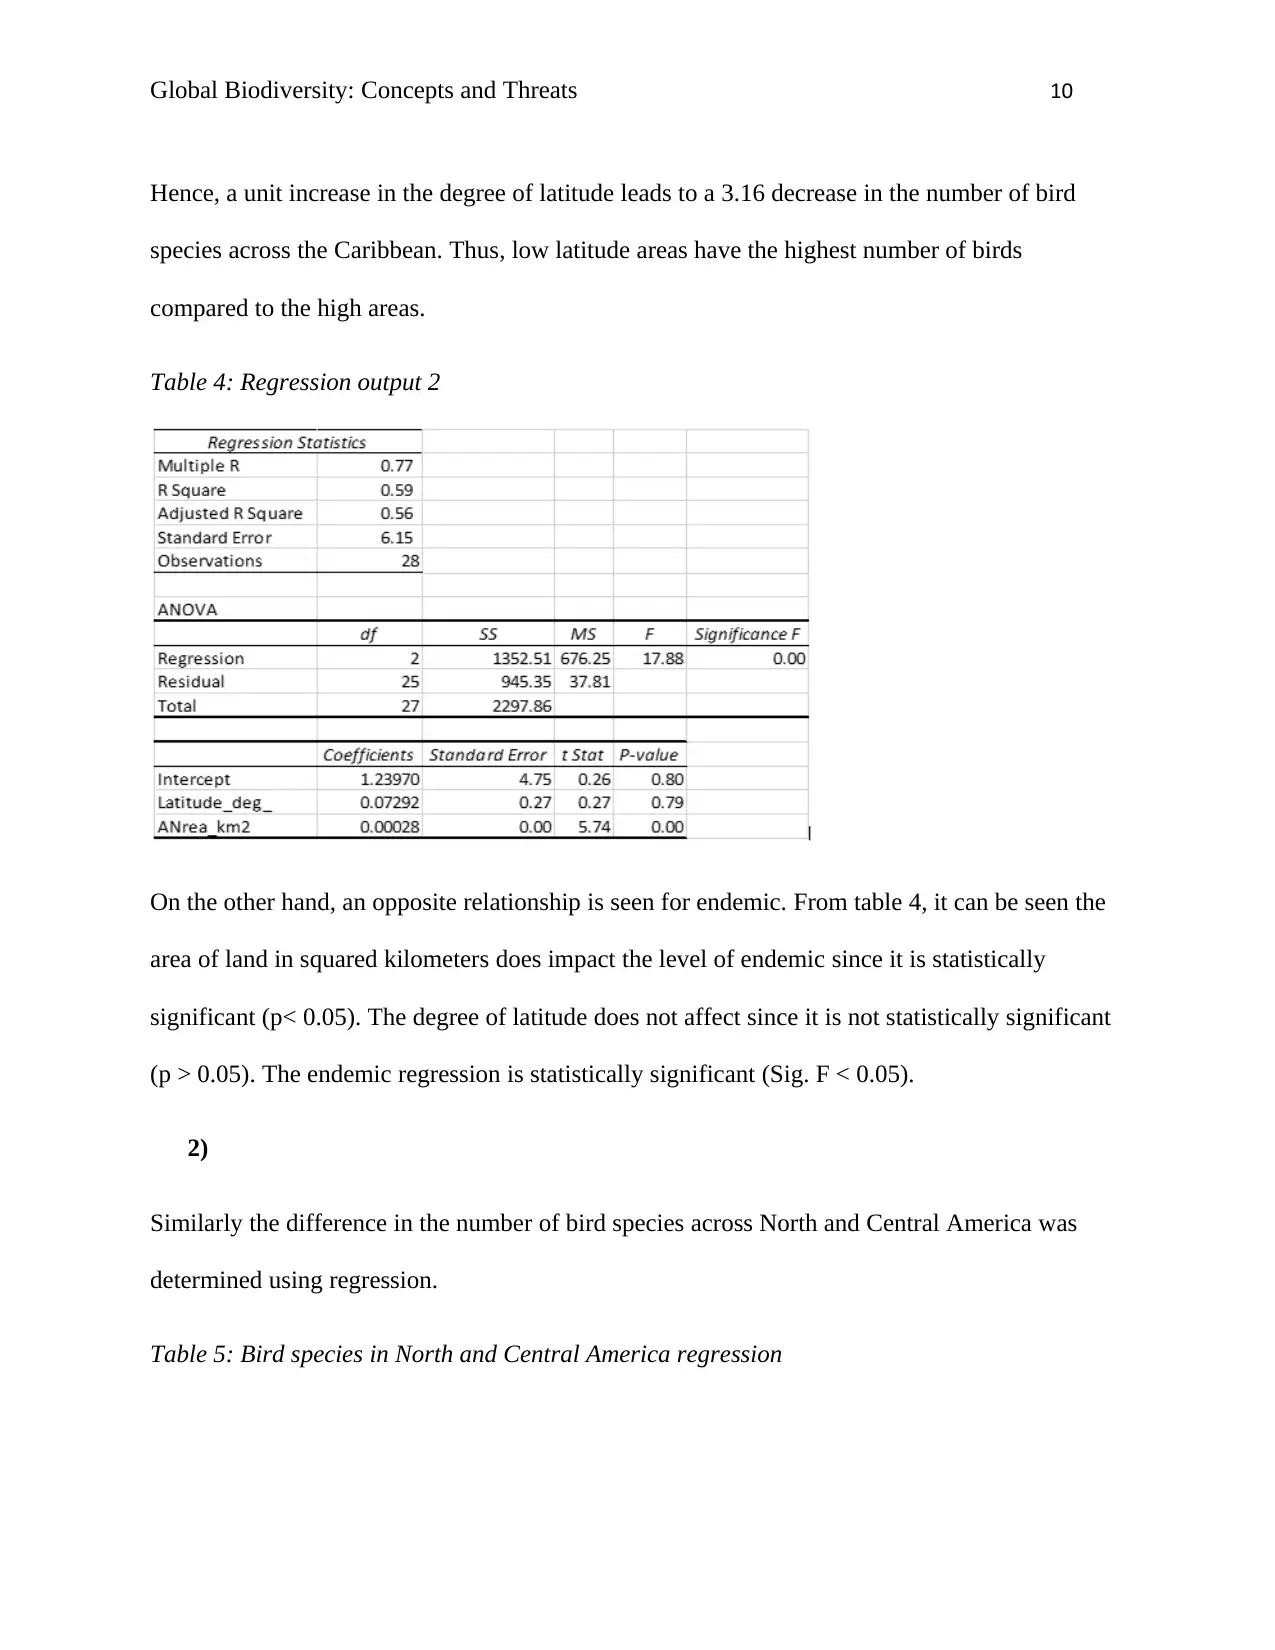
Table 4: Regression output 2
On the other hand, an opposite relationship is seen for endemic. From table 4, it can be seen the
area of land in squared kilometers does impact the level of endemic since it is statistically
significant (p< 0.05). The degree of latitude does not affect since it is not statistically significant
(p > 0.05). The endemic regression is statistically significant (Sig. F < 0.05).
2)
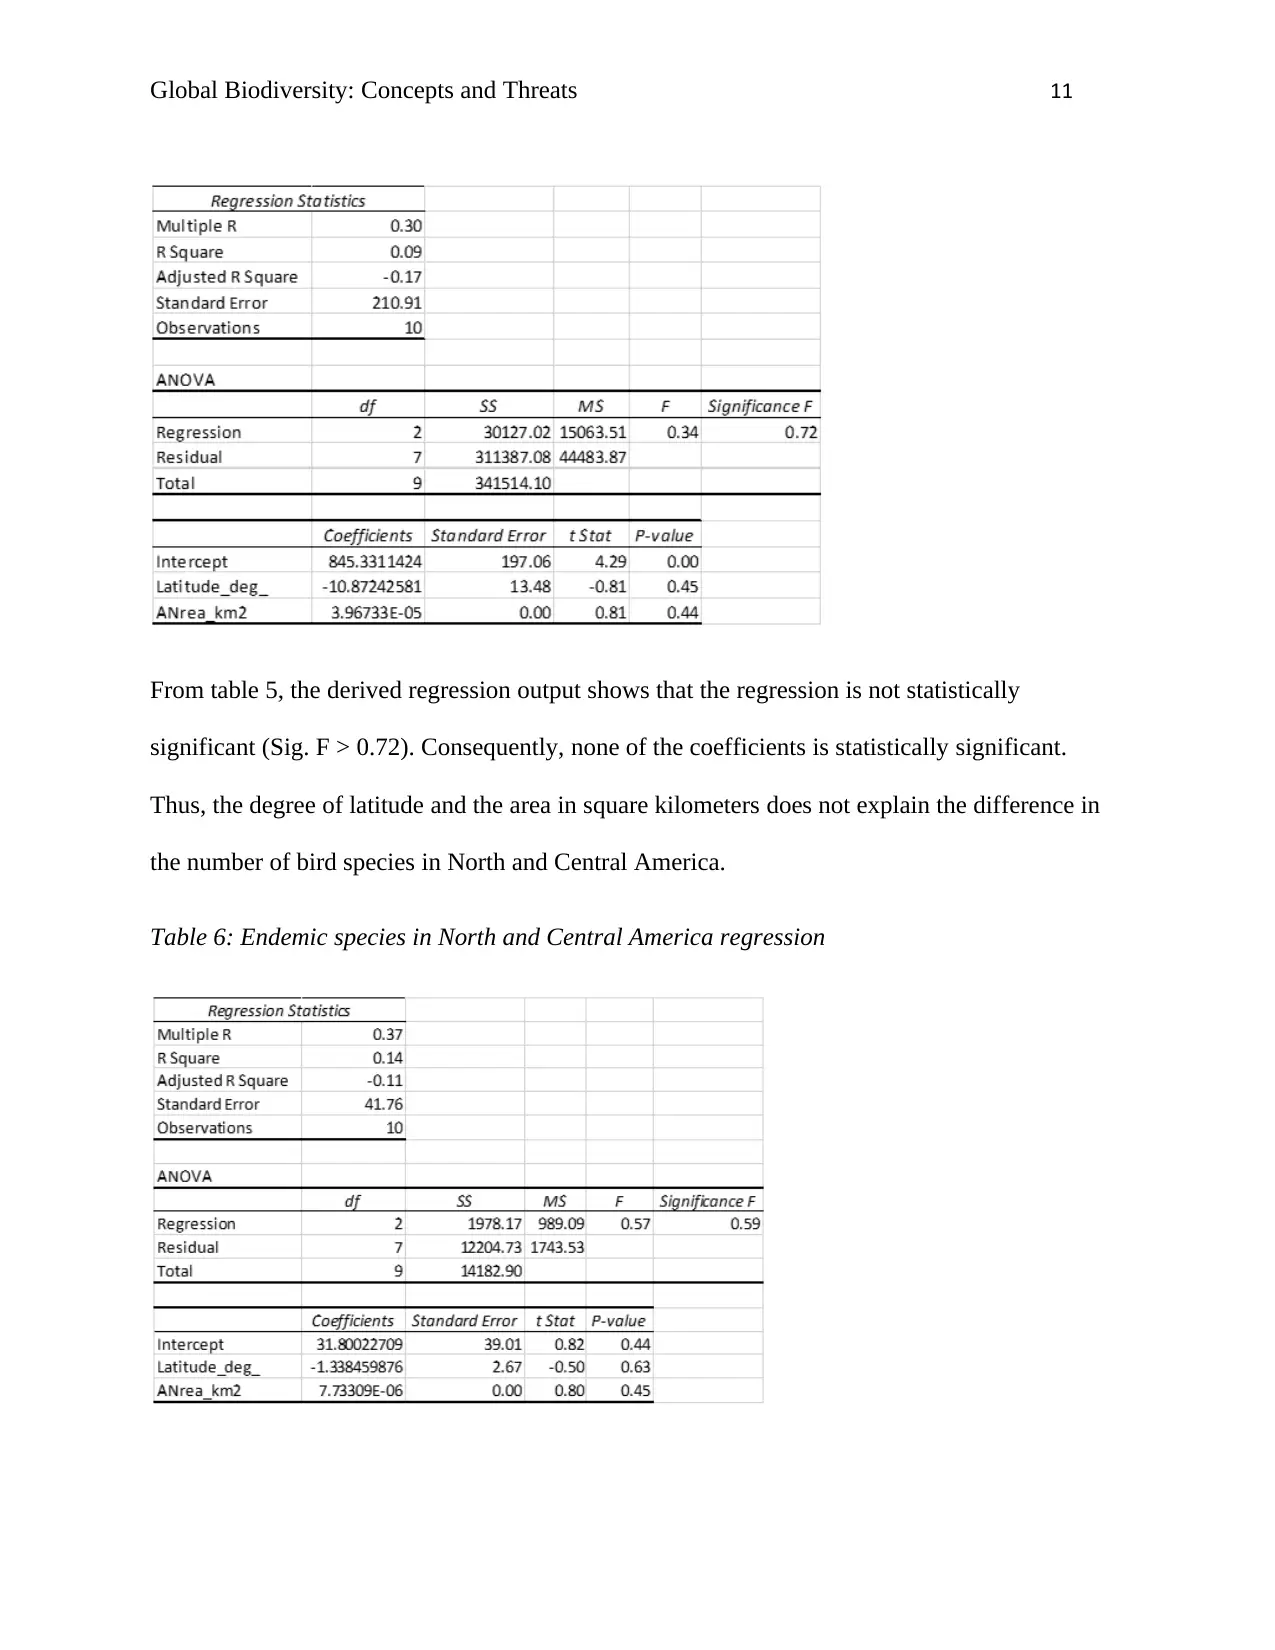
Similarly the difference in the number of bird species across North and Central America was
determined using regression.
Table 5: Bird species in North and Central America regression
Hence, a unit increase in the degree of latitude leads to a 3.16 decrease in the number of bird
species across the Caribbean. Thus, low latitude areas have the highest number of birds
compared to the high areas.
Table 4: Regression output 2
On the other hand, an opposite relationship is seen for endemic. From table 4, it can be seen the
area of land in squared kilometers does impact the level of endemic since it is statistically
significant (p< 0.05). The degree of latitude does not affect since it is not statistically significant
(p > 0.05). The endemic regression is statistically significant (Sig. F < 0.05).
2)
Similarly the difference in the number of bird species across North and Central America was
determined using regression.
Table 5: Bird species in North and Central America regression
Paraphrase This Document
Need a fresh take? Get an instant paraphrase of this document with our AI Paraphraser
Global Biodiversity: Concepts and Threats 11
From table 5, the derived regression output shows that the regression is not statistically
significant (Sig. F > 0.72). Consequently, none of the coefficients is statistically significant.
Thus, the degree of latitude and the area in square kilometers does not explain the difference in
the number of bird species in North and Central America.
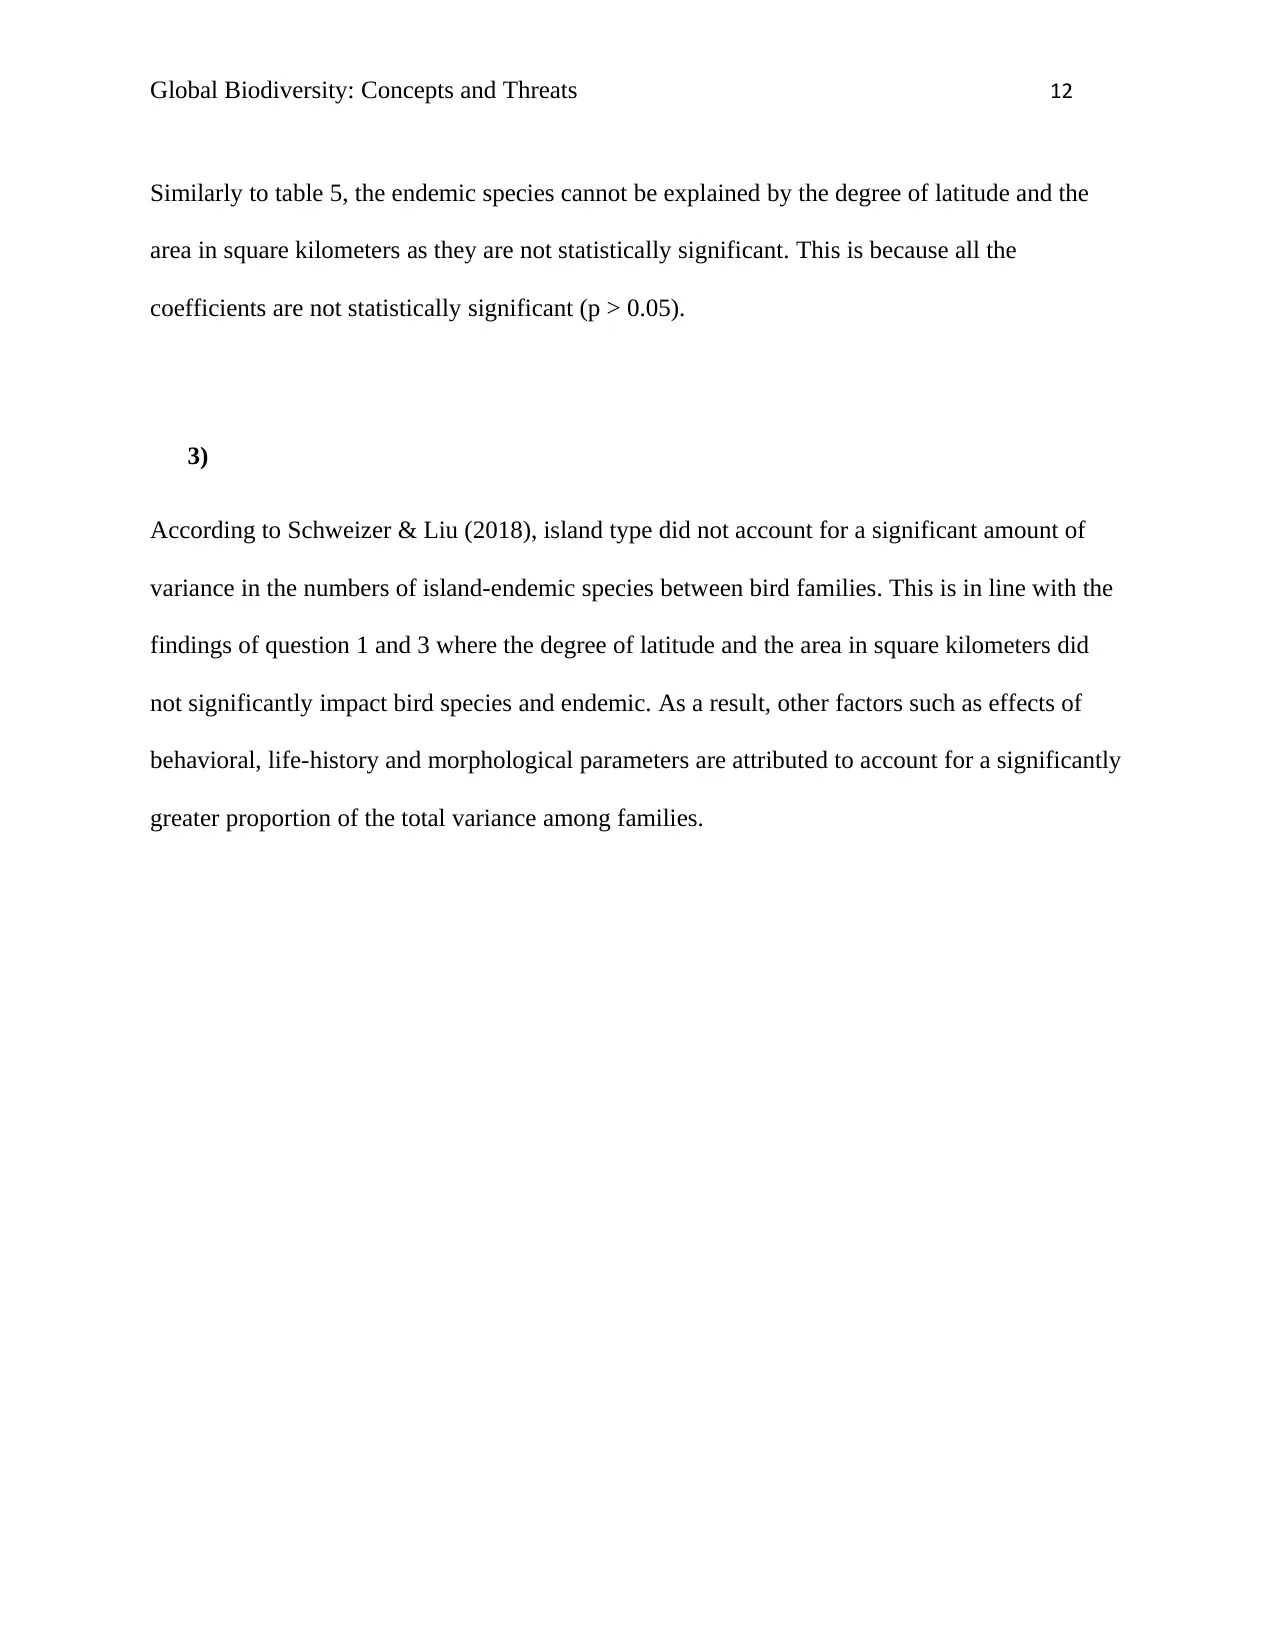
Table 6: Endemic species in North and Central America regression
From table 5, the derived regression output shows that the regression is not statistically
significant (Sig. F > 0.72). Consequently, none of the coefficients is statistically significant.
Thus, the degree of latitude and the area in square kilometers does not explain the difference in
the number of bird species in North and Central America.
Table 6: Endemic species in North and Central America regression
Global Biodiversity: Concepts and Threats 12
Similarly to table 5, the endemic species cannot be explained by the degree of latitude and the
area in square kilometers as they are not statistically significant. This is because all the
coefficients are not statistically significant (p > 0.05).
3)
According to Schweizer & Liu (2018), island type did not account for a significant amount of
variance in the numbers of island-endemic species between bird families. This is in line with the
findings of question 1 and 3 where the degree of latitude and the area in square kilometers did
not significantly impact bird species and endemic. As a result, other factors such as effects of
behavioral, life-history and morphological parameters are attributed to account for a significantly
greater proportion of the total variance among families.
⊘ This is a preview!⊘
Do you want full access?
Subscribe today to unlock all pages.
Trusted by 1+ million students worldwide
1 out of 14
Your All-in-One AI-Powered Toolkit for Academic Success.
+13062052269
info@desklib.com
Available 24*7 on WhatsApp / Email
![[object Object]](/_next/static/media/star-bottom.7253800d.svg)
Unlock your academic potential
Copyright © 2020–2026 A2Z Services. All Rights Reserved. Developed and managed by ZUCOL.