Data Handling with ICT: Statistical Analysis of Global COVID-19 Data

Verified

Added on  2022/12/23

|11
|317
|54
Report
AI Summary
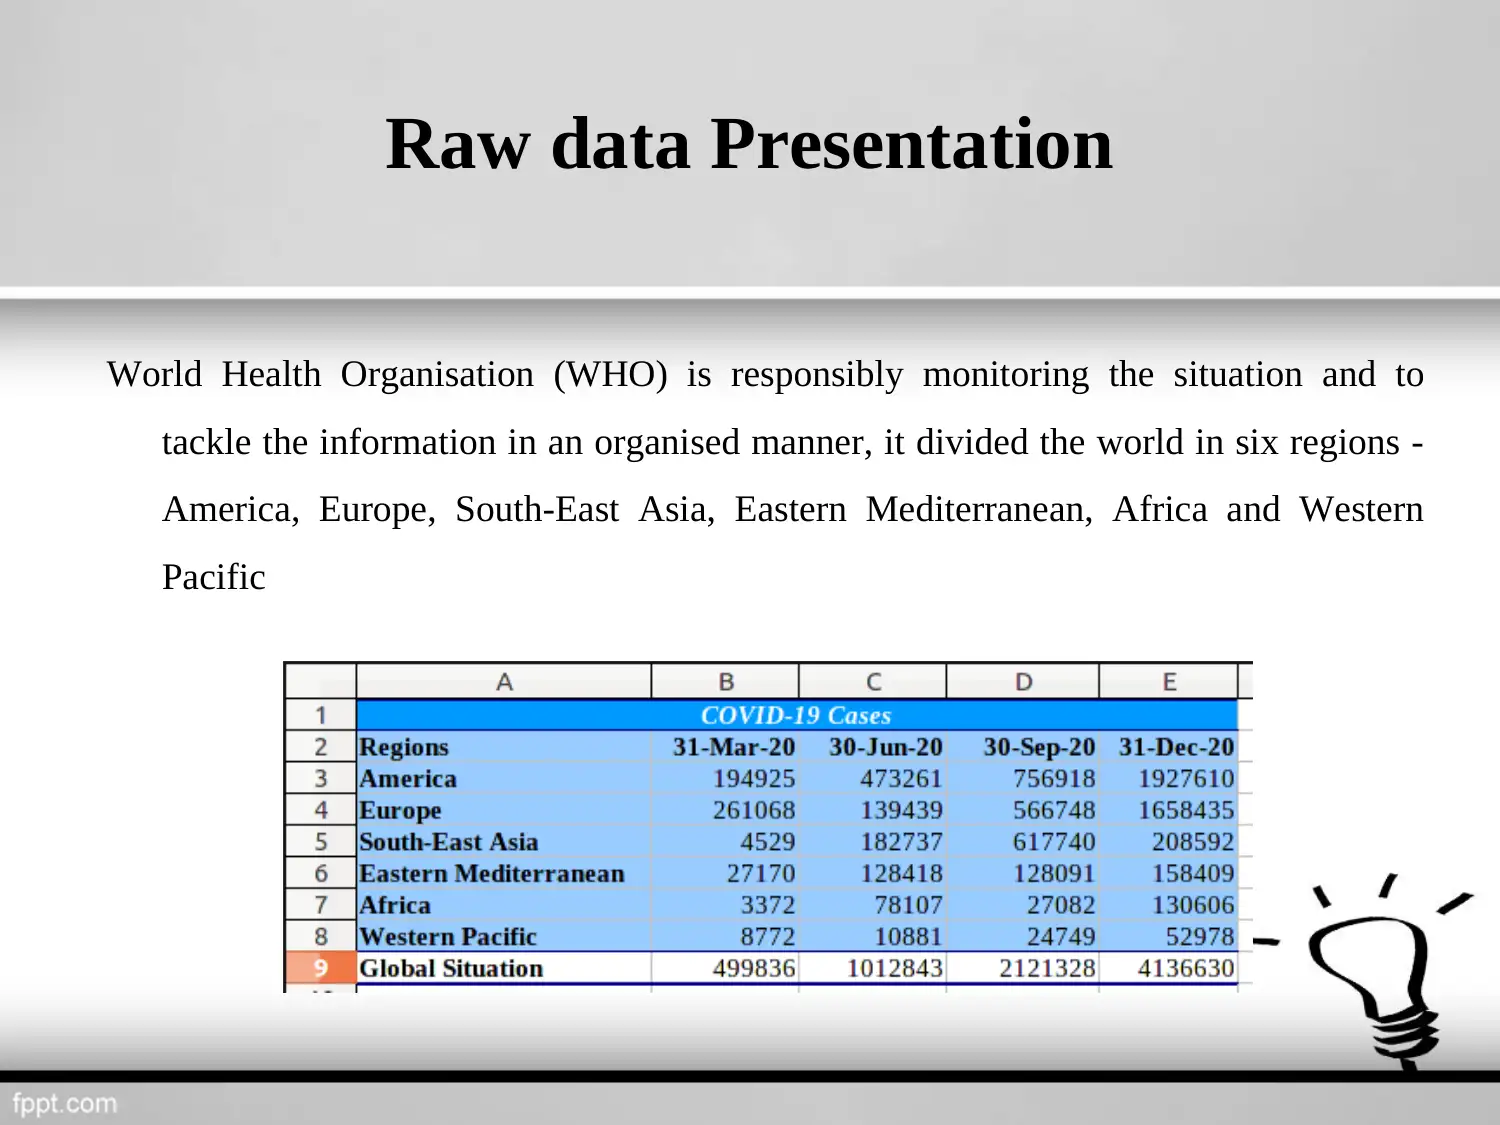
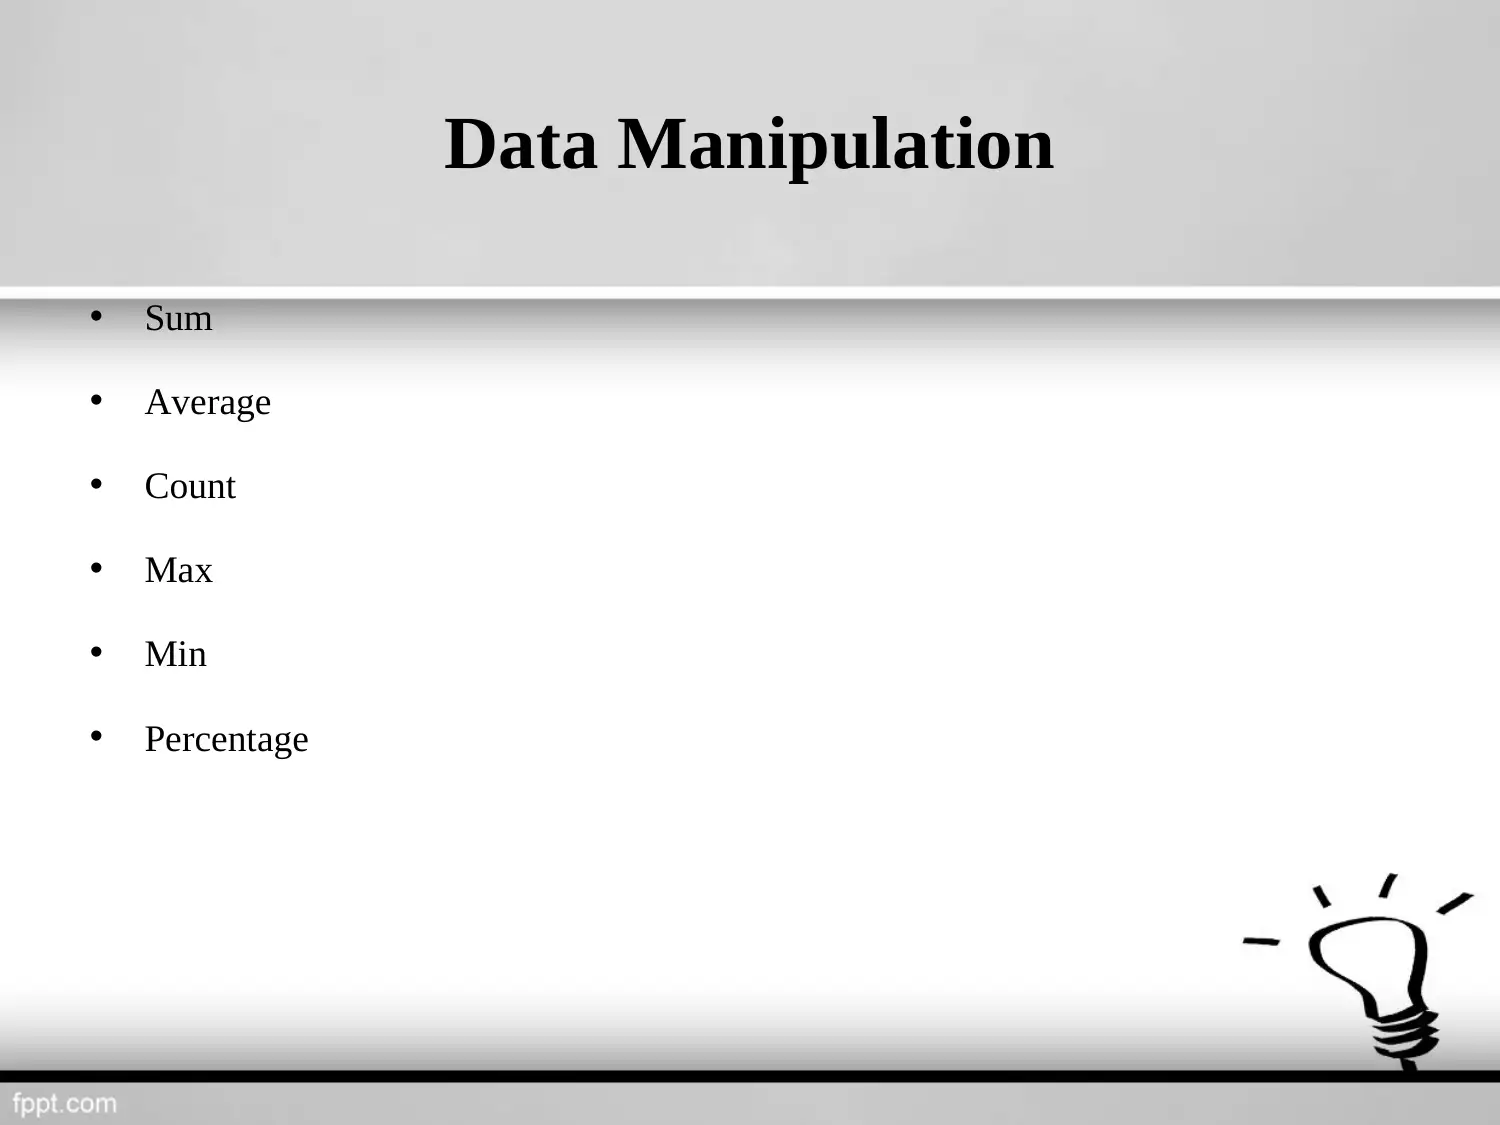
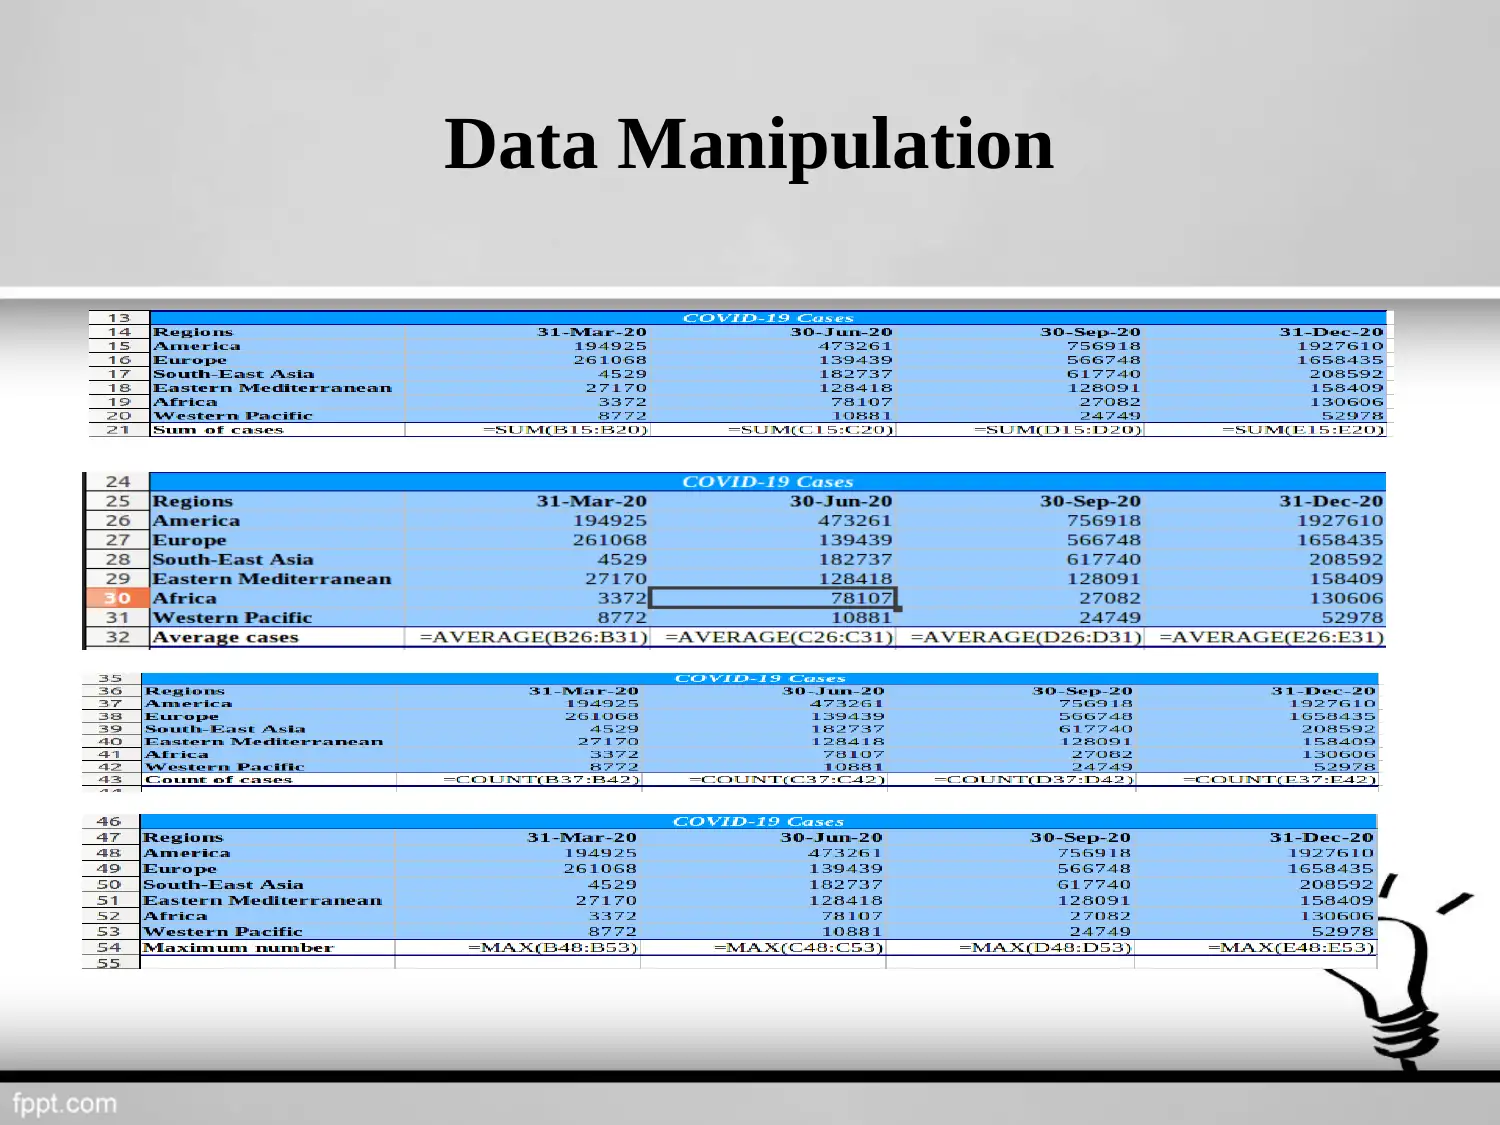
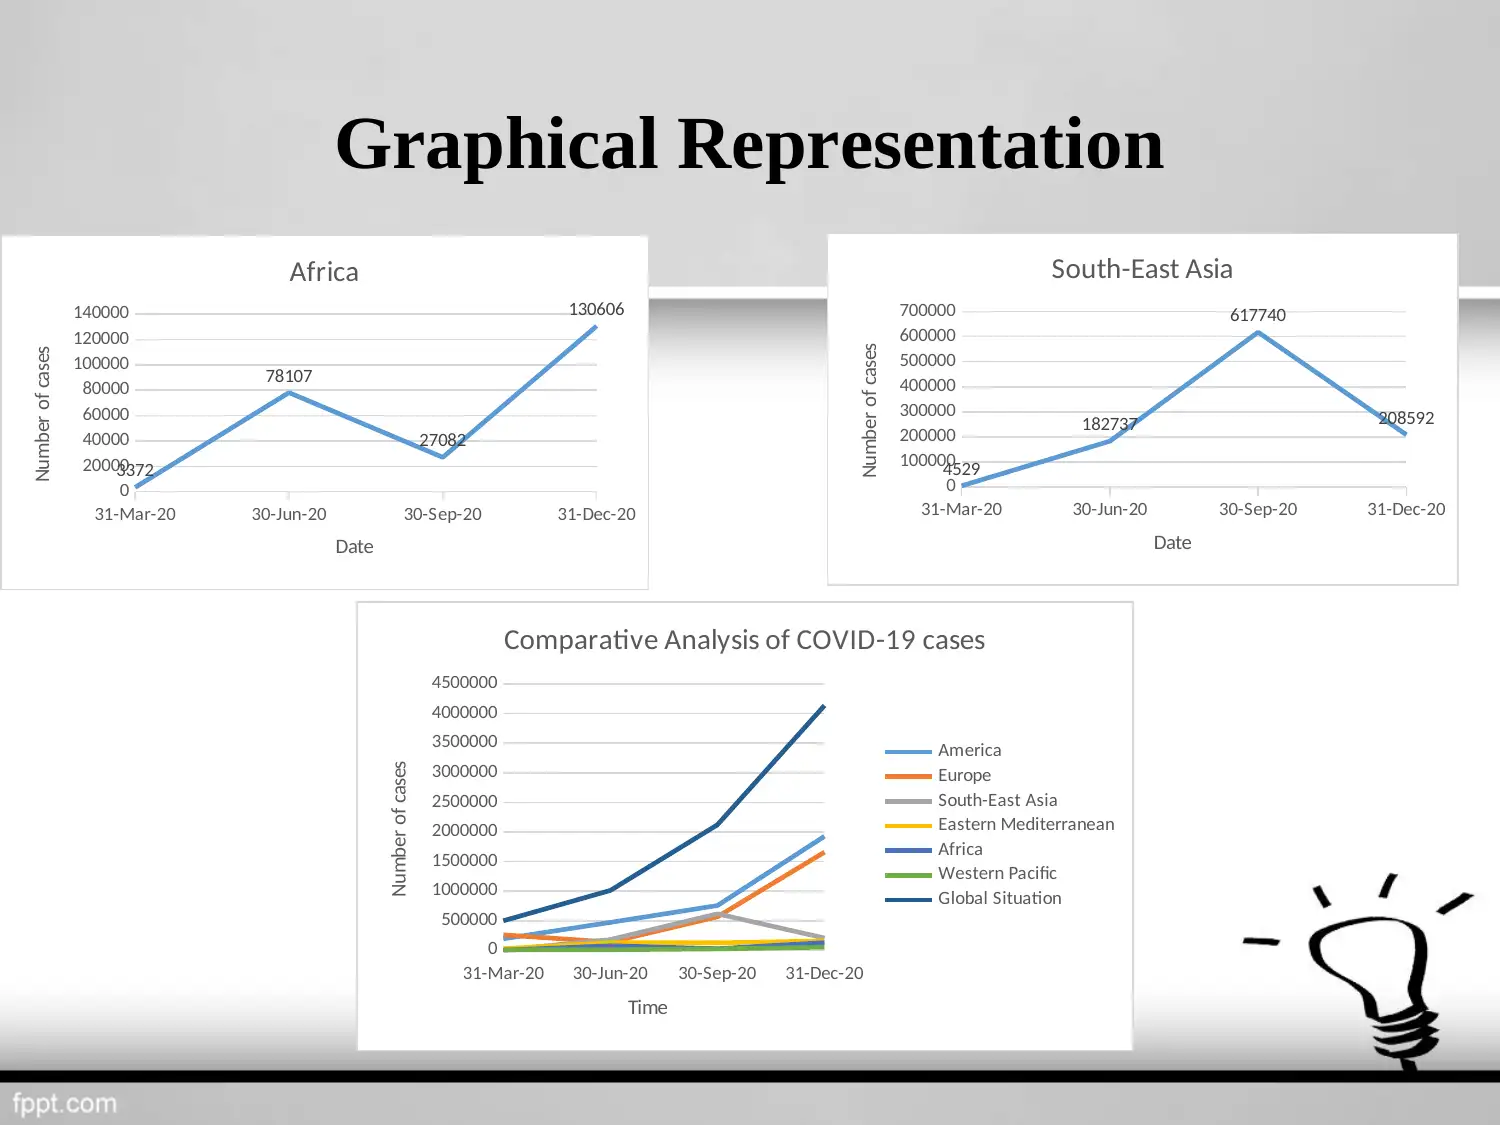
This report explores data handling using Information and Communication Technology (ICT) to analyze the onset and spread of COVID-19 globally. The analysis uses data from the World Health Organization (WHO), dividing the world into six regions: America, Europe, South-East Asia, Eastern Mediterranean, Africa, and Western Pacific. Statistical techniques such as mean, median, and mode are applied, along with data manipulation methods like sum, average, count, max, min, and percentage. The data is graphically represented to show trends in COVID-19 cases across different regions. The conclusion highlights that America experienced the most significant increase in cases, while the Western Pacific saw the least. South-East Asia is noted as the only region with a decline post the third quarter, and Africa showed a fluctuating pattern.
Document Page
Data handling using
ICT
tabler-icon-diamond-filled.svg

Paraphrase This Document

Need a fresh take? Get an instant paraphrase of this document with our AI Paraphraser
Document Page
Table of contents
Introduction
Raw data presentation
Statistical techniques
Data Manipulation
Graphical representation
Conclusion
References
Document Page
Introduction
Data handling using information and communication technology becomes a lot easier
in collecting, summarising, presenting and analysing. This presentation is
researching about the cases of onset and spread of COVID-19 in the world.
Document Page
Raw data Presentation
World Health Organisation (WHO) is responsibly monitoring the situation and to
tackle the information in an organised manner, it divided the world in six regions -
America, Europe, South-East Asia, Eastern Mediterranean, Africa and Western
Pacific
tabler-icon-diamond-filled.svg

Paraphrase This Document

Need a fresh take? Get an instant paraphrase of this document with our AI Paraphraser
Document Page
Statistical techniques
Mean
Median
Mode
Document Page
Data Manipulation
Sum
Average
Count
Max
Min
Percentage
Document Page
Data Manipulation
tabler-icon-diamond-filled.svg

Paraphrase This Document

Need a fresh take? Get an instant paraphrase of this document with our AI Paraphraser
Document Page
Graphical Representation
31-Mar-20 30-Jun-20 30-Sep-20 31-Dec-20
0
500000
1000000
1500000
2000000
2500000
3000000
3500000
4000000
4500000
Comparative Analysis of COVID-19 cases
America
Europe
South-East Asia
Eastern Mediterranean
Africa
Western Pacific
Global Situation
Time
Number of cases
31-Mar-20 30-Jun-20 30-Sep-20 31-Dec-20
0
100000
200000
300000
400000
500000
600000
700000
4529
182737
617740
208592
South-East Asia
Date
Number of cases
31-Mar-20 30-Jun-20 30-Sep-20 31-Dec-20
0
20000
40000
60000
80000
100000
120000
140000
3372
78107
27082
130606
Africa
Date
Number of cases
Document Page
Conclusion
Above assessment has been on data handling using information and communication
technology. It can be concluded from above analysis that America has seen most rise in
the number of cases while Western Pacific has seen least rise in the rate of increase in
cases. Further, South-east Asia is the only region which has seen a decline post third
quarter and Africa is the region which has seen ups then downs and then again ups.
Document Page
References
Online
WHO Coronavirus (COVID-19) Dashboard. 2021. [Online]. Available
through:<https://covid19.who.int/>
tabler-icon-diamond-filled.svg

Paraphrase This Document

Need a fresh take? Get an instant paraphrase of this document with our AI Paraphraser
Document Page
Thank
You
chevron_up_icon
1 out of 11
circle_padding
hide_on_mobile
zoom_out_icon
[object Object]