Global Economy: A Detailed Analysis of Key Economic Indicators

Verified

Added on  2020/05/28

|33
|3696
|433
Report
AI Summary
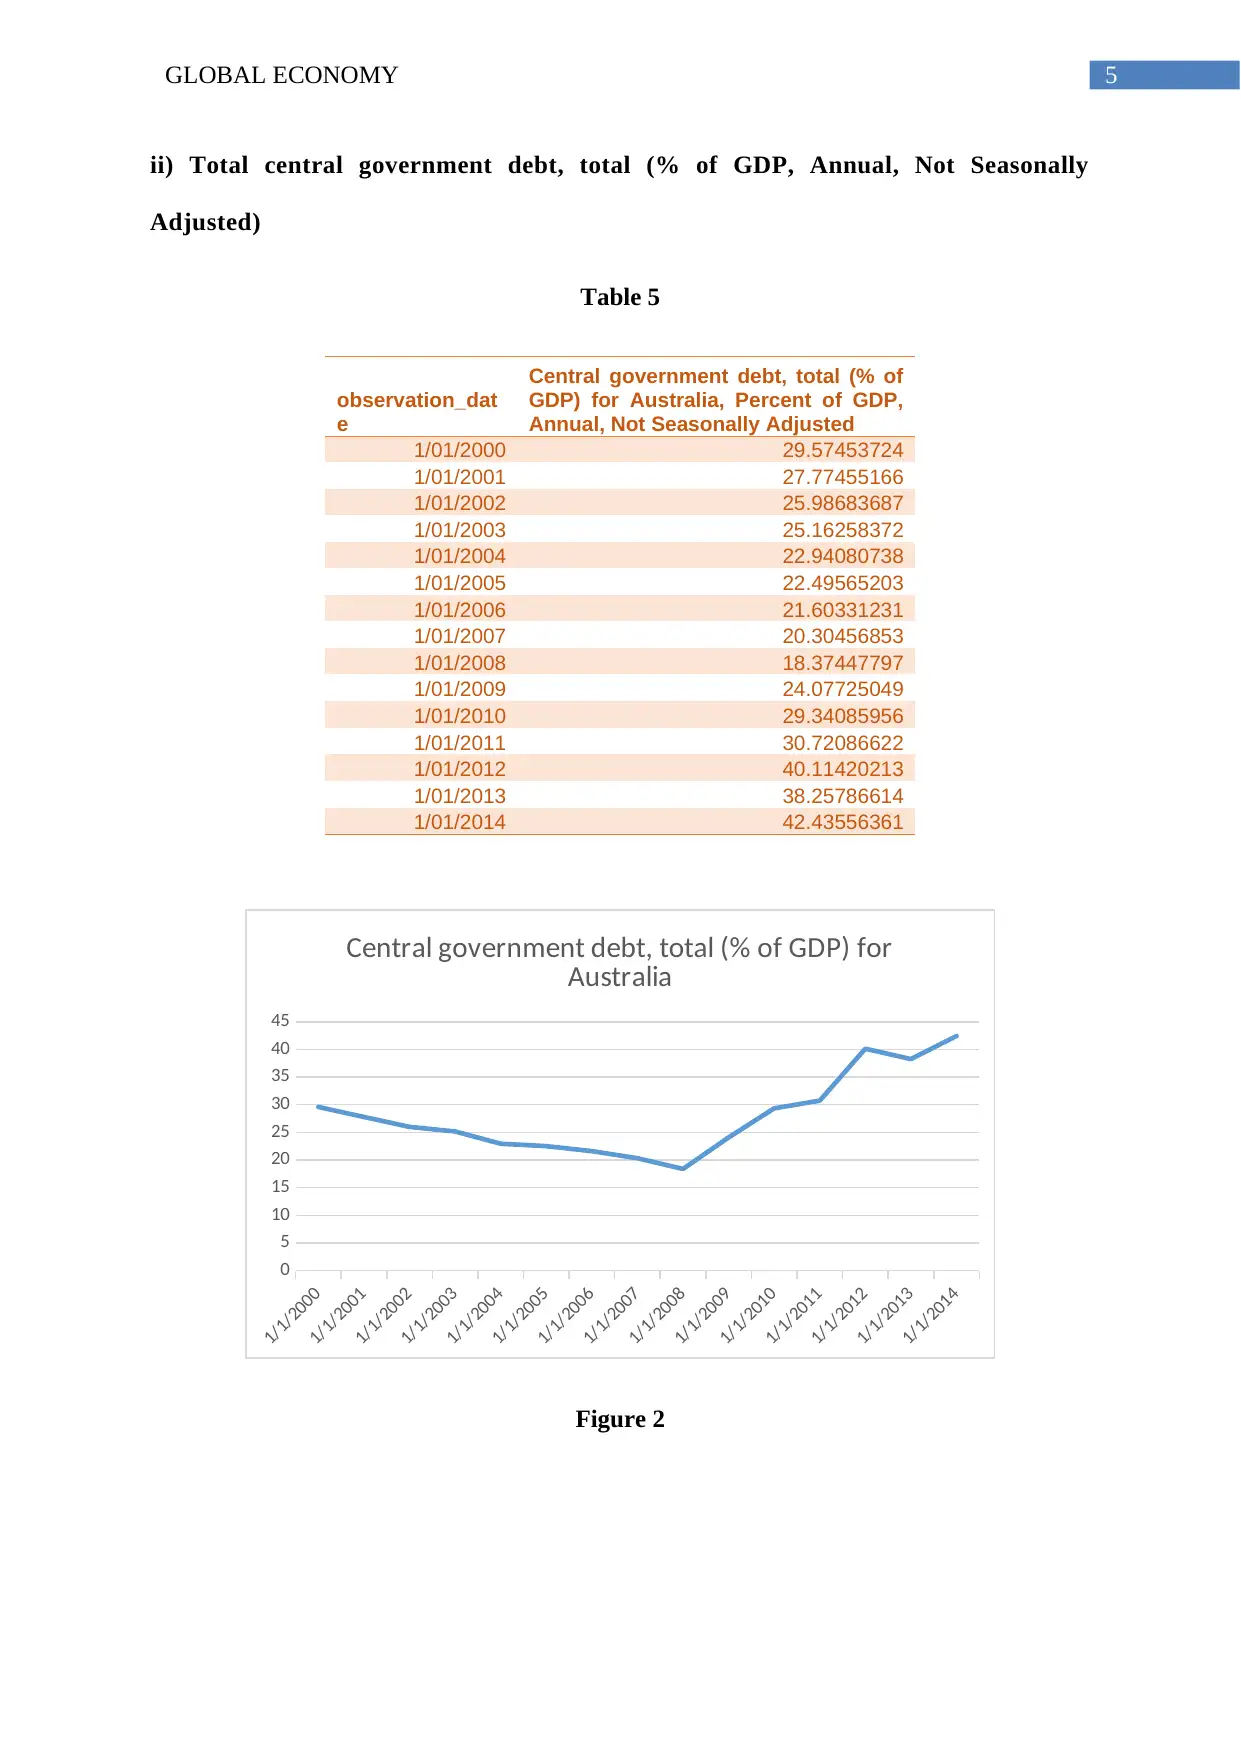
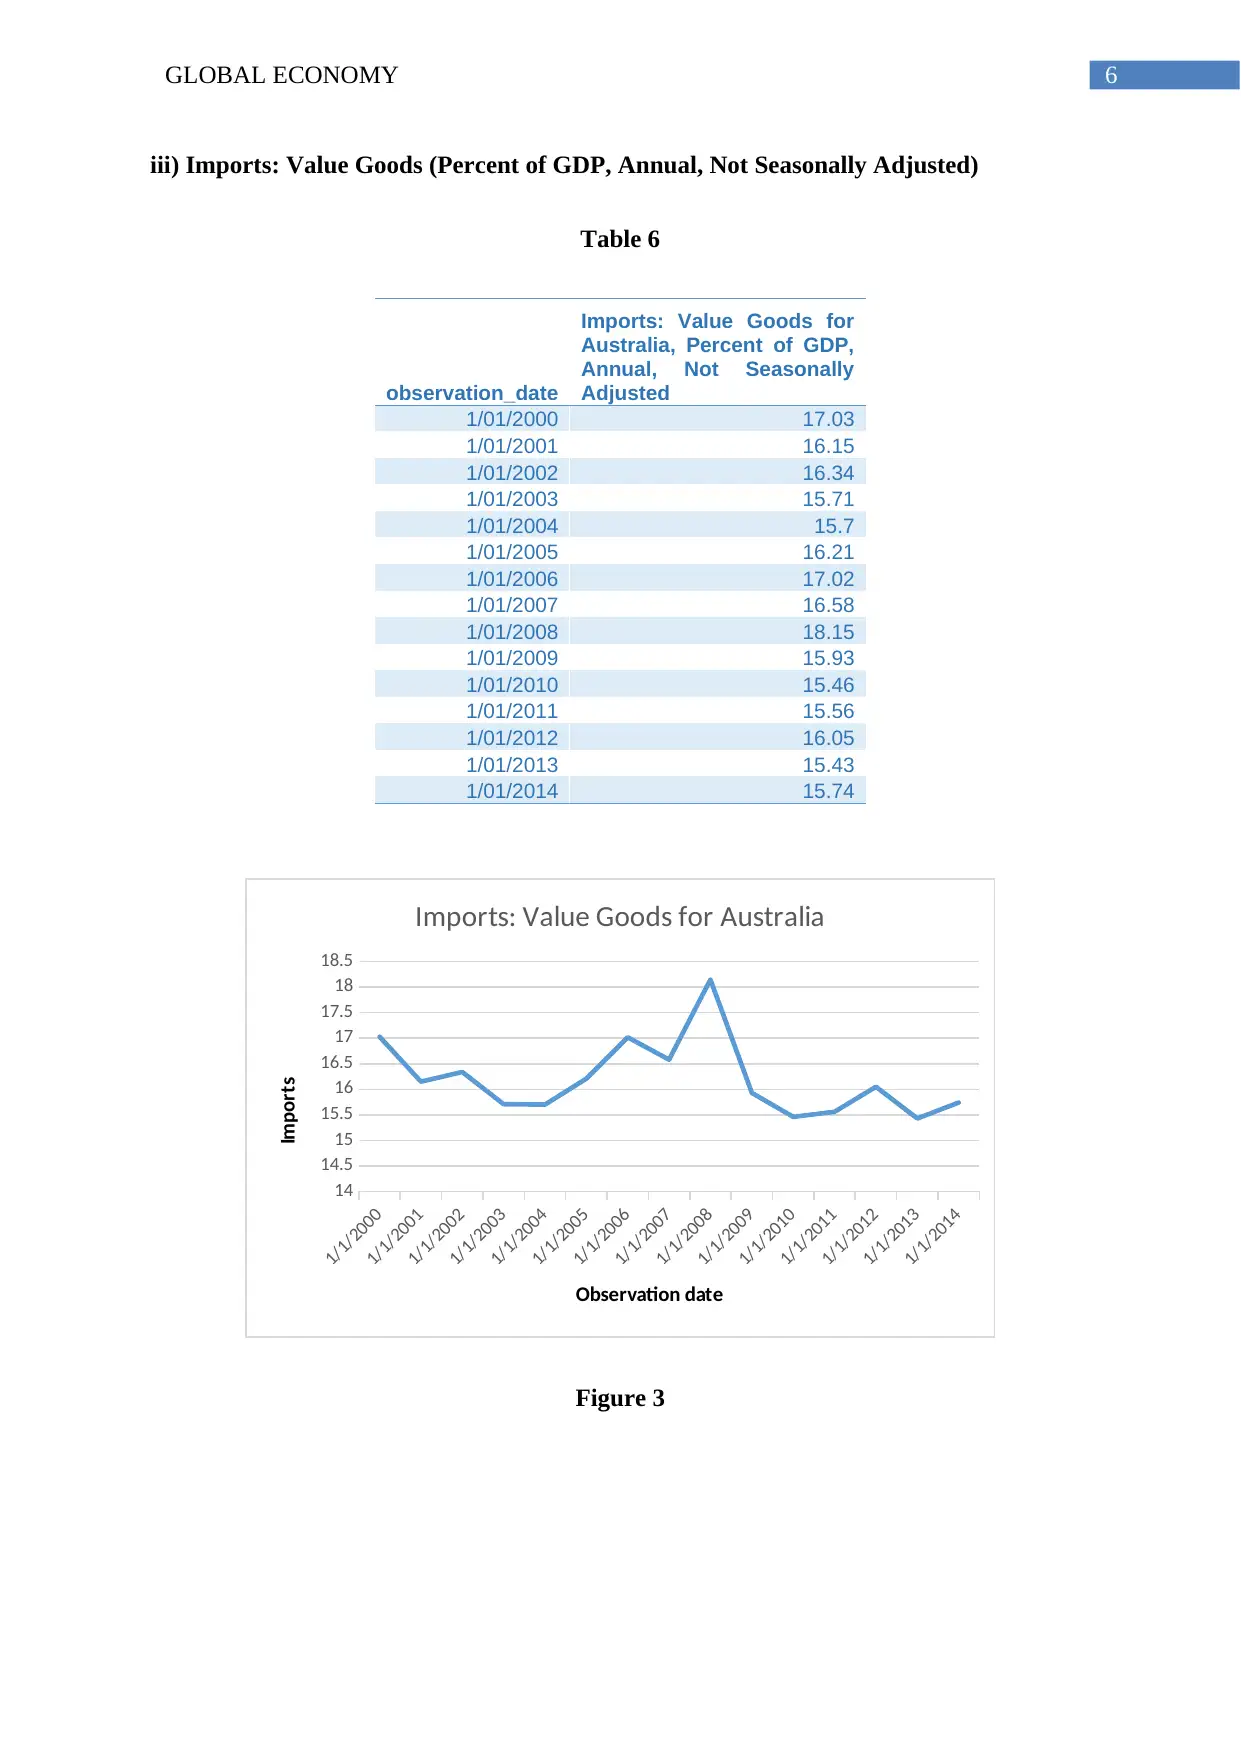
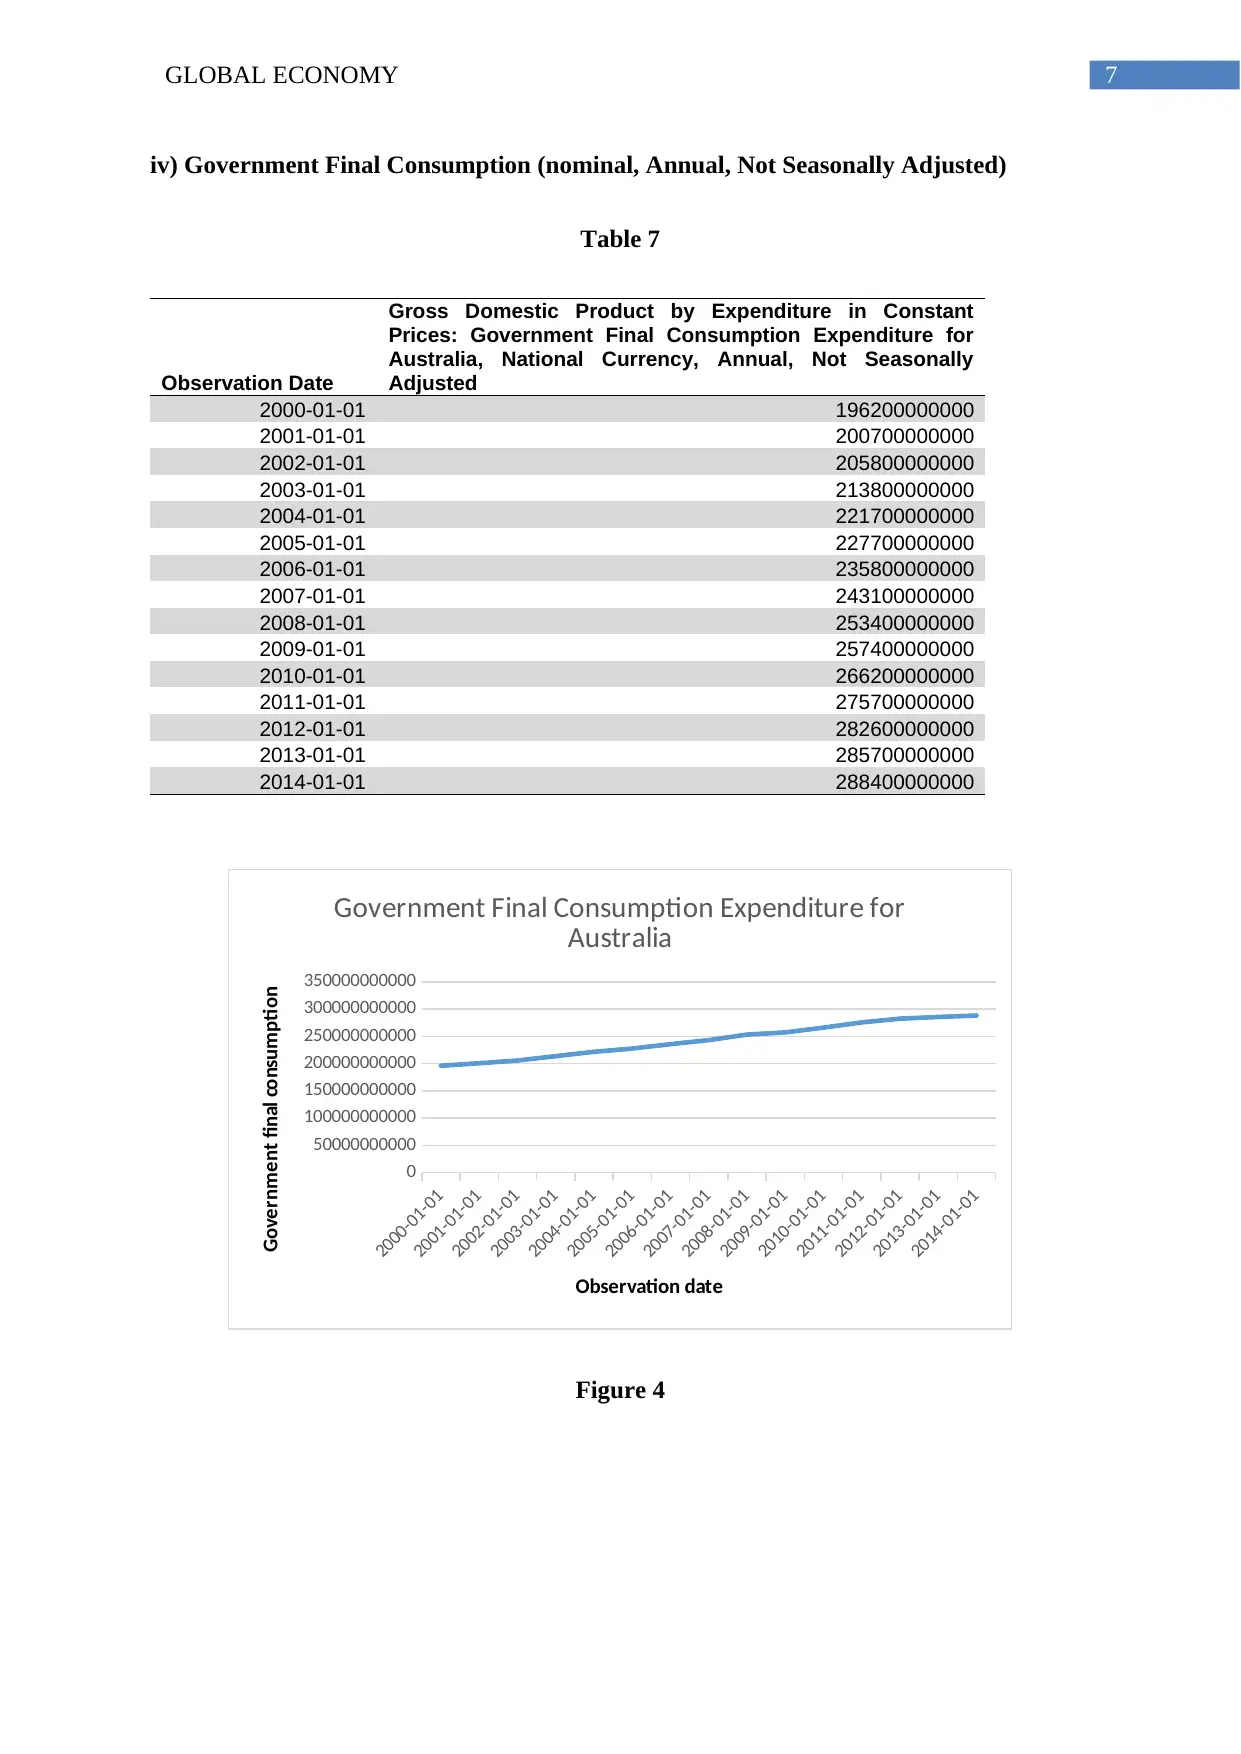
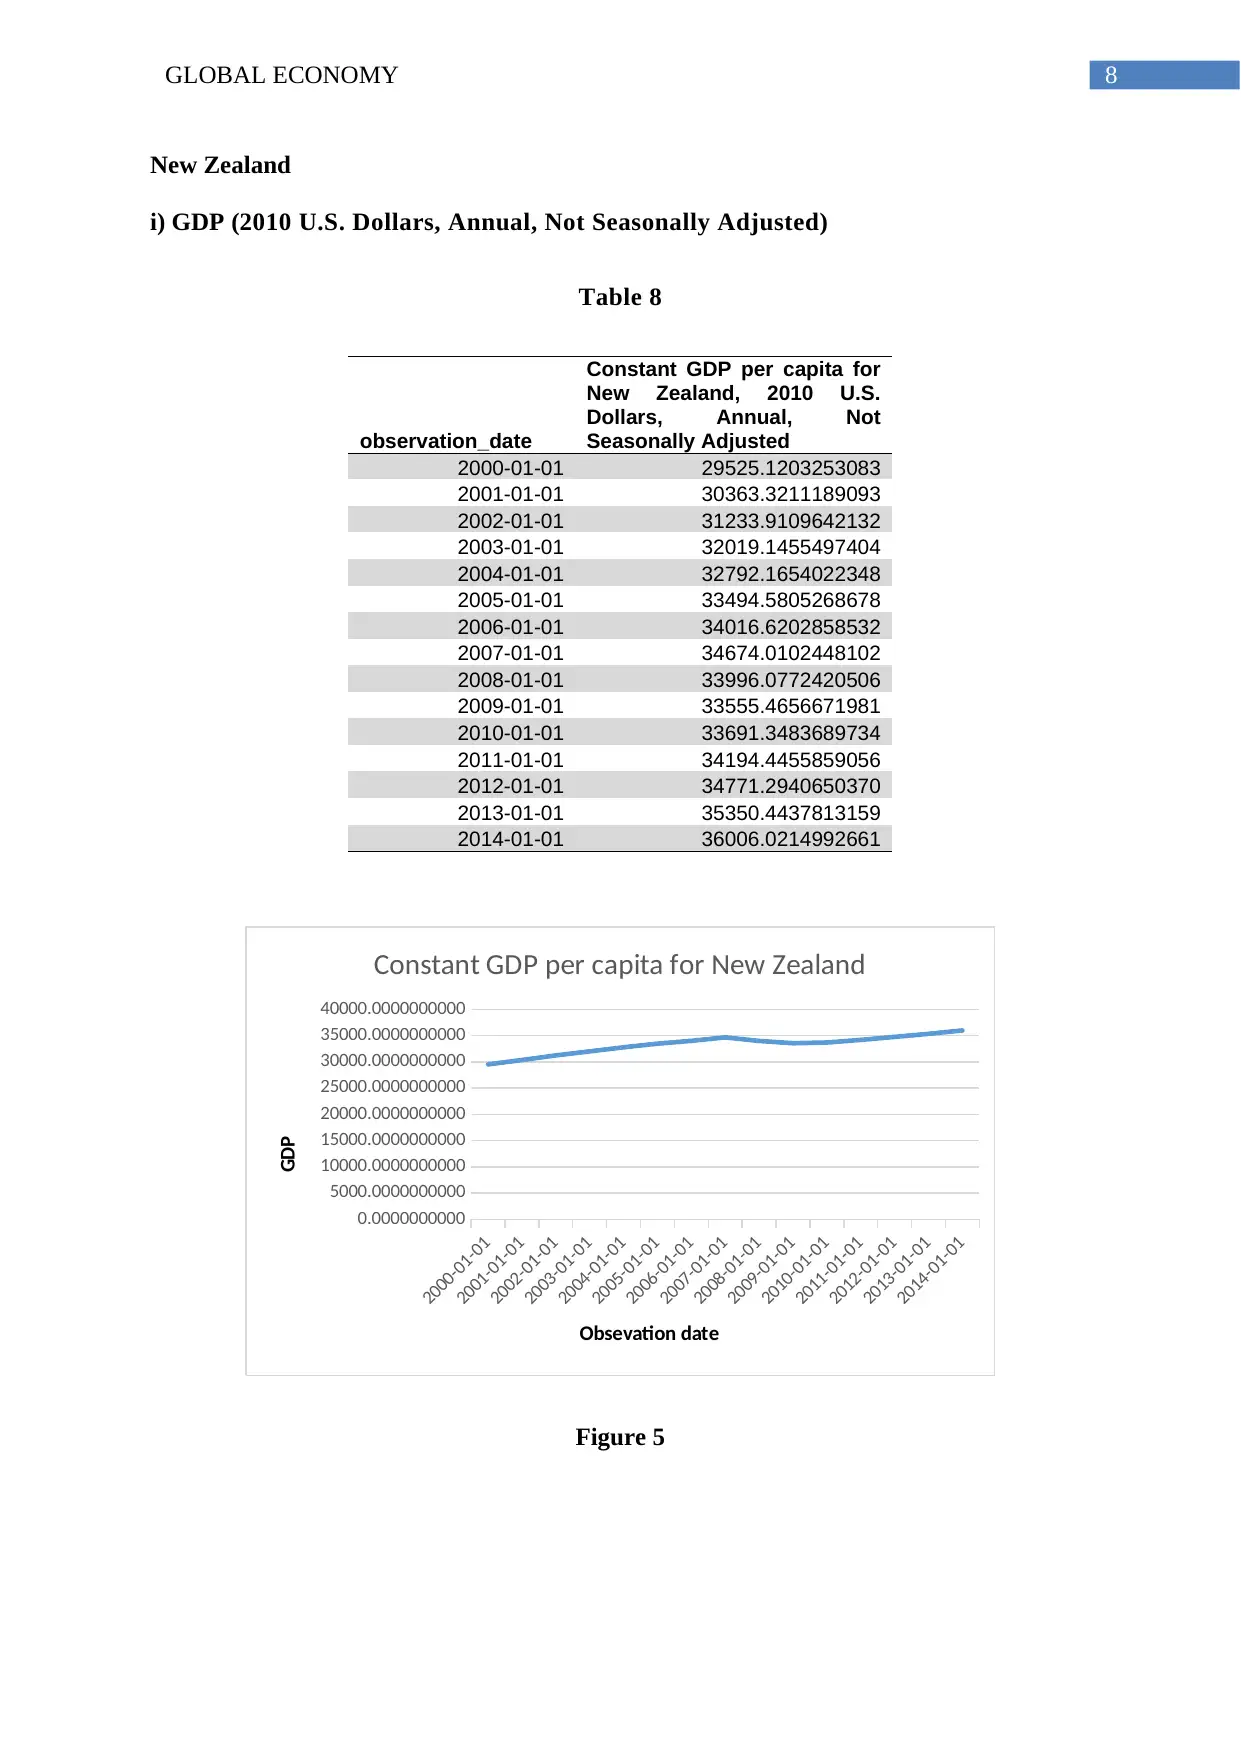
This report provides a comprehensive analysis of the global economy, focusing on the economic performance of Australia, New Zealand, India, and Germany. The analysis includes a review of key economic indicators such as Gross Domestic Product (GDP), government debt, imports, consumer price inflation, and unemployment rates. The report utilizes data from 2000 to 2015 to examine trends and fluctuations in these indicators. The study highlights the growth of GDP in all four nations, with government expenditure playing a significant role. The report also examines the trends in government debt, imports, consumer price inflation, and unemployment rates for each country. The discussion includes an interpretation of the Phillips curve relation. Furthermore, the report includes graphical representations of the data to aid in understanding the economic trends. The analysis also includes a discussion on the effects of a decrease in government expenditure on long-run equilibrium. The report concludes by summarizing the key findings and offering insights into the economic performance of the four nations.
Document Page
Running Head: GLOBAL ECONOMY
Global Economy
Name of the Student
Name of the University
Author note
tabler-icon-diamond-filled.svg

Paraphrase This Document

Need a fresh take? Get an instant paraphrase of this document with our AI Paraphraser
Document Page
1GLOBAL ECONOMY
Table of Contents
Part A.........................................................................................................................................2
Answer 1................................................................................................................................2
Answer 2................................................................................................................................3
Australia.............................................................................................................................3
New Zealand......................................................................................................................7
India..................................................................................................................................11
Germany...........................................................................................................................15
Answer 3..............................................................................................................................20
Consumer Price Inflation.....................................................................................................20
Unemployment rate for population aged 15 and over..........................................................21
Part B........................................................................................................................................23
Part C........................................................................................................................................26
Introduction..............................................................................................................................26
Desired Job Role......................................................................................................................26
Why Policy Analyst?................................................................................................................27
Video Interpretation.................................................................................................................28
Action Plan...........................................................................................................................28
References................................................................................................................................30
Document Page
2GLOBAL ECONOMY
Document Page
3GLOBAL ECONOMY
Part A
Answer 1
Table 1
6th, 7th, 8th,9th and 10th position in bilateral trade with Australia in 2014
Rank Country Trade volume (A$ million)
6th New Zealand 23,484
7th Singapore 29,580
8th Thailand 18,986
9th India 15,763
10th Germany 17,504
(Source: dfat.gov.au 2016)
Table 2
Rank of the previous countries in Australia's top export in 2015
Country Position Export Volume (A$ Million)
New Zealand 7th 12,498
Singapore 9th 11,012
Thailand 14th 5,307
India 6th 13,395
Germany 15th 3,127
Table 3
Top ten exports from Australia in 2016
Rank Commodity Values of export(A$
million)
Percentage
share
1 Iron ores & concentrates 53,757 16.3
2 Coal 37,999 12.8
3 Education-related travel services 21,966 6.6
4 Gold 18,857 5.7
5 Natural gas 17,912 5.4
6 Personal travel (excl education)
services
17,412 5.3
7 Beef, f.c.f. 7,401 2.2
8 Aluminium ores & conc (incl
alumina)
6,460 2
9 Wheat 4,853 1.5
10 Professional services 4,779 1.4
tabler-icon-diamond-filled.svg

Paraphrase This Document

Need a fresh take? Get an instant paraphrase of this document with our AI Paraphraser
Document Page
4GLOBAL ECONOMY
Answer 2
Australia
i) GDP (2010 U.S. Dollars, Annual, Not Seasonally Adjusted)
Table 4
observation_date
Constant GDP per capita
for Australia, 2010 U.S.
Dollars, Annual, Not
Seasonally Adjusted
1/01/2000 44223.59124
1/01/2001 44473.40861
1/01/2002 45626.62203
1/01/2003 46449.84519
1/01/2004 47817.89923
1/01/2005 48702.73469
1/01/2006 49418.68632
1/01/2007 50952.46704
1/01/2008 51788.44015
1/01/2009 51651.22326
1/01/2010 51874.08048
1/01/2011 52372.15454
1/01/2012 53348.38897
1/01/2013 53798.35851
1/01/2014 54394.33427
(Source: fred.stlouisfed.org 2018)
1/1/2000
1/1/2001
1/1/2002
1/1/2003
1/1/2004
1/1/2005
1/1/2006
1/1/2007
1/1/2008
1/1/2009
1/1/2010
1/1/2011
1/1/2012
1/1/2013
1/1/2014
0
10000
20000
30000
40000
50000
60000
GDP for Australia
Observation date
GDP
Figure 1
Document Page
5GLOBAL ECONOMY
ii) Total central government debt, total (% of GDP, Annual, Not Seasonally
Adjusted)
Table 5
observation_dat
e
Central government debt, total (% of
GDP) for Australia, Percent of GDP,
Annual, Not Seasonally Adjusted
1/01/2000 29.57453724
1/01/2001 27.77455166
1/01/2002 25.98683687
1/01/2003 25.16258372
1/01/2004 22.94080738
1/01/2005 22.49565203
1/01/2006 21.60331231
1/01/2007 20.30456853
1/01/2008 18.37447797
1/01/2009 24.07725049
1/01/2010 29.34085956
1/01/2011 30.72086622
1/01/2012 40.11420213
1/01/2013 38.25786614
1/01/2014 42.43556361
1/1/2000
1/1/2001
1/1/2002
1/1/2003
1/1/2004
1/1/2005
1/1/2006
1/1/2007
1/1/2008
1/1/2009
1/1/2010
1/1/2011
1/1/2012
1/1/2013
1/1/2014
0
5
10
15
20
25
30
35
40
45
Central government debt, total (% of GDP) for
Australia
Figure 2
Document Page
6GLOBAL ECONOMY
iii) Imports: Value Goods (Percent of GDP, Annual, Not Seasonally Adjusted)
Table 6
observation_date
Imports: Value Goods for
Australia, Percent of GDP,
Annual, Not Seasonally
Adjusted
1/01/2000 17.03
1/01/2001 16.15
1/01/2002 16.34
1/01/2003 15.71
1/01/2004 15.7
1/01/2005 16.21
1/01/2006 17.02
1/01/2007 16.58
1/01/2008 18.15
1/01/2009 15.93
1/01/2010 15.46
1/01/2011 15.56
1/01/2012 16.05
1/01/2013 15.43
1/01/2014 15.74
1/1/2000
1/1/2001
1/1/2002
1/1/2003
1/1/2004
1/1/2005
1/1/2006
1/1/2007
1/1/2008
1/1/2009
1/1/2010
1/1/2011
1/1/2012
1/1/2013
1/1/2014
14
14.5
15
15.5
16
16.5
17
17.5
18
18.5
Imports: Value Goods for Australia
Observation date
Imports
Figure 3
tabler-icon-diamond-filled.svg

Paraphrase This Document

Need a fresh take? Get an instant paraphrase of this document with our AI Paraphraser
Document Page
7GLOBAL ECONOMY
iv) Government Final Consumption (nominal, Annual, Not Seasonally Adjusted)
Table 7
Observation Date
Gross Domestic Product by Expenditure in Constant
Prices: Government Final Consumption Expenditure for
Australia, National Currency, Annual, Not Seasonally
Adjusted
2000-01-01 196200000000
2001-01-01 200700000000
2002-01-01 205800000000
2003-01-01 213800000000
2004-01-01 221700000000
2005-01-01 227700000000
2006-01-01 235800000000
2007-01-01 243100000000
2008-01-01 253400000000
2009-01-01 257400000000
2010-01-01 266200000000
2011-01-01 275700000000
2012-01-01 282600000000
2013-01-01 285700000000
2014-01-01 288400000000
2000-01-01
2001-01-01
2002-01-01
2003-01-01
2004-01-01
2005-01-01
2006-01-01
2007-01-01
2008-01-01
2009-01-01
2010-01-01
2011-01-01
2012-01-01
2013-01-01
2014-01-01
0
50000000000
100000000000
150000000000
200000000000
250000000000
300000000000
350000000000
Government Final Consumption Expenditure for
Australia
Observation date
Government final consumption
Figure 4
Document Page
8GLOBAL ECONOMY
New Zealand
i) GDP (2010 U.S. Dollars, Annual, Not Seasonally Adjusted)
Table 8
observation_date
Constant GDP per capita for
New Zealand, 2010 U.S.
Dollars, Annual, Not
Seasonally Adjusted
2000-01-01 29525.1203253083
2001-01-01 30363.3211189093
2002-01-01 31233.9109642132
2003-01-01 32019.1455497404
2004-01-01 32792.1654022348
2005-01-01 33494.5805268678
2006-01-01 34016.6202858532
2007-01-01 34674.0102448102
2008-01-01 33996.0772420506
2009-01-01 33555.4656671981
2010-01-01 33691.3483689734
2011-01-01 34194.4455859056
2012-01-01 34771.2940650370
2013-01-01 35350.4437813159
2014-01-01 36006.0214992661
2000-01-01
2001-01-01
2002-01-01
2003-01-01
2004-01-01
2005-01-01
2006-01-01
2007-01-01
2008-01-01
2009-01-01
2010-01-01
2011-01-01
2012-01-01
2013-01-01
2014-01-01
0.0000000000
5000.0000000000
10000.0000000000
15000.0000000000
20000.0000000000
25000.0000000000
30000.0000000000
35000.0000000000
40000.0000000000
Constant GDP per capita for New Zealand
Obsevation date
GDP
Figure 5
Document Page
9GLOBAL ECONOMY
ii) Total central government debt, total (% of GDP, Annual, Not Seasonally
Adjusted)
Table 9
observation_
date
Central
government
debt, total (% of
GDP) for New
Zealand,
Percent of GDP,
Annual, Not
Seasonally
Adjusted
2002-01-01 32.77614179
2003-01-01 48.24533847
2004-01-01 43.86723279
2005-01-01 44.17012017
2006-01-01 42.92628509
2007-01-01 36.94151271
2008-01-01 36.05583888
2009-01-01 47.18888152
2010-01-01 49.2045015
2011-01-01 62.57289131
2012-01-01 67.1484011
2013-01-01 59.37423329
2014-01-01 56.78293776
2002-01-01
2003-01-01
2004-01-01
2005-01-01
2006-01-01
2007-01-01
2008-01-01
2009-01-01
2010-01-01
2011-01-01
2012-01-01
2013-01-01
2014-01-01
0
10
20
30
40
50
60
70
80
Central government debt, total (% of GDP) for
New Zealand
Observation date
Central Govrnment debt
Figure 6
tabler-icon-diamond-filled.svg

Paraphrase This Document

Need a fresh take? Get an instant paraphrase of this document with our AI Paraphraser
Document Page
10GLOBAL ECONOMY
iii) Imports: Value Goods (Percent of GDP, Annual, Not Seasonally Adjusted)
Table 10
observation_date
Imports: Value Goods
for New Zealand,
Percent of GDP,
Annual, Not
Seasonally Adjusted
2000-01-01 25.9
2001-01-01 25.12
2002-01-01 24.19
2003-01-01 22.47
2004-01-01 22.73
2005-01-01 23.2
2006-01-01 24.15
2007-01-01 22.84
2008-01-01 25.46
2009-01-01 21.02
2010-01-01 21.03
2011-01-01 22.24
2012-01-01 21.87
2013-01-01 21.21
2014-01-01 21.38
2000-01-01
2001-01-01
2002-01-01
2003-01-01
2004-01-01
2005-01-01
2006-01-01
2007-01-01
2008-01-01
2009-01-01
2010-01-01
2011-01-01
2012-01-01
2013-01-01
2014-01-01
0
5
10
15
20
25
30
Imports: Value Goods for New Zealand
Observation date
Imports
Figure 7
Document Page
11GLOBAL ECONOMY
chevron_up_icon
1 out of 33
circle_padding
hide_on_mobile
zoom_out_icon
[object Object]